HAL Id: hal-01697530
https://hal.archives-ouvertes.fr/hal-01697530
Submitted on 31 Jan 2018
HAL is a multi-disciplinary open access
archive for the deposit and dissemination of
sci-entific research documents, whether they are
pub-lished or not. The documents may come from
teaching and research institutions in France or
abroad, or from public or private research centers.
L’archive ouverte pluridisciplinaire HAL, est
destinée au dépôt et à la diffusion de documents
scientifiques de niveau recherche, publiés ou non,
émanant des établissements d’enseignement et de
recherche français ou étrangers, des laboratoires
publics ou privés.
Signal In A Source / Filter Model Of Contact Sounds
Mathieu Lagrange, Gary Scavone, Philippe Depalle
To cite this version:
Mathieu Lagrange, Gary Scavone, Philippe Depalle. Time-Domain Analysis / Synthesis Of The
Excitation Signal In A Source / Filter Model Of Contact Sounds. ICAD, 2008, Paris, France.
�hal-01697530�
TIME-DOMAIN ANALYSIS / SYNTHESIS OF THE EXCITATION SIGNAL IN A SOURCE /
FILTER MODEL OF CONTACT SOUNDS
Mathieu Lagrange, Gary Scavone, Philippe Depalle
Music Technology Area, CIRMMT,
Schulich School of Music, McGill University
Montr´eal, Canada
mathieu.lagrange@mcgill.ca
ABSTRACT
Contact sounds represent an important subset of environmen-tal sounds that are useful for enhancing the interaction of a user with a computer-simulated virtual reality or augmented environ-ment. The real-time synthesis of these sounds has received much attention in the auditory display community and some convincing results have been achieved[1,2].
This paper focuses on the modeling, analysis, and synthesis of more complex contact interactions, such as sliding, rolling and bouncing. We assume the widely adopted source-filter approach and use a modal representation of the filter component. In this pa-per, an explicit time-domain model of the excitation is proposed that produces promising results. The main advantages of the pro-posed model is that it allows a compact and versatile representation of the system, as well as an efficient synthesis scheme.
1. INTRODUCTION
The proliferation of virtual reality applications has lead to a strong demand for efficient contact sound synthesis algorithms, in part because the associated video processing components of such sys-tems typically require significant processing resources. In many human computer interaction (HCI) applications, we are interested in the synthesis of contact sounds that are relevant to the interac-tion of the user with the virtual or augmented environment.
Perceptual studies [3,4] show that the use of the human audi-tory modality is extremely useful for improving the user’s sense of immersion in a virtual reality environment. However, the auditory system is extremely sensitive and sounds that are not perceived as natural will negatively impact this immersion.
The evaluation of a sound’s “naturalness” is not clearly defined [5,6]. In our study, we can state that the sound should be relevant to the type of interaction (e.g. plausible) and that the sound should be uniquely related to a specific interaction (e.g. unicity). For ex-ample, a recorded sound that is simply repeated each time an inter-action occurs may become implausible because it lacks variations over time.
Contact sounds are typically produced by the interaction of two physical bodies in a fluid (usually air). The vibrations of the two bodies then travel within the air to reach the ear. As-suming that there is no strong coupling between the two objects, this interaction chain can be approximated by a simple convolu-tion sum: the excitaconvolu-tion signal is convolved with the body-to-air transfer functions of the interacting bodies, then with the room [7] response, and finally with the anechoic recorded listener body re-sponse (the Head Related Transfer Function or HRTF) [8].
The initial source signal, i.e. the excitation, will thus influence all further processing steps. It can be derived from the numerical simulation of nonlinear contact, as in [9]. In an effort to obtain the excitation from actual recordings, we propose in this paper an explicit model of the excitation signal that aims at being flexible, compact and efficient for the synthesis of a wide range of con-tact sounds. In most synthesis approaches to continuous excitation sounds, like rolling, the source and the filter are both designed by reference to their spectral properties, as in [2].
However, some modulation properties of those sounds make a frequency-domain approach difficult. By contrast, we will demon-strate that an explicit modeling of the time-domain properties of the excitation signal is more flexible and thus more convenient for handling behaviors like bouncing and rolling.
The remainder of this paper is organized as follows: Section
2describes the use of High Resolution (HR) methods to estimate the modes of the vibrating objects. The estimated body responses are then used to estimate the excitation signal via inverse filtering techniques, as described in Section3. The proposed model of the excitation signal of an impact sound is introduced in Section4. The model considered for the excitation signal of rolling sounds is next introduced in Section5together with an estimation algo-rithm. Some examples demonstrating the use of those models for synthesis purposes are presented and discussed in Section6.
2. HIGH-RESOLUTION MODAL ANALYSIS In any source-filter model, the estimation of the parameters of the filter is critical. These parameters should be estimated with high precision for the purpose of synthesis and also the estimation of the excitation signal. Indeed, the excitation signal is generally un-known and must be estimated from the recorded sound using in-verse filtering techniques.
In a modal context [10], we assume a set of damped sinusoids for representing the signal:
s(n) = K X k=1 Akezkn (1) zk = ↵k+ j!k Ak = gkej k
where gk, k, ↵k, and !kare respectively the gain, the phase, the
damping factor and the frequency of the mode k. The set of modes corresponds to the resonances of the vibrating objects of interest.
In order to estimate those parameters from recorded sounds, a Fourier analysis is generally considered for the frequencies and
0 50 100 150 200 250 300 350 0 0.05 0.1 0.15 0.2 0.25 0.3 0.35 0.4 0.45 0.5 Time (frames) Normalized Frequency
Figure 1: Sinusoidal components estimated from a recording of an impact between a metallic plate and a ceramic hammer. The size of the dots indicates the gain of the components.
the gains. With respect to the decay, a technique called the Energy Decay Relief (EDR) is usually considered [11,12].
In order to overcome the usual issues with the Fourier ap-proach, spectral analysis parametric methods have been used [13] leading to the use of HR methods for audio signals.
Many authors of the previously cited works report problems with complexity and numerical instabilities when performing a HR analysis on percussive signals [14,15], although a model based on exponentially damped sinusoids appears natural in these contexts. Recent work in the field of general audio modeling using HR methods and the ESPRIT algorithm has been reported [16]. For this study, the algorithm has been enhanced by performing several pre-processing steps that better format the signal for the underly-ing model, as well as an iterative computation of the components. An in-depth description of these enhancements is beyond the scope of this paper (see [17] for further details). For the analysis of im-pact sounds, this specific HR method has given reliable and precise results with respect to the estimation of instaneous modal parame-ters.
In our approach, a two-step analysis is considered. The first step estimates an arbitrary high number of modal components in short analysis frames of approximately 1.5 ms, as shown in Figure
1. The second step identifies the prominent components, tracks them over time using frequency proximity criterion [18], and com-putes statistics of their parameters in order to estimate the parame-ters of the filter. Figure2shows the evolution of the amplitude of the mode through time. For a given track, the amplitude is expressed as the evolution of the gains estimated using the HR method (blue line), as a function of the damping values measured by the HR analysis module (red line), or as a function of the me-dian value of those values over the entire duration of the mode (green line). Each track defines a mode in our filter, the param-eters of which are the median values of the paramparam-eters over the duration of the track.
3. ESTIMATION OF THE EXCITATION SIGNAL In most of the source-filter modeling situations, only the output of the filter can be recorded and the source is not accessible. One has
0 5 10 15 20 25 0 0.01 0.02 0.03 0.04 0.05 0.06 Time (frames) Amplitude Measured Median Damping Instantaneous Damping
Figure 2: Amplitude evolutions of a mode.
to estimate the excitation signal (the source) from the recording by performing a deconvolution. Several methods are available to achieve this goal. Some do not use any information regarding the structure of the filter [19]. Those methods usually try to “whiten” the output by removing resonances in the spectral domain by as-suming that the resonant part is only due to the filter. Using the same assumption, others consider a sinusoids+noise model such as the one proposed by [20] where the noisy part is assigned to the excitation.
In our approach, we have access to the structure of the sig-nal defined by Eq.1and the parameters of the resonant structure as estimated using the method previously described. Hence, we propose to achieve this deconvolution process by performing an inverse filtering in the spectral domain as proposed in [11]. More precisely, we consider a set of second-order cosine filters to model the filter part of our model:
H(z) =1 2 K/2X k=1 Ak 1 zkz 1 + A⇤k 1 z⇤ kz 1 (2) The excitation is then computed using inverse filtering in the frequency domain:
E(!) = S(!)/H(!) (3) where S(!) is the Fourier spectrum of the output of the filter s(n). Frequency-domain deconvolution is more reliable because of nu-merical instabilities. This approach gives satisfying results when the modes are not too close to each other on the frequency axis.
Such an assumption is almost never verified in practice when one considers environmental contact sounds. In this case, the val-ley between two closely spaced modes will be so deep that it will become a resonance once the filter is inverted. In order to tackle this issue, Laroche et al.[11] propose a method specifically tai-lored for piano sounds: a joint estimation of the excitation signal from recordings of several chords hit by the same type of hammer at the same velocity. We propose in [21] to tackle this issue by explicitly adjusting the initial phases of each mode of the resonant filter in order to control the shape of the valleys of the frequency response of the filter. This method minimizes the anti-resonance phenomenon in a generic fashion.
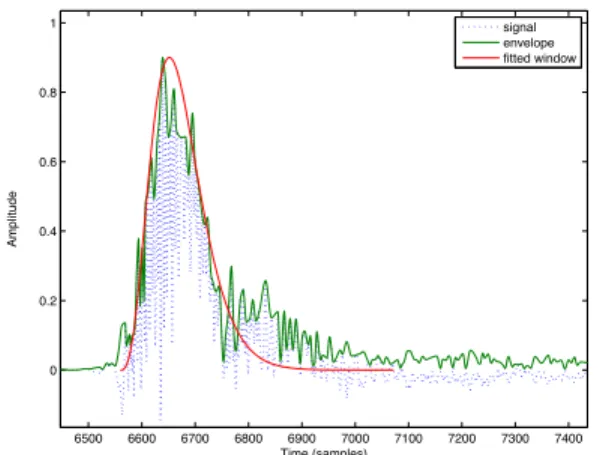
6500 6600 6700 6800 6900 7000 7100 7200 7300 7400 0 0.2 0.4 0.6 0.8 1 Time (samples) Amplitude signal envelope fitted window
Figure 3: Fitting the Meixner window to the estimated excitation signal of the recording of a glass marble hitting a wooden table.
4. MODELING THE EXCITATION SIGNAL OF IMPACT SOUNDS
Using the inverse filtering method described in the previous sec-tion, we can estimate the excitation signal from recorded sounds. We then model each excitation “event” using a “Meixner” tempo-ral envelope that can be adapted to many different impact sound types. This shape has previously been used for the modeling of transients in a low-bitrate hybrid audio coder [22]. We considered this window because it has an overall shape compatible with vari-ous impact-like events and is continuvari-ous at the boundaries.
The “Meixner” envelope is computed as: w(n) = (1 2) /2 r h(n) n! n (4) h(n) = · ( + 1) · · · ( + n 1) (5) h(0) = 1 (6)
with > 0, 0 < < 1 and n = 0, 1, 2, .... The attack is controlled by and the exponential decay is controlled by . In this study, we made use of one particular shape, computed with = 10and = 0.89, delayed, scaled and stretched to fit the envelope of the estimated excitation, as illustrated in Figure3. This envelope gives a compact description of the excitation signal of an impact that will be considered in the next section for modeling the excitation signal of rolling sounds.
5. MODELING THE EXCITATION SIGNAL OF ROLLING SOUNDS
Rolling sounds have very specific time and frequency properties that the human auditory system can perceive when differentiating them from other interactions, such as gliding or sliding sounds.
A strong cue is the macroscopic periodicity that might occur if the ball is relatively large and not perfectly spherical. The surface on which the object rolls is represented in our model by a modal filter. We recognize that the relative gains of the modes of this filter should change with position as the object rolls and that this likely produces an important perceptual effect. However, we do not
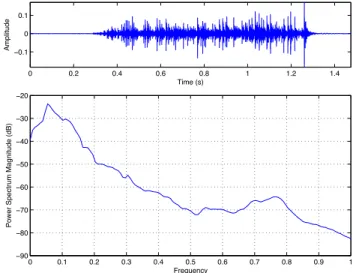
ad-0 0.1 0.2 0.3 0.4 0.5 0.6 0.7 0.8 0.9 1 −90 −80 −70 −60 −50 −40 −30 −20 −10 0 Frequency
Power Spectrum Magnitude (dB)
0 0.1 0.2 0.3 0.4 0.5 0.6 −0.2 −0.1 0 0.1 0.2 Time (s) Amplitude
Figure 4: Time and frequency properties of a constant speed rolling wooden ball over a wooden plate.
dress this phenomenon here, instead focusing on the modeling of the excitation signal.
The most striking property of rolling sounds is the relatively low frequency content, as illustrated in Figure4. The exact shape of the spectrum depends on the physical properties of the interact-ing components but the strong attenuation is a constant in all the recordings we considered.
The time domain evolution exhibits macro modulations of the amplitude that are very important for the perception of rolling, as seen in the upper plot of Figure4. If removed by adaptive ampli-tude normalization, we have observed that the rolling ”property” of the sound is almost absent.
5.1. Existing Approaches
The FoleyAutomatic [2] considers a spectral domain model of the excitation signal. In both approaches, the processing chain starts with white noise. This noise is spectrally shaped so that the slope of its Power Spectral Density exhibits an exponential decay.
In the FoleyAutomatic, van den Doel proposes to cascade an extra filtering step implemented using a biquad filter with a low frequency resonance that can change depending on the speed of the rolling object. An interesting side-effect of this filter is that it creates beating at the resonating frequency, inducing long-term amplitude modulations, desirable for achieving a good quality syn-thesis. However, this approach seems to limit the applicability of the scheme to highly resonant objects.
5.2. Time-Domain Model
We propose to model the excitation signal using a time domain model. We believe that this allows more flexibility and accuracy in reproducing various behaviors like hitting, bouncing, and rolling.
In Section4, a single impact between two objects was synthe-sized by exciting a modal filter with a scaled and time-stretched Meixner envelope. As a model of the rolling excitation, we assume that the ball “strikes” the surface many times, producing a kind of sustained excitation composed of many individual contact events at various times and with various gains. We propose a model for this excitation signal as a sequence of temporal envelopes, each
triggered and scaled in accordance with the ball/surface interac-tion properties.
5.3. Analysis Algorithm
To evaluate the perceptual validity of the proposed model, we an-alyzed a rolling excitation signal to extract the time and amplitude of the continuous contact events (or triggers). The excitation sig-nal was computed by deconvolving a rolling sound with the modal filter determined using HR analysis of a single ball/surface inter-action, as described in previous sections.
Given a signal x and an impact envelope model w of length lw,
we estimate T = tm, am, the set of triggerings. X , the envelope of
x, is first computed as a spline interpolation between the maximal values of |x|. X is then approximated as a linear combination of the impact envelope w. The cross correlation between w and X is iteratively computed. At step m, tm is the lag at which the
cross correlation is maximal and am is computed such that the
area difference between X (tm, tm+ lw)and amwis minimized.
This iterative process ends when the difference between X and the convolution of T and w is below a given threshold (0.001 in this paper given that the value range is [-1, 1]).
6. EXPERIMENTS
We study in this section the advantages of using the proposed model by considering three different synthesis schemes tested on a database of sound recordings.
6.1. Database
Impact and rolling sounds were recorded and analyzed to obtain specific model parameters. We considered three different rolling objects: a half liter bottle made of glass (rolling on its side), a small glass marble, and a croquet ball made of wood. The rolling surface was a medium density fiberboard (MDF) plate of 95 by 25 by 2 centimeters.
Both contact and rolling sounds were recorded, with three dif-ferent plate inclinations. The sounds were recorded in an IAC double-walled sound isolated booth using both external Behringer omnidirectional microphones (ECM 8000), a PCB impact hammer (model 086C01), and a PCB accelerometer (model 352C22) fixed to the plate.
6.2. Analysis/Synthesis Schemes
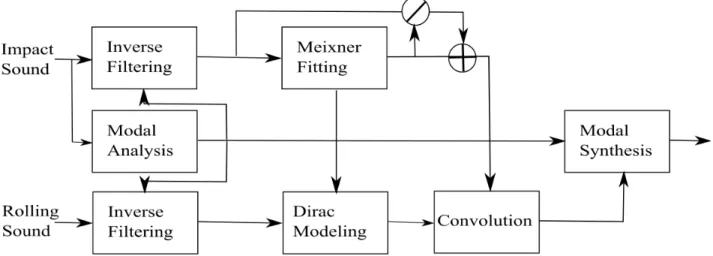
The complete algorithm we have built is composed of 4 main steps: The first step involves the estimation of the modal parameters from the impact sound using the method described in Sec.2. The excitation signal of the impact sound is estimated by inverse filter-ing as described in Sec.3. The same procedure is carried out to estimate the excitation signal of the rolling sound, as diagrammed in Figure6.
The second step is to model the excitation signal of the impact, as described in Sec.4. In order to evaluate the relevance of the Meixner window fitting, we considered three different schemes. In the first, the estimated excitation signal (the “residual”) was used alone. In the second scheme, only the Meixner window was con-sidered. In the last scheme, a combination of the two was consid-ered: ✏(n) = w(n) „ 1 + e(n) (1 ) + w(n) « (7) 0 0.1 0.2 0.3 0.4 0.5 0.6 0.7 0.8 0.9 1 −90 −80 −70 −60 −50 −40 −30 −20 Frequency
Power Spectrum Magnitude (dB)
0 0.2 0.4 0.6 0.8 1 1.2 1.4 −0.1 0 0.1 Time (s) Amplitude
Figure 5: Rolling sound of a marble rolling over a highly inclined MDF plate.
where e(n) is the estimated excitation signal of the impact and w(n)is the Meixner window. The three different schemes can be obtained by respectively setting = = 1, = 0, or = 1 and
= 0.5.
The third step involves the estimation of the Dirac set T as a function of the excitation signal of the rolling sound by the algo-rithm introduced in Sec.5. The final step is the synthesis where the Dirac set is convolved with ✏(n) and the resulting excitation is filtered using the modal model.
By comparing the original recording in Fig.5with the syn-thesized results in Fig.7, we observe that the long term time-domain properties of the synthesized results are globally coherent with the original sound. In the frequency domain, however, the rolling sound synthesized using the residual excitation signal has too much high frequency content, as well as stronger resonances. The Meixner window approach, on the other hand, produces less high frequency content, as it would be expected. The combina-tion scheme nicely balances the two previous schemes and leads to the better synthesis quality as determined from informal per-ceptive evaluations1.
7. ACKNOWLEDGMENTS
This work was supported by a Special Research Opportunity grant from the Natural Sciences and Engineering Research Council of Canada.
8. CONCLUSION
We proposed in this paper a time-domain approach for the mod-eling of the excitation of contact sounds. The analysis/synthesis scheme shows promising results. We would like to extend this work by adressing some key aspects of the algorithm such as the use of more diverse fitting windows that would allow us to better model the spectral properties of the impacts. As well, we plan to develop a parametric modeling scheme that allows for the synthe-sis of many different qualities of rolling sounds.
Figure 6: Block diagram of the Analysis/Synthesis algorithm. 9. REFERENCES
[1] Perry R. Cook, “Physically informed sonic modeling (phism): Synthesis of percussive sounds,” Computer Music Journal, vol. 21, no. 3, pp. 38–49, 1997.
[2] K. van den Doel, P. G. Kry, and D. K. Pai, “Foleyautomatic: physically-based sound effects for interactive simulation and animation,” Proceedings of the 28th annual conference on Computer graphics and interactive techniques, pp. 537–544, 2001.
[3] R. Guski and N. F. Troje, “Audiovisual phenomenal causal-ity,” Perception & Psychophysics, vol. 65, no. 5, pp. 789– 800, 2003.
[4] F. Avanzini, D. Rocchesso, and S. Serafin, “Friction sounds for sensory substitution,” 2004, Proceedings of the Interna-tional Conference on Auditory Display (ICAD).
[5] K. van den Doel, D. K. Pai, T. Adam, L. Kortchmar, and K. Pichora-Fuller, “Measurements of perceptual quality of contact sound models,” Proceedings of the International Conference on Auditory Display (ICAD), Kyoto, Japan, pp. 345–349, 2002.
[6] B. Gygi, G. R. Kidd, and C. S. Walson, “Spectral-temporal factors in the identification of environmental sounds,” J. Acoust.Soc.Am., vol. 115, no. 3, pp. 1252–1265, 2004. [7] N. Tsingos, E. Gallo, and G. Drettakis, “Perceptual audio
rendering of complex virtual environments,” in ACM SIG-GRAPH 2004 Papers, Los Angeles, California, 2004, pp. 249–258, ACM.
[8] J. Blauert, Spatial Hearing, the Psychophysics of Human Sound Localization, MIT Press, 1983.
[9] D. Rocchesso, R. Bresin, and M. Fernstr om, “The sounding object,” IEEE Multimedia, pp. 42–52, April 2003.
[10] N.H. Fletcher and T.D. Rossing, The Physics of Musical In-struments, New York: Springer-Verlag, 1991.
[11] J. Laroche and J. L. Meillier, “Multichannel excitation/filter modeling of percussive sounds with application to the piano,” IEEE Transactions on Speech and Audio Processing, vol. 2, pp. 329–344, 1994.
[12] N. Lee, R. Cassidy, and J. O. Smith III, “Use of energy de-cay relief (edr) to estimate partial-overtone dede-cay-times in a freely vibrating string,” Joint ASA-ASJ Meeting, 2006. [13] Steven M. Kay, Modern Spectral Estimation, chapter
Au-toregressive Spectral Estimation : Methods, pp. 228–231, Signal Processing Series. Prentice Hall, 1988.
[14] J.L. Meillier, Analysis/Synthesis of Percussive Signals within a Source/Filter Model, Ph.D. thesis, Universite du Mans, 1991, in French.
[15] L.-M. Reissell and Dinesh K. Pai, “High-resolution analy-sis and resyntheanaly-sis of environmental impact sounds,” Pro-ceedings of the International Conference on Auditory Dis-play (ICAD), 2006.
[16] R. Badeau, G. Richard, and B. David, “Performance of esprit for estimating mixtures of complex exponentials modulated by polynomials,” Signal Processing, IEEE Transactions on [see also Acoustics, Speech, and Signal Processing, IEEE Transactions on], vol. 56, pp. 492–504, 2008.
[17] R. Badeau, G. Richard, and B. David, “Fast adaptive esprit algorithm,” IEEE Workshop on Statistical Signal Processing SSP’05, 2005.
[18] R. J. McAulay and T. Quatieri, “Speech analysis/synthesis based on a sinusoidal representation,” IEEE Transactions on Acoustics, Speech, and Signal Processing, vol. 34, no. 4, pp. 744–754, Aug 1986.
[19] N. Lee, Z. Duan, and J. O. Smith III, “Excitation signal extraction for guitar tones,” International Computer Music Conference, 2007.
[20] X. Serra, Musical Signal Processing, chapter Musical Sound Modeling with Sinusoids plus Noise, pp. 91–122, Studies on New Music Research. Swets & Zeitlinger, Lisse, the Nether-lands, 1997.
[21] M. Lagrange, N. Whetsell, and P. Depalle, “On the control of the phase of resonant filters with applications to the mod-elling of percussive sounds,” Submitted to the Digital Audio Effects Conference, 2008.
[22] B. D. Brinker, E. Schuijers, and W. Oomen, “Parametric Coding for High-Quality Audio,” in 112th Convention of the Audio Engineering Society, May 2002.
(a) 0 0.1 0.2 0.3 0.4 0.5 0.6 0.7 0.8 0.9 1 −55 −50 −45 −40 −35 −30 −25 −20 −15 −10 Frequency
Power Spectrum Magnitude (dB)
0 0.5 1 1.5 −0.5 0 0.5 Time (s) Amplitude (b) 0 0.1 0.2 0.3 0.4 0.5 0.6 0.7 0.8 0.9 1 −90 −80 −70 −60 −50 −40 −30 −20 −10 0 Frequency
Power Spectrum Magnitude (dB)
0 0.2 0.4 0.6 0.8 1 1.2 1.4 −0.5 0 0.5 Time (s) Amplitude (c) 0 0.1 0.2 0.3 0.4 0.5 0.6 0.7 0.8 0.9 1 −80 −70 −60 −50 −40 −30 −20 −10 0 Frequency
Power Spectrum Magnitude (dB)
0 0.2 0.4 0.6 0.8 1 1.2 1.4 −0.5 0 0.5 Time (s) Amplitude
Figure 7: Synthesized sounds of a marble rolling over a highly inclined MDF plate using the three proposed schemes: impact ex-citation signal (a), Meixner window (b), and a combination (c).
(a) 0 1 2 3 4 5 6 −0.5 0 0.5 Time (s) Amplitude 0 0.1 0.2 0.3 0.4 0.5 0.6 0.7 0.8 0.9 1 −70 −60 −50 −40 −30 −20 −10 Frequency
Power Spectrum Magnitude (dB)
(b) 0 1 2 3 4 5 −0.5 0 0.5 Time (s) Amplitude 0 0.1 0.2 0.3 0.4 0.5 0.6 0.7 0.8 0.9 1 −90 −80 −70 −60 −50 −40 −30 −20 −10 0 Frequency
Power Spectrum Magnitude (dB)
(c) 0 1 2 3 4 5 −0.5 0 0.5 Time (s) Amplitude 0 0.1 0.2 0.3 0.4 0.5 0.6 0.7 0.8 0.9 1 −70 −60 −50 −40 −30 −20 −10 0 Frequency
Power Spectrum Magnitude (dB)
Figure 8: Synthesized sounds of a wood ball rolling over a lightly inclined MDF plate using the three proposed schemes: impact ex-citation signal (a), Meixner window (b), and a combination (c).