HAL Id: hal-01319841
https://hal.archives-ouvertes.fr/hal-01319841
Submitted on 23 May 2016
HAL is a multi-disciplinary open access
archive for the deposit and dissemination of
sci-entific research documents, whether they are
pub-lished or not. The documents may come from
teaching and research institutions in France or
abroad, or from public or private research centers.
L’archive ouverte pluridisciplinaire HAL, est
destinée au dépôt et à la diffusion de documents
scientifiques de niveau recherche, publiés ou non,
émanant des établissements d’enseignement et de
recherche français ou étrangers, des laboratoires
publics ou privés.
Optical resonators metrology using an RF-spectrum
approach
Zeina Abdallah, Yann Boucher, Arnaud Fernandez, Stéphane Balac, Olivier
Llopis
To cite this version:
Zeina Abdallah, Yann Boucher, Arnaud Fernandez, Stéphane Balac, Olivier Llopis. Optical resonators
metrology using an RF-spectrum approach. SPIE Photonics West - OPTO 2016, Feb 2016, San
Francisco, CA, United States. pp.97470E, �10.1117/12.2210786�. �hal-01319841�
1
Optical resonators metrology using an RF-spectrum approach
Zeina Abdallah
1,2, Yann G. Boucher
3,4, Arnaud Fernandez
1, Stéphane Balac
5, Olivier Llopis
1 1LAAS, CNRS, Univ. de Toulouse, 7 Avenue du Colonel Roche, 31031 Toulouse, France
2
CNES, 18 avenue Edouard Belin, 31410 Toulouse Cedex 4, France
3FOTON, ENSSAT, CS 80518, 22305 Lannion, France
4
ENIB, CS 73862, 29238 Brest Cedex 3, France
5
IRMAR, Univ. de Rennes, Campus de Beaulieu, CS 74205, 35042 Rennes, France
ABSTRACT
A Microwave domain characterization technique is proposed to measure the optical properties of high quality factor optical resonators, featuring a very high precision in frequency which can be as good as 1 Hz. It aims to acquire a full knowledge of the complex transfer function (amplitude and phase) characterizing these resonators. It is shown that the amplitude response gives access to the measure of several parameters like the free spectral range and the quality factor. Moreover the phase transition at the resonance is used to define the coupling regime and to calculate the resonator parameters: transmission coefficient and intra-cavity losses.
Keywords: Optical resonator, metrology, Q factor, fiber optics, microwave optics
1. INTRODUCTION
The ultra low losses observed in some materials at optical frequencies makes the optical domain an extremely interesting field for ultra-high quality factor resonator design. These devices are key components for numerous applications, such as ultra-high spectral purity frequency generation, both in optical [1] or microwave domains [2,3], high resolution optical spectroscopy and optical combs [4], biological and chemical sensors [5]. They may be used also to characterize the optical properties of a given material, and particularly of low losses materials. In any of these cases, a precise characterization of the resonator is mandatory before system design. With quality factors (Q) in excess of 107 approximately, such a
characterization is particularly difficult. However, there is today a strong interest in ultra-high Q factors, which are available in various technologies such as: Whispering Gallery Modes (WGM) resonators, including silica spheres [6] or polished monocrystalline disks [7], active or passive fiber ring resonators [8], Ultra Low Expansion (ULE) Fabry-Perot type resonators [9].
The more classical approach to characterize this type of resonators is the optical frequency scan technique, which is performed using a tunable laser. The laser must feature a narrow enough linewidth to go through the resonance, which is not always obvious with high Q factors. A resonator with a Q factor of 2109 at 1550 nm features a 3 dB bandwidth in
the range of 100 kHz, and cannot be scanned with, as an example, a semiconductor laser. A more difficult problem is related to the resonator self-heating: when the optical signal is tuned at a resonance frequency, the intra-cavity power rapidly increases and the resonator is heated by this optical power. This change in temperature modifies the resonant frequency, and thus the resonance is lost again. The result is a strong dissymmetry between a scan performed with an increasing frequency and another one with a decreasing frequency. Under these conditions, the Q factor is overestimated on one side, and underestimated on the other side [10]. Therefore, to characterize ultra-high Q resonators, dedicated techniques have to be set up. The most widely used today is the cavity ring down technique [11,12], which is a time domain approach. It characterizes the decrease of the optical power in the resonator when the device has been submitted to an optical pulse. It is well fitted to ultra-high Q factors because the higher the Q factor, the longer the decreasing time will be and the easier the measurement will be. However, this technique requires the fitting of the results with an appropriate model to extract the resonator parameters, which are not immediately available on the raw data.
2 Contrarily to the last technique, the characterization approach described in this paper gives directly the resonator response in the frequency domain. It is indeed based on a technique which transfers the optical resonances down to the radio frequency spectrum, and thus allows their measurement with electrical techniques, and more precisely using a microwave Vector Network Analyser (VNA). Both the amplitude and phase of the optical resonance can be measured, with a precision in frequency which is much better than any other technique available in the optical domain. The only requirement is that the resonator must provide a comb of identical resonances featuring a Free Spectral Range (FSR) in a frequency range reachable with electronic techniques, i.e. lower than 50 GHz (approximately). This means that this technique may not be suitable for small size integrated resonators, but it is well fitted to the measurement of relatively large resonators, such as fiber rings or WGM disk resonators featuring a diameter in excess of, at least, one millimeter.
The paper is organized as follows: the measurement set-up is first described, including the key elements which determine the measurement accuracy. Then, some measurement examples performed on an active fiber ring resonator are presented and discussed.
2. MEASUREMENT TECHNIQUE
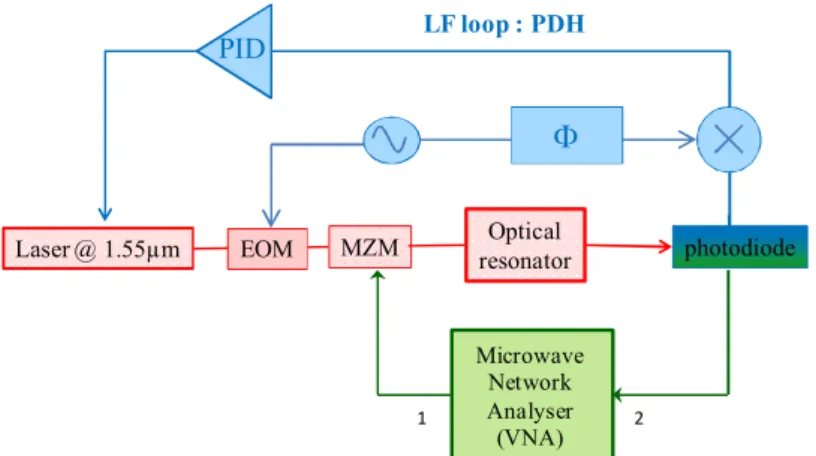
2.1 Measurement set-upThe measurement set-up has been described in a previous paper [13], in which the ability of this technique to measure with high precision the amplitude response of a resonator has already been pointed out. As depicted in Figure 1, a high spectral purity laser is firstly locked to one of the resonator resonances using a Pound Drever Hall system. Thanks to this lock process, the laser and the resonator are maintained at the same frequency during the analysis. The laser is a Koheras fiber laser, which is locked using its piezoelectric frequency control input.
Figure 1 : Measurement set-up, with the laser locking system above (blue) and the frequency response measurement system below (green). The laser has to be locked to one resonance before any measurement can be performed.
Once the laser is locked onto one mode of the resonator, the resonator side-modes are explored with a radio-frequency (RF) modulation which generates two lateral sidebands on the laser signal. This modulation is realized thanks to a Mach-Zehnder (MZ) modulator, which allows an analysis from a few MHz up to 30 GHz approximately (but a 50 GHz bandwidth can be reached with some commercial devices). This device is the main device limiting the analysis frequency, and thus the FSR of the resonator under test. The VNA delivers the modulation signal to the MZ modulator, and analyses the output signal from the photodiode, both in amplitude and phase.
With this technique, the resonator may be measured in absorption mode (one coupler) or in transmission mode (two couplers). Eventually, the output used for the locking process may be different from the test port (ex: the resonator can be measured in transmission, and locked on the absorption port). Also, a fiber polarization controller can be added to the experiment just before the resonator, in order to facilitate the coupling of a given resonator mode.
Laser @ 1.55µm EOM MZM resonatorOptical photodiode
PID LF loop : PDH Microwave Network Analyser (VNA) 1 23 Because the MZ modulator realizes a dual sideband amplitude modulation, the frequency responses of two resonator modes are measured simultaneously. If the laser is not perfectly centered on one mode, the dissymmetry between these two responses induces two resonant peaks and a change in the phase slope at the center of the resonator bandwidth. Fortunately, the PDH lock system allows the control of this parameter by adding an offset to the control signal. Another solution can be the use of a single sideband MZ modulator, which will allow the measurement of only one mode at the same time. This may be probably mandatory in case of the measurement of resonance combs featuring a very strong frequency dispersion, although we have not met this type of problem in practice with the resonators we have measured so far (fiber ring resonators and WGM disk resonators).
Once locked, the measurement precision is extremely high. It is the frequency precision of the VNA, which is based on its internal frequency synthesizer and allows a minimum frequency step of 1 Hz (0.1 Hz precision is available on some of these equipments). Therefore, the limit of this type of measurement is not in the frequency resolution but rather in the ability to properly lock the laser at the center of one of the resonances. The optical resonance is transferred directly to the RF domain thanks to the photodiode mixing effect, and both the amplitude and phase response are down converted to RF without any change in their shape (except in case of the above described symmetry problems). Prior to the measurement, a VNA calibration is performed, in order to extract from the measurement the effect of the various delay provided by the access fibers and RF cables. To this purpose, the resonator is shortened and the MZ modulator is directly connected to the photodiode. The resonator pigtails may not be included in such a calibration process. In this case, the delay induced by these pigtails is computed (from the fiber length) and negatively added to the VNA using the “delay” function.
2.2 Resonators under test
The resonators under test presented in this paper are fiber ring resonators (although the technique is also suitable to characterize WGM resonators) including one or two couplers. These resonators feature either ultra-high Q factor or the possibility to tune their parameters, which makes them ideal devices to test such a measurement technique.
The first resonator is an all-PM fiber ring of relatively large length: 100 m. This resonator uses two ultra-low excess losses PM fiber couplers (excess losses specified to less than 0.1 dB) and low losses splices to connect the fiber spool to the couplers. Such a configuration allows one to reach optical Q factors in the range of 1010, and thus 3 dB bandwidth of about
20 kHz. It is an excellent test of the system for narrow bandwidth devices.
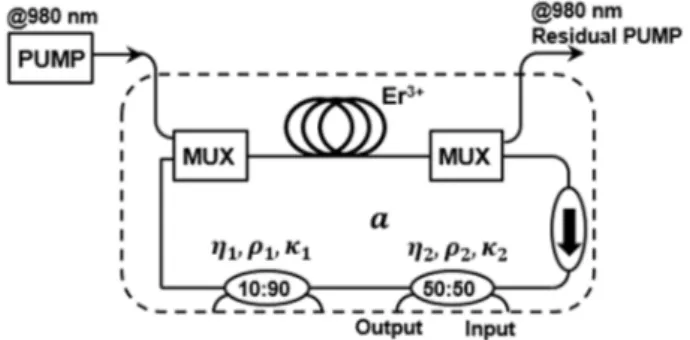
The second resonator is depicted in Figure 2. It is again a fiber ring resonator, but in this case an Erbium-doped fiber is included in the loop (an optical amplifier). This allows an active control of the intra cavity losses, and different coupling regimes can be obtained with this resonator depending on the pump power. The resonator is measured in this case on its absorption port (through port) while varying this pump power. Small pump power results in under-coupling regime. Higher pump power will go to over-coupling, crossing the critical coupling at a given power. Then, a further pump power increase leads to the selective amplification regime. This resonator is thus the perfect device to test the ability of the measurement system and of the modeling approach to identify these working regimes, and to extract the intrinsic and extrinsic Q factors (not described in this paper).
4
3. RESONATORS CHARACTERIZATION
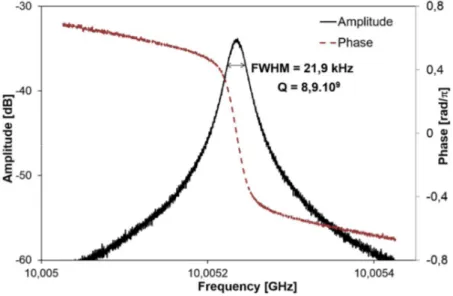
3.1 Ultra-high Q resonatorThe measurement result for the 100 m PM fiber ring resonator in transmission mode (drop port) is depicted in Figure 3. The Q factor extracted from the amplitude plot is 8.9109. This value is in good agreement with the Q factor extracted
from the phase slope (in red on the Figure). Indeed, as it is shown in the figure, the phase is precisely measured by the VNA, and the calibration allows one to extract the resonator response from the access lines response. Actually, to measure this type of resonator with this technique, the only tricky step is the laser lock, although in this case nothing has been done to thermally stabilize the resonator (it is simply embedded in a metallic box). Very often, nonlinear effects may start in these ultra-high Q resonators [2], because of the intra-cavity enhancement factor. In this case, the resonator input power is maintained low enough to prevent these effects (in the range of 10 dBm).
Figure 3 : Measurement of an all-PM fiber ring resonator (100 m length)
3.2 Tunable resonator
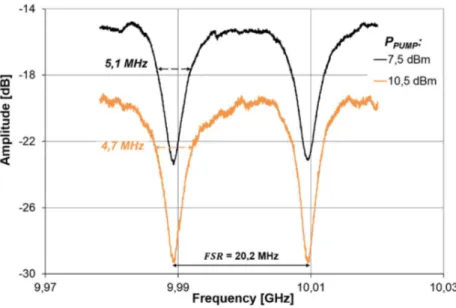
The tunable resonator is a 10 m length loop with 20 MHz FSR and a few MHz bandwidth (Q in the 107 to 108 range), as
shown in Figure 4 for a relatively small pump power levels. This resonator is measured in this case on the absorption port (through port), which is the most common case when one wants to test a WGM resonator for which the precise control of the coupling on only one port is already a difficult challenge.
On such amplitude plot, it is impossible to discriminate between the under-coupling and over-coupling regimes, which are both separated by the critical coupling, for which all the energy is absorbed in the resonator (zero transmission at resonance). It can be shown, however, that the phase slope at the resonance can discriminate between these two regimes [14], thus allowing a direct determination of the resonator parameters, simpler than other techniques based on time domain analysis [12]. In case of a positive phase slope on the absorption port, the resonator is under-coupled, and if the phase slope is negative, the resonator is over-coupled. Figure 5 depicts a measurement performed on the absorption port in the under-coupling regime, with both amplitude and phase curves.
5
Figure 4 : Amplitude frequency response measurement of the tunable resonator at relatively low pump power
Figure 5 : Amplitude and phase response of the tunable resonator at Ppump = 9.5 dBm (under-coupling regime)
3.3 Resonator model parameters extraction
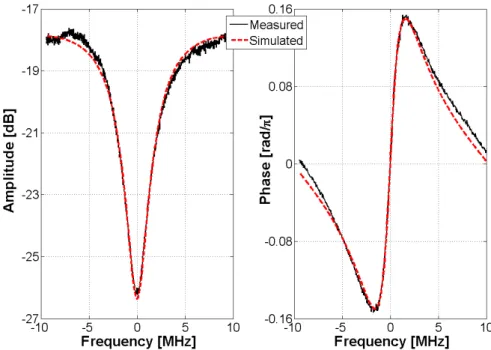
Such resonators can be described by A. Yariv’s model [15,16], which describes the resonator transfer function around the resonance frequency and only involves two parameters: the coupler transmission coefficient and the roundtrip attenuation (or amplification) coefficient in amplitude . From the measurement data obtained with the RF spectrum approach, Yariv’s resonator representation can be obtained using a least square fitting of both the amplitude and phase frequency responses. Such a fitting process is depicted in Figure 6 for the tunable resonator in the under-coupling regime and in Figure 7 for the same resonator in the selective amplification regime. In both cases, Yariv’s model provides a good representation of the resonator frequency response, both in amplitude and phase.
6
Figure 6: Measured and modelled resonator frequency response for Ppump = 9.5 dBm The model parameters are the following: = 0.56 and = 0.75.
Figure 7: Measured and modelled resonator frequency response for Ppump = 18 dBm The model parameters are the following: = 1.14 and = 0.69.
7
4. CONCLUSION
A technique for the measurement of both the amplitude and phase frequency responses of optical resonators, based on a transposition of this response down to the RF spectrum, has been reported. This technique features an ultra-high precision in frequency, and is thus well adapted to the characterization of ultra-high Q factor resonators. The knowledge of both amplitude and phase responses allows the fitting of these data with resonator models, and thus a complete extraction of the resonator parameters is possible whatever the coupling regime.
5. ACKNOWLEDGEMENTS
This study has been partially funded by the CNES, the French National Space Center, the Regional Council of Midi-Pyrénées in the frame of OPTOMILLIREF Project and the French MoD in the frame of HIPPOMOS project.
REFERENCES
[1] Ilchenko, V. S., Dale, E., Liang, W., Byrd, J., Eliyahu, D., Savchenkov, A. A., Matsko, A. B., Seidel, D., and Maleki, L., “Compact tunable kHz-linewidth semiconductor laser stabilized with a whispering-gallery mode microresonator”, Proc. of SPIE, Vol. 7913, 79131G, 2011.
[2] Saleh, K., Llopis, O., Cibiel, G., “Optical Scattering Induced Noise in Fiber Ring Resonators and Optoelectronic Oscillators”, Journal of Lightwave Technology, vol. 31, no. 9, pp. 1433,1446, May 1, 2013.
[3] Maleki, L., Ilchenko, V.S., Savchenkov, A. A., Liang, A. A., Seidel, D., Matsko, A.B., “High performance, miniature hyper-parametric microwave photonic oscillator”, Proc. of the IEEE Int. Freq. Control Symp. (IFCS 2010), June 2010. [4] Kippenberg, T. J., Holzwarth, R. & Diddams, S. A. “Microresonator-based optical frequency combs”, Science 332,
555-559 (2011).
[5] Armani, A. M., “Single Molecule Detection Using Optical Microcavities”, Springer 2010.
[6] Righini, G. C., Dumeige, Y., Féron, P., Ferrari, M., Nunzi Conti, G., Ristic, D., Soria, S., “Whispering gallery mode microresonators: Fundamentals and applications”, Rivista Del Nuovo Cimento, Vol. 34, N. 7, 2011.
[7] Savchenkov, A., Ilchenko, V., Matsko, A., Maleki, L., “Kilohertz optical resonances in dielectric crystal cavities”, Physical Review A, 70, 051804(R), Nov. 2004.
[8] P.H. Merrer, O. Llopis, G. Cibiel, “Laser Stabilization on a Fiber Ring Resonator and Application to RF Filtering”, IEEE-Photonics Technology Letters, vol 20, n° 16, july 2008, pp. 1399-1401.
[9] Kessler, T., Hagemann, C., Grebing, C., Legero, T., Sterr, U., Riehle, F., “A sub-40 mHz linewidth laser based on a silicon single-crystal optical cavity”, Nature Photonics 6, 687–692 (2012)
[10] Merrer, P.H., Llopis, O., Bonnefont, S., Ghisa, L., Dumeige, Y., Féron, P., Cibiel, G., “Microwave Filtering Using High Q Optical Resonators”, Proc. of the 2008 European Microwave Conf., pp. 381-384.
[11] Hahn, J. W., Yoo, Y. S., Kim, J. W., Lee, H. W. “Cavity ringdown spectroscopy with a continuous-wave laser: calculation of coupling efficiency and a new spectrometer design”, Appl. Opt. 38, 1859-1886 (1999).
[12] Dumeige, Y., Trebaol, S., Ghisa, L., Ngan Nguyen, T. K., Tavernier, H., Féron, P., “Determination of coupling regime of high-Q resonators and optical gain of highly selective amplifiers”, J. Opt. Soc. Am. B 25, 2073-2080 (2008). [13] Merrer,P.H., Saleh, K., Llopis, O. , Berneschi, S., Cosi, F., Nunzi Conti, G., “Characterization technique of optical
whispering gallery mode resonators in the microwave frequency domain for optoelectronic oscillators”, Appl. Opt. 51, 4742-4748 (2012).
[14] Abdallah, Z., et al., to be published
[15] Yariv, A., “Universal relations for coupling of optical power between micro-resonators and dielectric waveguides”, Electronics Letters 36, 321-322 (2000).
[16] Yariv, A., “Critical coupling and its control in optical waveguide-ring resonator systems”, IEEE Photon. Technol. Lett. 14, 483-485 (2002).