UNIVERSITÉ DE GENÈVE Section de pharmacie
Laboratoire de pharmacie galénique
FACULTÉ DES SCIENCES Professeur Richard Guy Docteur Begoña Delgado-Charro
Évaluation de l’ionophorèse inversée
comme méthode non-invasive pour le
monitoring thérapeutique
THÈSE
présentée à la Faculté des sciences de l’Université de Genève pour obtenir le grade de Docteur ès sciences, mention sciences pharmaceutiques
par Benoît LEBOULANGER de Paris (France) Thèse N°3504 GENÈVE
Atelier de reproduction de la Section de physique 2004
Remerciements
Je tiens à adresser mes sincères remerciements à toutes les personnes qui ont participé de près ou de loin à la réalisation de cette thèse.
Tout particulièrement, le Docteur Begoña Delgado-Charro, pour avoir initié et dirigé ce projet, pour son soutien, ses conseils et sa disponibilité tout au long de ces trois années ; Et le Professeur Richard Guy pour m’avoir accueilli dans son équipe et avoir supervisé mon travail. Que tous deux trouvent ici l’expression de mes profonds remerciements pour la confiance qu’ils m’ont accordée.
Je remercie vivement le Professeur Véronique Préat, le Professeur Luc Balant et le Docteur Peretz Glikfeld pour avoir accepté d’être membres du jury de cette thèse.
Je remercie chaleureusement toutes les personnes de l’hôpital Cantonal Universitaire de Genève qui ont collaboré activement à la réussite de ce projet : J-M. Aubry, P. Bourgeois, M. Fathi, I. Garland, C. Gonzales, H. Ing et J. Mange.
Je remercie tous mes collègues de Pharmapeptides dont la bonne humeur contribue à offrir, dans ce laboratoire, un environnement de travail unique. Je remercie également tous les membres du laboratoire de pharmacie galénique pour les nombreux moments agréables passés ensemble.
Je souhaite remercier le Fond National de la Recherche Suisse pour le soutien financier ayant permis la réalisation de ce projet.
Sans oublier mes parents, ma famille et mes amis pour leur affection, leurs encouragements et leur soutien de toujours, je souhaite, pour finir remercier tout particulièrement Céline et Thomas pour leur patience et tout le bonheur de notre quotidien.
Table des matières
Avant propos
………...7
Structure de la thèse
………...13
Chapitre 1
………15
L’ionophorèse inversée pour le monitoring transdermique non-invasif.Chapitre 2
………33
Le monitoring non-invasif de la phénytoïne par ionophorèse inversée.Chapitre 3
………45
L’ionophorèse inversée comme outil non-invasif pour le monitoring du lithium et les études pharmacocinétiques.Chapitre 4
………63
Le monitoring non-invasif du lithium par ionophorèse inversée. Une étude in vivo.Chapitre 5
………79
L’ionophorèse inversée du lithium : utilisation d’un gel polymérique thermoréversible pour la formulation des compartiments récepteurs.Conclusions et perspectives
………87
Avant propos
Certains médicaments (tableau 1) présentent des différences individuelles considérables en terme d’efficacité et de toxicité. Ceci complique considérablement la définition d’une relation dose/effet (1). Le monitoring thérapeutique
consiste à surveiller les effets d’un traitement dans le but de réduire les variabilités de la réponse thérapeutique (1-5). Cette variabilité dépendant à la fois des propriétés du principe actif (pharmacocinétique et pharmacodynamie) et de l’état clinique du patient (insuffisance hépatique, rénale, …) (6).
Dans le cas de médicaments présentant une marge thérapeutique étroite, ces disparités individuelles font qu’une posologie idéale chez certains patients peut être toxique ou inefficace chez d’autres (6,7). Dans ce cas précis le monitoring thérapeutique constitue un outil essentiel à la disposition du praticien pour individualiser le traitement. Lorsque les effets d’un traitement (thérapeutiques ou toxiques) ne sont pas aisément visibles ou quantifiables par le patient ou le praticien (6) (par exemple : traitements prophylactiques antiépileptiques, antiarythmiques, stabilisateurs de l’humeur, etc…), le monitoring permet de confirmer un bénéfice thérapeutique et d’éviter des effets secondaires (7). Le monitoring thérapeutique permet aussi de contrôler la compliance du
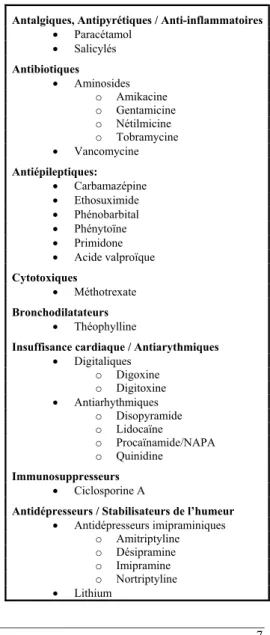
Tableau 1: Principes actifs couramment monitorisés. Antalgiques, Antipyrétiques / Anti-inflammatoires
• Paracétamol • Salicylés Antibiotiques • Aminosides o Amikacine o Gentamicine o Nétilmicine o Tobramycine • Vancomycine Antiépileptiques: • Carbamazépine • Ethosuximide • Phénobarbital • Phénytoïne • Primidone • Acide valproïque Cytotoxiques • Méthotrexate Bronchodilatateurs • Théophylline
Insuffisance cardiaque / Antiarythmiques • Digitaliques o Digoxine o Digitoxine • Antiarhythmiques o Disopyramide o Lidocaïne o Procaïnamide/NAPA o Quinidine Immunosuppresseurs • Ciclosporine A
Antidépresseurs / Stabilisateurs de l’humeur • Antidépresseurs imipraminiques o Amitriptyline o Désipramine o Imipramine o Nortriptyline • Lithium
patient au traitement, d’établir la cause d’échecs thérapeutiques ou de surveiller la modification d’un traitement (interférence médicamenteuse, médicament ayant une pharmacocinétique non linéaire, etc…) (6-8).
Dès lors que les concentrations systémiques du médicament sont en relation étroite avec les effets thérapeutiques et secondaires, ce contrôle est classiquement réalisé par prise de sang. La fréquence du monitoring dépend beaucoup de la situation clinique du patient (6). Un monitoring régulier est requis lors de l’établissement ou de la modification du traitement. Un contrôle périodique moins fréquent est généralement prescrit pour les patients traités sur le long terme. Néanmoins, un contrôle immédiat peut-être décidé en cas d’échecs thérapeutiques, d’effets secondaires, de modifications physiologiques (par exemple : maladie, grossesse) risquant de perturber la pharmacocinétique du médicament ou encore lorsqu’une non-compliance est suspectée.
Des méthodes moins invasives que la prise de sang offrent des bénéfices évidents : moins douloureuses du point de vue du patient, elles contribuent davantage au confort du patient lorsqu’un usage ambulatoire est possible. D’un point de vue médical, elles facilitent le contrôle chez les patients, diminuent les risques de complication (hématomes, infections,…) et rendent possible un monitoring plus fréquent permettant un meilleur suivi thérapeutique. Ces techniques non-invasives sont particulièrement utiles chez certaines populations (pédiatriques, gériatriques, soins intensifs, etc…) dont les facteurs physiologiques ou pathologiques perturbent la pharmacocinétique des médicaments et nécessiteraient par conséquent un monitoring plus fréquent (1,9-13). Pourtant, cet objectif reste trop souvent inaccessible par prise de sang pour diverses raisons : fréquence, volume de prélèvement, etc…(14). De plus le monitoring est souvent indispensable chez ces populations exprimant difficilement les effets bénéfiques ou secondaires d’un traitement. D’autant que l’information pharmacocinétique disponible reste limitée obligeant souvent le praticien à extrapoler les valeurs connues (15). Disposer d’outils non-invasifs favoriserait alors la réalisation d’études pharmacocinétiques dans ces populations sensibles (16-18).
Différentes stratégies non-invasives ont été proposées. Certaines techniques limitent le nombre de prélèvement par l’usage d’outils statistiques maximisant les informations obtenues d’un nombre limité de prélèvements (6,19). D’autres totalement non-invasives s’intéressent aux fluides et matrices biologiques alternatives (10,20,21). Dans le cas de l’urine, les cheveux et la sueur, ces applications se limitent à la détection de composés en toxicologie ou médecine légale (22-25). La salive fut sans doute l'alternative la plus étudiée à des fins quantitatives pour le monitoring thérapeutique (26-30). Cependant, au regard d’une grande variabilité inter-individuelle des fractions extraites et d’une forte sensibilité à de nombreux facteurs (pH, débit de sécrétion salivaire, etc …) son utilisation reste limitée (10,30).
La peau représente une alternative séduisante par sa surface importante et son accès facile, mais son excellente fonction barrière limite considérablement le transport des molécules polaires et chargées. Des études menées in-vitro et in-vivo, ont pourtant mis en évidence la diffusion transdermique de certains principes actifs (31-33). La lenteur du processus d’extraction (indistinctement diffusion passive et sudation) exige de concentrer le médicament dans un patch pendant plus de 10 h. Les résultats ont montré une grande variabilité de la diffusion passive transdermique, ce qui limite considérablement son utilisation pour un usage en monitoring thérapeutique (34,35). Diverses approches ont été proposées dans le but d’augmenter les quantités extraites (36). Ces méthodes perturbent la fonction barrière de la peau de manière plus ou moins transitoires et réversibles par un effet mécanique (sonophorèse, microaiguilles), électrique (ionophorèse, électroporation) ou chimique (36-41).
Ce projet à pour objectif d’évaluer les capacités de l’ionophorèse pour le monitoring non-invasif des médicaments au travers de la peau. Un faible courant électrique (< 0,5 mA/cm2) appliqué à la surface de la peau permet de faciliter le passage transdermique des molécules (42). Parce que le champ électrique agit directement sur les molécules transportées et non sur la barrière cutanée, l’ionophorèse inversée offre un meilleur contrôle du transport et une moindre irritation de la peau que les autres techniques citées précédemment. L’ionophorèse est un processus actif qui permet à la fois l’administration et l’extraction de composés (42). L’ionophorèse inversée, qui permet l’extraction transdermique, fut développée intensivement pour le dosage de la glycémie, et plus récemment pour les dosages biologiques de la phenylalanine et de l’urée (43-47). Deux études in-vitro d’extraction de la clonidine, la théophylline et l’acide valproïque (45,48) ont mis en évidence le potentiel de la technique pour le monitoring thérapeutique.
Dans le but d’étudier les capacités de l’ionophorèse inversée pour le monitoring thérapeutique, deux principes actifs ont été choisis : la phénytoïne et le lithium. Puisqu’il est établi que l’extraction ionophorètique dépend, entre autre, des propriétés physico-chimiques des molécules, ces deux principes actifs sont très différents (Tableau 2) (49,50). La phénytoïne de taille moléculaire importante présente un caractère lipophile, une
forte liaison aux protéines plasmatiques ainsi qu’une ionisation négative et partielle qui permet son transport par électrorépulsion et électroosmose. Le lithium est un cation de faible masse moléculaire,
fortement mobile et quinze fois plus concentré dans le sang que la phénytoïne. Le lithium constitue l’un des meilleurs candidats pour un monitoring thérapeutique par ionophorèse.
Tableau 2 : Propriétés de la phénytoïne et du lithium
Phénytoïne Lithium
Classe thérapeutique Anti-épileptique Stabilisateur de l’humeur Poids moléculaire (g/mol) 252 7
Lipophilie (Log P) 2.5 -
Marge thérapeutique (µM) 40-80 500-1400
Fraction libre 10% 100%
Charge (% ionisation) Négative (12%)
Dans ce projet, les études menées in vitro et in vivo, (a) établissent la relation entre l’extraction ionophorètique et les concentrations subdermiques ou sériques. (b) Avec la phénytoïne illustrant le cas d’un principe actif fortement lié aux protéines plasmatiques, une étude in vitro démontre l’accès direct de l’ionophorèse à la fraction libre des principes actifs. (c) Avec le lithium, une étude évalue l’aptitude de la technique à mener des études pharmacocinétiques. (d) Toutes ces études font la preuve, in vitro et in-vivo, du concept d’auto-calibration de la méthode par un standard interne.
Références :
(1) Walson PD. Therapeutic drug monitoring in special populations. Clin Chem 1998;44:415-9. (2) Gross AS. Best practice in therapeutic drug monitoring. Br J Clin Pharmacol 1998;46:95-9.
(3) Schummacher GE, Barr JT. Economic and outcome issues for therapeutic drug monitoring in medecine. Ther Drug Monit 1998;20:539-42.
(4) Eadie MJ. The role of therapeutic drug monitoring in improving the cost effectiveness of anticonvulsant therapy. Clin Pharmacokin 1995;29:29-35.
(5) Tonkin AL, Bochner F. Therapeutic drug monitoring and patient outcome. Clin Pharmacokin 1994;27:169-74.
(6) Robinson JD, Charache P. Therapeutic drug monitoring and pharmacokinetics. In: Taylor WJ, Diers Caviness MH, editors. A textbook for the clinical application of therapeutic drug monitoring. 1986. p. 1-76. (7) Bochner F, Tonkin A. The clinician and therapeutic drug monitoring in the 1990s. Med J Aust
1993;158:422-6.
(8) Pickering G, Eschalier A. Therapeutic drug monitoring: a challenge for biologists. Ann Biol Clin 2001;59:27-31.
(9) Loebstein R, Koren G. Clinical pharmacology and therapeutic drug monitoring in neonates and children. Pediatr Rev 1998;19:423-8.
(10) Bailey B, Klein J, Koren G. Noninvasive methods for drug measurement in pediatrics. Pediatr Clin North Am 1997;44:15-26.
(11) Tange SM, Grey VL, Senecal PE. Therapeutic drug monitoring in pediatrics: a need for improvement. J Clin Pharmacol 1994;34:200-14.
(12) Willmore LJ. Antiepileptic drug therapy in the elderly. Pharmacol Ther 1998;78:9-16.
(13) Reed MD, Blumer JL. Therapeutic drug monitoring in the pediatric intensive care unit. Pediatr Clin North Am 1994;41:1227-43.
(14) Svensson CK. Ethical considerations in the conduct of clinical pharmacokinetics studies. Clin Pharmacokin 1989;17:217-22.
(15) Gilman JT, Gal P. Pharmacokinetic and pharmacodynamic data collection in neonates and children. A quiet frontier. Clin Pharmacokin 1992;23:1-9.
(16) Kauffman RE, Kearns GL. Pharmacokinetics studies in pediatric patients, clinical and ethical considerations. Clin Pharmacokin 1992;23:10-29.
(17) Kauffman RE, Banner W, Berlin JL, Blumer JL, Gorman RL, Lambert GH et al. Guidelines for the ethical conduct of studies to evaluate drugs pediatric populations. Pediatrics 1995;95:286-94.
(18) Rowell M, Zlotikin S. The ethical boundaries of drug research in pediatrics. Pediatr Clin North Am 1997;44:27-40.
(19) Thomson AH, Whiting B. Bayesian parameter estimation and population pharmacokinetics. Clin Pharmacokinet 1992;22:447-67.
(20) Pichini S, Altieri I, Zuccaro P, Pacifici R. Drug monitoring in nonconventional biological fluids and matrices. Clin Pharmacokinet 1996;30:211-28.
(21) Rivier L. Techniques for analytical testing of unconventional samples. Baillère's Clinical Endocrinology and Metabolism 2000;14:147-65.
(22) Hammet-Stabler CA, Pesce AJ, Cannon DJ. Urine drug screening in the medical setting. Clinica Chemica Acta 2002;315:125-35.
(23) Williams J, Myson V, Steward S, Jones G, Wilson JF, Kerr MP et al. Self-discontinuation of antiepileptic medication in pregnancy: detection by hair analysis. Epilepsia 2002;43:824-31.
(24) Moeller MR. Hair analysis as evidence in forensic cases. Ther Drug Monit 1996;18:444-9.
(25) Sunshine I, Sutliff JP. Sweat it out. In: Wong SHY, Sunshine I, editors. Handbook of analytical therapeutic drug monitoring and toxicology. Boca Raton: CRC Press, 1997. p. 253-64.
(26) Gorodischer R, Koren G. Salivary excretion of drugs in children: theoretical and practical issues in therapeutic drug monitoring. Dev Pharmacol Ther 1992;19:161-77.
(27) Drobitch RK, Svensson CK. Therapeutic drug monitoring in saliva. An update. Clin Pharmacokinet 1992;23:365-79.
(28) Cone EJ, Jenkins AJ. Saliva drug analysis. In: Wong SHY, Sunshine I, editors. Handbook of analytical therapeutic drug monitoring and toxicology. Boca Raton: CRC Press, 1997. p. 303-33.
(29) Mucklow JC. The use of saliva in therapeutic drug monitoring. Ther Drug Monit 1982;4:229-47.
(30) Liu H, Delgado MR. Therapeutic drug concentration monitoring using saliva samples: focus on anticonvulsants. Clin Pharmacokinet 1999;36:453-70.
(31) Peck CC, Conner DP, Bolden BJ, Almirez RG, Rowland LM, Kwiatkowski TE et al. Outward transdermal migration of theophylline. Pharmacol Skin 1987;1:201-8.
(32) Peck CC, Conner DP, Bolden BJ, Almirez RG, Kingsley TE, Mell LD et al. Outward transcutaneous chemical migration: implications for diagnostics and dosimetry. Skin Pharmacol 1988;1:14-23.
(33) Bradley CR, Almirez RG, Conner DP, Rhyne P, Peck CC. Noninvasive transdermal chemical collection. II. In vitro and in vivo skin permeability studies. Skin Pharmacol 1990;3:227-35.
(34) Peck CC, Lee K, Becker CE. Continuous transepidermal drug collection: basis for use in assessing drug intake and pharmacokinetics. J Pharmacokinet Biopharm 1981;9:41-58.
(35) Conner DP, Millora E, Zamani K, Nix D, Almirez RG, Rhyne-Kirsch P et al. Transcutaneous chemical collection of caffeine in normal subjects: Relationship to area under the plasma concentration-time curve and sweat production. J Invest Dermatol 1991;96:186-90.
(36) Finnin BC, Morgan TM. Transdermal penetration enhancers: applications, limitations, and potential. J Pharm Sci 1999;88.
(37) Kost J, Mitragotri S, Gabbay RA, Pishko M, Langer R. Transdermal monitoring of glucose and other analytes using ultrasound. Nature Medicine 2000;6:347-50.
(38) Mitragotri S, Coleman M, Kost J, Langer R. Transdermal extraction of analytes using low-frequency ultrasound. Pharm Res 2000;17:466-70.
(39) Henry S, McAllister DV, Allen MG, Prausnitz MR. Microfabricated microneedles: a novel approach to transdermal drug delivery. J Pharm Sci 1998;87:922-5.
(40) Guy RH. Iontophoresis - Recent developments. J Pharm Pharmacol 1998;50:371-4.
(41) Prausnitz MR. Electroporation. In: Berner B, editor. Electronically Controlled Drug Delivery. Boca Raton: CRC Press, 1998. p. 185-214.
(42) Delgado-Charro MB, Guy RH. Transdermal iontophoresis for controlled drug delivery and non-invasive monitoring. S T P Pharma Sciences 2001;11:403-14.
(43) Tamada JA, Bohannon NJV, Potts RO. Measurement of glucose in diabetic subjects using noninvasive transdermal extraction. Nat Med 1995;1:1198-201.
(44) Rao G, Guy RH, Glikfeld P, LaCourse WR, Leung L, Tamada J et al. Reverse iontophoresis: non invasive glucose monitoring in vivo in humans. Pharm Res 1995;12:1869-73.
(45) Glikfeld P, Hinz RS, Guy RH. Noninvasive sampling of biological fluids by iontophoresis. Pharm Res 1989;6:988-90.
(46) Merino V, Lopez A, Hochstrasser D, Guy RH. Noninvasive sampling of phenylalanine by reverse iontophoresis. J Control Rel 1999;61:65-9.
(47) Degim IT, Ilbasmis S, Dundaroz R, Oguz Y. Reverse iontophoresis: a non-invasive technique for measuring blood urea level. Pediatr Nephrol 2003;18:1032-7.
(48) Delgado-Charro MB, Guy RH. Transdermal reverse iontophoresis of valproate: a non-invasive method for therapeutic drug monitoring. Pharm Res 2003;20:1508-13.
(49) Yoshida NH, Roberts MS. Structure-transport relationship in transdermal iontophoresis. Adv Drug Del Rev 1992;9:239-64.
(50) Guy RH, Delgado-Charro MB, Kalia YN. Iontophoretic transport across the skin. Skin Pharmacol Appl Skin Physiol 2001;14:35-40.
Structure de la thèse
La thèse est structurée en deux parties. La première partie est une revue de la littérature sur le sujet de l’ionophorèse inversée pour le monitoring transdermique non-invasif.
Chapitre 1 : Dans un premier chapitre, ce manuscrit dresse un état de la technologie. Les mécanismes d’extraction de l’ionophorèse inversée, ses avantages et ses inconvénients, les applications et les récents progrès dont cette technique a fait l’objet sont décrits dans cette revue de la littérature.
Dans une seconde partie expérimentale, le manuscrit s’attache à évaluer les capacités de l’ionophorèse inversée pour le monitoring thérapeutique non-invasif. Deux médicaments, nécessitant une surveillance thérapeutique périodique, ont été choisis comme modèle pour cette étude.
Chapitre 2 : La phénytoïne illustre le cas d’un médicament difficilement extractible par ionophorèse transdermique et fortement lié aux protéines plasmatiques. Ce chapitre examine la relation de dépendance de l’extraction ionophorètique vis-à-vis des concentrations subdermiques (totale et libre) de phénytoïne.
Chapitre 3 : Dans ce chapitre, le lithium est utilisé comme modèle pour l’évaluation in vitro des aptitudes de l’ionophorèse inversée à réaliser non-invasivement des études pharmacocinétiques.
Chapitre 4 : Ce chapitre rend compte des résultats d’une étude menée chez des patients sous lithiothérapie. Cette étude examine la capacité de la technique à proposer une méthode alternative et non invasive pour la surveillance de la lithiémie chez les patients bipolaires.
Chapitre 5 : Dans ce dernier chapitre du manuscrit, les auteurs proposent une optimisation de la formulation des matrices d’extractions ionophorètiques en vue d’applications compatibles avec les contraintes des essais in-vivo.
Chapitre 1
L’ionophorèse inversée pour le monitoring transdermique
non-invasif
Benoît Leboulanger1,2, Richard H. Guy1,2 and M. Begoña Delgado-Charro1,2
1 School of Pharmacy, University of Geneva, CH-1211 Geneva 4, Switzerland
2 Centre international de recherche et d’enseignement (“Pharmapeptides”), F-74160 Archamps, France
Résumé
Ce premier chapitre dresse un état de la technologie. L’ionophorèse consiste en l’application d’un faible courant électrique à la surface de la peau dans le but d’augmenter le transport transdermique des molécules polaires chargées et neutres. Le contrôle de l’électromigration et l’électroosmose, les deux principaux mécanismes de transport de l’ionophorèse, est rendu possible par la modification du courant appliqué et/ou de certains paramètres de formulation des compartiments récepteurs. Alors que cette approche a principalement été utilisée pour l’administration des médicaments par voie transdermique, l’ionophorèse inversée, permettant l’extraction de substances à la surface de la peau, a récemment fait l’objet d’efforts considérables. Cette revue de la littérature décrit les mécanismes d’extraction de l’ionophorèse inversée, ses avantages et ses inconvénients, les applications et les récents progrès dont cette technique a fait l’objet.
Mots-clés: Ionophorèse, Électromigration, Électroosmose, Surveillance de la glycémie, Monitoring
Reverse iontophoresis for non-invasive transdermal
monitoring
Benoît Leboulanger1,2, Richard H. Guy1,2 and M. Begoña Delgado-Charro1,2
1 School of Pharmacy, University of Geneva, CH-1211 Geneva 4, Switzerland
2 Centre international de recherche et d’enseignement (“Pharmapeptides”), F-74160 Archamps, France
Abstract
Iontophoresis is the application of a small electric current to enhance the transport of both charged and polar, neutral compounds across the skin. Manipulation of either the total charge delivered and/or certain electrode formulation parameters allows control of electromigration and electroosmosis, the two principal mechanisms of transdermal iontophoresis. While the approach has been mainly used for transdermal drug delivery, “reverse iontophoresis”, by which substances are extracted to the skin surface, has recently been the subject of considerable effort. Glucose monitoring has been extensively studied and other applications, including therapeutic drug monitoring, are contributing to the development of the technique. An internal standard calibration procedure may ultimately render this novel monitoring technique completely non-invasive.
Keywords: Iontophoresis, Electromigration, Electroosmosis, Glucose monitoring, Therapeutic drug
I. Introduction
Iontophoresis involves the application of a small and defined electrical current to the skin. This process causes increased molecular transport through the skin and has found application, therefore, in transdermal drug delivery [1]. The concept is not new, however; the basic mechanisms were clearly appreciated by Leduc [2,3] in 1900. Nevertheless, it is only now that approved iontophoretic drug delivery systems are finally reaching the market [4].
The symmetry of iontophoresis means that it also enables extraction of solute molecules from within the subdermal compartment to the skin surface. The potential exists, therefore, to use the technique for clinical chemistry without blood sampling. Applications that may be envisaged include general blood chemistry, glucose monitoring, the detection of diagnostic markers, and therapeutic drug monitoring [4]. The mechanism of extraction involves either electromigration of charged species to the electrode of opposite polarity, or electroosmosis of polar, neutral or zwitterionic, molecules to the cathode; hence for cations, both mechanisms are operative.
A number of excellent reviews on
iontophoresis and its applications have been published [1,3,5-9]. Here, attention is focused on reverse iontophoresis and its applications in diagnosis and monitoring. After a brief consideration of the basics underlying electrotransport across the skin, a detailed evaluation of the relevant literature, and a perspective on the future, are presented.
II. Mechanisms of transport
during reverse iontophoresis
A. Electromigration
Conventionally, in iontophoresis, a constant current is applied, such that the flow of electrons is translated into an ion flux across the skin. A power supply establishes the electric field that causes electrons to migrate in the “electrical” portion of the circuit and ions to flow in the “ionic” part (Figure 1). It follows that the number of electrons flowing through the “electrical” portion of the circuit is exactly balanced by the amount of ionic charge flowing through the skin [3].
The electromigration contribution to iontophoretic transport is a direct result of current application. Ionic transport proceeds
Figure 1: Reverse iontophoresis: a schematic diagram illustrating the experimental set-up. Constant current is delivered to the anode and the cathode from a power supply. Cationic and neutral substances are drawn towards the cathode by electromigration (2), electroosmosis (3) and (to a negligible extent, typically) passive diffusion (1). Anionic compounds are attracted into the anode chamber by electromigration (2), while convective solvent flow (3) opposes this phenomenon (again, passive diffusion (1) is negligible).
A n o d e C a t h o d e Drug -Drug+ 2 1 2 1 Drug 3 3
-
+
Constant current (mA) Power supply « E le ctr ic al » circ ui t « Ionic » c ir cuit Skinthrough the skin to maintain electroneutrality [1,3,7]. Faraday's law applies to steady-state transport and relates the number of ions crossing the membrane to the electric current, the time of current passage and the charge per ion [1,3]: i i i
z
F
i
T
M
.
.
=
Equation 1where Mi is the number of moles of the ‘i’ ion, T is the time (s), zi is the valence, F is Faraday's constant (96 487 C.mol-1), and ii the current (A) carried by the ith species.
Given that usually there is more than one ion moving across the barrier, the total number of moles transported (M) by the total current flowing (I) is given by:
∑
=
∑
=
i i i i iz
i
F
T
M
M
Equation 2 where=
∑
i ii
I
Equation 3This leads to the concept of an ion transport number (efficiency of transport) which is the fraction of the total charge that it transports:
I
i
t
ii
=
Equation 4It follows that Equation 1 may be rewritten: i i i
z
F
T
I
t
M
.
.
.
=
Equation 5With respect to the subject of this review, the experimentally measured extraction flux (Ji, mol.s-1) is defined by the ratio of number of moles transported (Mi) to the sampling time (T) (i.e., the duration of reverse iontophoresis):
I
z
F
t
T
M
J
i i i i.
.
=
=
Equation 6Equation 5 shows that iontophoretic extraction is determined by the intensity of current, the time of iontophoresis, the charge and the transport number of the ion of interest. Current intensity (I) is directly and easily controlled by the power supply but is limited, for practical purposes in vivo, to no more than 0.5mA/cm² [6]. The time of each extraction
period must be sufficiently long to ensure that enough analyte is available for detection but not so long that clinically significant changes in the systemic concentration may have occurred. In any case, it must be recognized that reverse iontophoresis can only provide an estimation of the average level of the analyte in the body during the sampling period.
The charge (zi) of the extracted ion is dictated by its molecular structure, and determines the polarity of the electrode at which sampling/analysis will be performed. The transport number, however, is difficult to estimate theoretically as it depends on the other ions contributing to the transport of charge across the skin. When an electric field is established across a membrane, ions on either side will migrate in the direction dictated by their charge. The speed of migration of an ion is determined by its physicochemical characteristics and the properties of the media through which the ion is moving [3,7,8,10]. The sum of the individual ionic charges flowing across the skin must equal the number of electrons “delivered” by the power supply; in other words, there is “competition” among all the ions present to carry the charge.
The transport number of the ion of interest (the ith ion) may also be expressed as follows:
∑
==
n j j j j i i i iu
z
c
u
z
c
t
1)
.
.
(
.
.
Equation 7where cj is the concentration (mol.cm-3), zj the valence, and uj the mobility (cm2.s-1.V-1) of each of the “n” ions in the system [7].
Logically, the transport number depends on concentration (i.e., the available amount of a particular ion to participate in carrying charge across the skin). Likewise, it makes sense that ions, which are more mobile, will play a greater role in the movement of charge through the barrier. Note, however, that the relevant values of concentration (c) and mobility (u) are those inside the skin, rendering their estimation tricky at best and emphasizing the limitations of Equation 7 as a predictive tool.
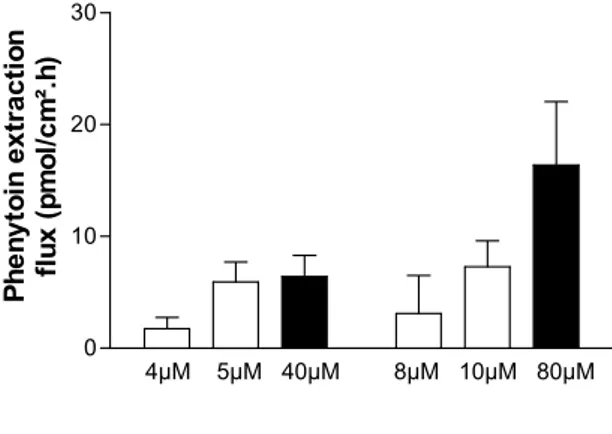
In reverse iontophoresis, the concentration of the analyte is the variable of interest and will depend (in the case of a drug being monitored, for example) on the dosage regimen and the relevant pharmacokinetics. Furthermore, with respect to electromigration, only the ionized fraction of the analyte is extractable and this will depend on the relevant pKa. Similarly, for analytes that are bound to proteins, it is clear that only the free fraction can significantly contribute to charge transport across the skin. Figure 2 illustrates this point for phenytoin, a drug that is normally ~90% bound to albumin. As far as ionic mobility is concerned, regardless of the medium through which transport is occurring, an inverse dependence upon molecular size can be confirmed (and this is another reason, of course, why only unbound substances are extractable by reverse iontophoresis). In summary, therefore, it can be concluded that an ion can function as a major charge carrier if it is small, fully charged, at high concentration, and not significantly protein-bound. Additionally, and ideally, “competing” ions are minimized, a situation not practically realizable for reverse iontophoresis where the
major charge carriers are Na+ and Cl-.
Lastly, it is worth noting that the transport number is a “formulation-dependent” parameter applicable for a given set of conditions. The transport number ti can be determined experimentally; for example, by dividing the total amount of the ion transported by the total charge delivered (using Faraday's law, Equation 1), or from the gradient of a graph of ion flux versus current intensity (as in Equation 6) [11].
B. Electroosmosis
At physiologic pH, the skin is negatively-charged and cation-permselective. When an electric field is imposed across this type of membrane, there is convective or electroosmotic solvent flow induced in the anode to the cathode direction (i.e., in the direction of counter-ion migration) [5,12]. This stream of solvent carries along with it dissolved solutes thereby enhancing the transport of neutral and, especially, polar molecules. Electroosmosis thus reinforces the transport of cations while acting against that of anions.
Figure 2: In vitro reverse iontophoresis fluxes of phenytoin at the anode illustrate that only free drug is extracted. The open bars (mean ± SD) indicate extraction of drug from a subdermal compartment that did not contain albumin. The filled bars represent data obtained when human serum albumin was present at 44 g/l. The results are consistent with a free fraction of phenytoin of approximately 0.1. Data redrawn from [25].
4µM 5µM 40µM 8µM 10µM 80µM 0
10 20 30
Total phenytoin concentration
P h en yt o in extr actio n fl u x (p m o l/ cm ².h )
Important characteristics of this mechanism of electrotransport are, first, that the solvent volume flow (Jvs, volume.time-1.area-1) is proportional to the potential gradient across the skin [12,13] and, second, that the electroosmotic flux of solute (Ji) is independent of molecular size (at least as long as the solute diameter does not approach that of the transport pathway) [5,12]. The relationship between the molar flux (Ji) of the solute “i” and its molar concentration (ci) is given by [14]:
i VS i
J
c
J
=
.
Equation 8In an elegant series of experiments, Jvs during iontophoresis [14] was determined to be 6-19 µl.h-1.mA-1.
In addition to the current density, the pH and the ionic strength are electrode formulation parameters that may modulate electroosmosis [15]. Modifying the pH on either side of the skin can change the charge on the membrane and hence its permselectivity. Practically speaking, only the surface pH can be altered in vivo, of course. Figure 3 illustrates that cathodic extraction of phenylalanine is enhanced by as high a pH as can be feasibly maintained in contact with the skin surface
[16]; in contrast, an acidic pH in the cathode chamber significantly impairs electroosmosis towards the electrode [15], while favoring extraction in the opposite direction, presumably due to a degree of neutralization of the fixed charge on the skin.
For cathodal extraction, electroosmotic flow is increased by lowering the ionic strength of the electrode formulation [15,16]. This phenomenon is less obvious for anodal extraction [15]. However, it should be remembered that a finite level of electrolyte must be present in the electrode chambers (particularly at the anode) to support the Ag/AgCl electrochemistry.
It has also been found that an anode formulation with CaCl2 or MgCl2, instead of NaCl, increased electroosmotic flow from beneath the skin surface towards the anode [17]. Shielding of the net negative charge on the skin is a possible mechanism for this observation. In contrast, in the cathode chamber, to which electroosmosis predominates, enhanced solvent flow was achieved by formulating the electrode bathing solution with Ca++ binding agents (calcein, heparin, or EDTA) presumably exposing a greater negative charge on the skin [16,17].
Figure 3: Electroosmotic extraction of phenylalanine as a function of (a) the subdermal concentration of the amino acid, and (b) the pH of the cathodal formulation. Reverse iontophoretic fluxes increased linearly with analyte concentration, and were significantly higher at pH 8.5 than at pH 7.4. Data redrawn from [16].
1 mM 5 mM 10 mM 0 25 50 75
pH 7.4
pH 8.5
Phenylalanine concentration
E
x
tr
ac
ti
o
n
flu
x
o
f
p
hen
yl
al
an
in
e
(n
m
o
l/cm
².h
)
C. The dominant mechanism:
electromigration or
electroosmosis?
For small mobile ions, electromigration is clearly the principal mechanism; similarly, for neutral, polar substances, electroosmosis dominates as there is no electromigration possible from the electrode. Both mechanisms of electrotransport depend upon the applied current [10,18], with the effect being less marked for electroosmosis [13,19]. As the size of an ion increases, its mobility is reduced and electromigration is compromised. For cations, this means that the dominant mechanism switches from electromigration to electroosmosis with increasing molecular size [20]; for anions, on the other hand, the two contributions will ultimately self-cancel and no transport will be observed. A weak acid, therefore, which is only partially ionized at physiological pH, may be more easily extracted as its neutral form to the cathode (e.g. theophylline [21,22]).
III. Advantages and
limitations of reverse
iontophoresis
Noninvasive sampling methodologies are of obvious benefit to all patients for at least the following reasons: more information is obtainable as sampling can be performed more frequently, decreased pain and discomfort (i.e., better compliance), decreased risk of infection, potential for home-monitoring, etc.
Furthermore, there are special populations for whom noninvasive diagnosis and monitoring would be particularly useful: patients who are repetitively subjected to invasive blood withdrawal procedures, patients who over- or under-respond to standard therapeutic regimens, subjects who are least able to tolerate, recognize or communicate problems with unexpected drug effects, and those who, for whatever reason, are either over- or under-dosed. Such patient populations
include the “critically” ill under intensive care, cancer and AIDS sufferers, pregnant women, those displaying unusual pharmacokinetics, patients receiving simultaneous, multi-drug dosing regimens (e.g., the elderly) and, of obvious special concern, are pediatric patients, for whom the need for noninvasive diagnosis and monitoring is particularly acute.
Even though reverse iontophoresis is much more efficient and reproducible than passive extraction, the quantities of analyte obtained at the skin surface are necessarily small. Dilution factors are likely to fall in the 10 to 100-fold range, or higher. Thus, analytical chemistry demands are significant and sampling periods may be so long, as a result, that changes in systemic concentration can occur. While this would be unacceptable in the case of glucose, for therapeutic drug monitoring at 'steady-state' the problem is less important (i.e., continuous monitoring is unnecessary, and a prolonged sampling time to obtain an average measure of concentration would be reasonable). Thus, an iontophoretic patch could be worn for a few hours at home, for example, and then sent to the clinical chemistry laboratory. Such an “off-line” analysis and quantification would be acceptable, and a sampling device simpler and less expensive to design.
An important limitation occurs when the skin accumulates the analyte of interest such that the initial extraction sample contains mostly information about this local 'reservoir' (this is the case for glucose [21] and lithium [23], for example). A “warm-up” period is necessary, therefore, before readings reflective of systemic levels are obtained.
It is also true that the reverse iontophoretic flux does not reach a constant, 'steady-state' rate instantaneously [24,25] – the time to do so depends on the molecule of interest, and the dominant mechanism of electrotransport. However, whether this limitation is significant has not been completely established; for certain analytes, an acceptable correlation between extraction flux and subdermal
concentration is obtained prior to steady-state as well.
An additional, and significant, limitation is that reverse iontophoresis will simply not work for molecules with particular physicochemical properties. Specifically, proteins, for example, are simply too large to be extracted in amounts that are quantifiable. Extremely lipophilic compounds, with extremely small aqueous solubilities, will also be undetectable; unfortunately, cholesterol falls into this category.
IV. Case studies
In 1954, reverse iontophoresis was first applied to the extraction of sodium and potassium ions [26]. Experiments were performed in vivo, in man, using a metal plate as the electrode. A current density of 0.5 mA/cm² was applied over a skin surface of 8.3 cm² for 5 minutes or longer. In a total of nearly 100 subjects, it was shown that age,
gender, measurement time, measurement site and ambient temperature did not significantly affect the amounts of the cations extracted (Table 1). However, in the longer duration experiments, skin “damage” was observed due to the fact that the pH of the cathodal solution increased from between 6 and 7 to nearly 11. Clearly, therefore, electrolysis of water was taking place at the bare metal electrode and, as a result, it became sensible to henceforth use electrochemically reversible electrodes (e.g. Ag/AgCl) in iontophoresis studies [27].
The practical potential of reverse iontophoresis was appreciated much later (in 1989) when it was demonstrated that the amount of a substance extracted across the skin in this way was linearly related to the subdermal (and, by extrapolation, the systemic) concentration [21]. This relationship was shown for clonidine, theophylline and glucose; that is, for a more or less fully charged cation, for a partially charged anion, and for a neutral polar molecule (Figure 4).
Table 1: In vivo reverse iontophoretic extraction of potassium and sodium ions as a function of different parameters. The study group comprised 98 human volunteers. Data from [26].
Potassium Sodium Ratio
(µmol/h) (µmol/h)
Measurement time
(10 measures) 1.8 ± 0.3 4.3 ± 0.5 2.4 ± 0.6 Measurement site
Volar surface forearm 1.8 ± 0.4 4.3 ± 0.8 2.4 ± 0.4 Back of lower leg 1.6 ± 0.5 4.2 ± 0.8 2.7 ± 0.5 Upper part of abdomen 1.9 ± 0.4 4.5 ± 1.0 2.4 ± 0.5 Ambient temprature 32-33°C 1.8 ± 0.3 4.3 ± 0.5 2.4 ± 0.4 21°C 1.7 ± 0.4 4.4 ± 0.6 2.5 ± 0.4 Gender Male 1.7 ± 0.5 4.3 ± 0.8 2.5 ± 0.3 Female 1.7 ± 0.5 4.2 ± 0.6 2.5 ± 0.3 Age <24 years 1.8 ± 0.5 4.2 ± 0.7 2.3 ± 0.5 25-49 years 1.7 ± 0.3 4.3 ± 0.5 2.6 ± 0.3 >50 years 1.6 ± 0.3 4.4 ± 0.5 2.7 ± 0.4
Subsequently, attention became focused upon glucose. Obviously, the availability of a noninvasive tool with which to monitor blood sugar in diabetics would be of immense medical benefit. The conventional, “finger-stick” method, while precise and effective, is rarely used with sufficient frequency to reduce or avoid either hypo or hyper-glycemic events, despite compelling evidence that such an approach can significantly impact the chronic progression of the disease [28]. Reverse
iontophoresis experiments in vitro [29] and initial in vivo studies in non-diabetic subjects [30] established proof-of-concept, and led to the commercial development of an integrated device (the Glucowatch Biographer® [31,32]) which is able to extract glucose iontophoretically across the skin and then assay sugar in situ with an on-board amperometric biosensor (Figure 5). The mechanism of electrotransport of glucose is electroosmosis, meaning that, during each Figure 4: In vitro iontophoretic sampling of clonidine, theophylline and glucose. The amounts of the three compounds extracted across hairless mouse skin were linearly correlated with their subdermal drug concentrations. Data redrawn from [21].
0 250 500 750 1000 1250 0 10 20 30 40 Theophylline*10 Clonidine 0 2500 5000 7500 Glucose
Drug concentration perfused (Theophylline and Clonidine in ng/ml)
(Glucose in µg/ml) C loni di ne a n d th e o phy ll ine a m ount s a m pl e d ( n g) G lu c o s e am o u n t sa m p le d ( n g )
Figure 5: Continuous glucose monitoring in vivo with the Glucowatch Biographer® over a 12-hour period (closed circles) compared with the typical information available to a diabetic from two “finger-stick” measurements (open squares) pre-lunch and pre-dinner. Data redrawn from [32].
11 14 17 20 23 0 4 8 12 16 20 Glucowatch Fingerstick Hypoglycaemia Hyperglycaemia Time of day (h) G luc os e m e a s u re me nt (m M )
sampling period (20 minutes, initially, a shorter time in the G2 version of the device), the amount of analyte to be detected is very small. An exquisitely sensitive analytical method is therefore required, and involves a highly optimized adaptation of the Pt-glucose oxidase sensor [33].
A significant quantity of data has now been published to illustrate the efficiency of this reverse iontophoresis technology to track changes in the blood sugar levels of diabetics over the entire range of glycemia [32,34-39]. The quality of this information led to the Glucowatch being approved for use in adults by the U.S. Food and Drug Administration in 2001. Additional work in children (7-17 years) allowed this approval to be extended to juvenile diabetics the following year [40].
The long-term use and usefulness of the Glucowatch remain to be seen; nevertheless, there can be little doubt that this first truly noninvasive approach to the monitoring of blood sugar has made a paradigm shift in the field. It should be said that limitations of the approach are apparent, not least the lenghtly, 2-3 hour, warm-up time before measurements can be made (due to the need to empty a glucose reservoir in the skin) and the fact that a “finger-stick” blood measurement is essential to calibrate the device.
Other applications of reverse iontophoresis can be divided into diagnosis/monitoring and therapeutic drug monitoring. An innovative
concept was to use the approach as a diagnostic tool for cutaneous inflammation [41]. Prostaglandin E2 (PGE2) was monitored in response to the transdermal delivery of irritant drugs. It was hypothesized and shown that low-level iontophoresis (0.05 mA/cm² over 2 cm²) of saline did not by itself provoke an increased production of inflammatory markers in vivo, in the hairless guinea pig. Subsequently, potentially irritant drugs (chlorpromazine, chloroquine, promazine, tetracaine and metoclopramide) were administered iontophoretically (Figure 6). Then, the anodal extraction of PGE2 from the site of drug administration was monitored and compared to the saline control. Significant increases were observed that correlated well with more classic determinations of irritation (e.g. the Draize test, lesion score).
The reverse iontophoretic extraction of phenylalanine has also been demonstrated [16]. In phenylketonuria, a severe metabolic disease, the enzyme which biotransforms phenylalanine is missing. Early detection of the disease and subsequent control of the diet are therefore essential. Children with the disease are frequently monitored via blood samples and a noninvasive approach would therefore be of interest. Phenylalanine is zwitterionic at physiologic pH and is therefore extracted during reverse iontophoresis by an electroosmotic mechanism. Like glucose, it has been shown that the amounts detected at the
Figure 6: Correlation between amount (in pg) of PGE2 recovered in the gel and irritation (r²=0.96). Iontophoretic systems containing 100 mM drug were applied at 50 µA/cm² for 24h. Graph redrawn from [41]. 0 1000 2000 3000 4000 0 2 4 6 8
Irritation score
PGE
2(pg/gel)
Chlorpromazine Tetracaine Metoclopramide Saline Chloroquine Promazinecathode are proportional to the subdermal concentrations (Figure 3). However, phenylalanine systemic concentrations, even in phenylketonuria, are much less than typical glucose levels in diabetics. It follows that the analytical chemistry challenge for the monitoring of phenylalanine via reverse iontophoresis is considerable. On the other hand it should be said that continuous and frequent monitoring, as performed by the Glucowatch®, is not necessary for sufferers of phenylketonuria; a device that simply collects the sample (once a day or once a week, for example), which is subsequently sent for analysis at a central analytical laboratory, would be perfectly acceptable.
Very recently, the reverse iontophoretic extraction of urea has been performed in 17 patients (21-35 years) with impaired kidney function [42]. Urea was extracted by electroosmosis to the cathode by current application for 5 minutes. The extracted amounts correlated well with urea levels in the blood (r²=0.88). A logical application of this approach is to determine when dialysis should be performed in pediatric patients with kidney disease. A proof-of-concept study was subsequently conducted in six juvenile subjects (aged 9-16 years) for whom it was clearly shown that the amounts of urea extractable pre- and post-dialysis were quite different.
Therapeutic drug monitoring applications of reverse iontophoresis have recently attracted heightened interest. The potential of the approach was first explored using caffeine and theophylline in a model designed to mimic the developing cutaneous barrier in a premature neonate [22]. While the idea appears feasible for full-term infants, whose stratum corneum performs as well as that of an adult, the technique is less satisfactory when the barrier is impaired (as is the case, of course, for premature babies). The problem is caused by the fact that, superimposed upon the electrotransport of the target analyte being extracted by reverse iontophoresis, there is a
significant passive transport which confounds straightforward interpretation of the data. Nevertheless, the noninvasive nature of the technique implies that it may have other useful applications in the case of the sick neonate, at least when skin barrier function is intact.
An important consideration when assessing the feasibility of reverse iontophoresis for therapeutic drug monitoring is the degree to which the compound of interest is protein-bound. Logically, only the free drug is electrotransported across the skin as the protein-bound form is too large to be extracted. This issue has been addressed with two anti-convulsant drugs, valproic acid [24] and phenytoin [25], approximately 90% of which are typically bound to plasma proteins. Reverse iontophoresis extraction of both drugs in a concentration dependent fashion was demonstrated over a wide-range encompassing those free levels observed in patients undergoing treatment. Valproate was extracted to the anode, while phenytoin (pKa=8.3) was recovered at both anode (the ionized fraction of the drug being attracted by electromigration) and cathode (the neutral form being carried by electroosmosis). When the level of protein was reduced in subdermal compartment, the amount of drug extracted was increased consistent with the rise of the free drug level (Figure 7). Equally, when monitoring phenytoin at a fixed subdermal protein level, introduction of valproate led logically to an increase in the free amount of the first drug and a higher rate of extraction due to the impact of competitive binding. The sensitivity of the method to respond to changes in free drug concentration in this way supports its potential usefulness for monitoring substances with a narrow therapeutic window. On the other hand, it must be recognized that, for lipophilic drugs like valproic acid and phenytoin, the free systemic concentrations are quite low (50 - 105 µM and 4 - 8 µM, respectively) and the amounts extracted by reverse iontophoresis are extremely small
(indeed, the in vitro experiments described above were performed with radiolabelled drugs). Once more, the analytical challenge in vivo will be very demanding.
With lithium, a drug used to treat bipolar disorders, on the other hand, the analytical chemistry problem is much less severe. First of all, as a small, non-protein bound cation, Li+ is reverse iontophoretically extracted much more efficiently than the aforementioned anti-convulsant drugs [43]. Second, the effective plasma concentrations are much higher for lithium such that the amounts detected at the skin surface can be assayed with existing technology. In vitro, the linearity and rapidity
of Li+ extraction from a physiological buffer was simply demonstrated (Figure 8); when the concentration of Li+ in the sub-dermal compartment was varied over time, to simulate a pharmacokinetic profile, the extraction profile closely followed the “absorption” and “elimination” phases of the curve. Subsequently, an in vivo study [23] in patients being treated with lithium has shown the potential of reverse iontophoresis to provide a useful clinical tool. The reverse iontophoretic extraction fluxes were extremely well-correlated with the corresponding plasma concentrations. Phenytoin 80 µM 40 to 80 µM 80 µM Albumin 44 to 22 g/l 44 g/l 44 g/l Valproate - - 0 to 542 µM Free phenytoin 8 to 16 µM 4 to 8 µM 9 to 14 µM 18 22 0 25 50 75 100 Hours 18 22 0 10 20 30 40 50 18 22 0 50 100 150 E xtr ac ti o n fl u x (p m o l/ cm ². h) of ph eny toi n
Figure 7: Monitoring of free phenytoin by reverse iontophoresis. The impact of (a) changing albumin concentration (1st panel), (b) changing drug concentration (2nd panel), and (c) addition of a competing drug, valproate (3rd panel), is illustrated. Data from [25].
0 60 120 180 240 300 360 0.0 0.5 1.0 1.5
J
Li[Li]
0 25 50 75 100Time (min)
Sub
d
e
rm
a
l
c
o
nc
e
n
tr
a
ti
on (
m
M)
Ex
tr
a
c
tion f
lux
(n
m
o
l/cm
².h
)
Figure 8: Monitoring of subdermal lithium concentration changes. Continuous line is the subdermal lithium concentration (mM). Dotted line is the cathodal extraction flux (nmol/cm².h). Data taken from [43].
V. Optimization
To expand the range of reverse iontophoresis applications, and improve on the existing technology, three strategies present themselves immediately for consideration.
Most obviously, an improvement in analytical sensitivity is desirable. The lower the extracted amount that can be detected, the larger the number of potential candidates for the technique, and the shorter the time of sampling (and, hence, the lower the total charge passed across the skin). Further discussion of this point, however, is outside the scope of this review.
Second, we may anticipate that optimization of the iontophoretic conditions will lead to maximization of the extracted amount. Thus, choosing the right current, current density, current profile and “acceptor” phase for the extracted analyte may be expected to improve the extraction efficiency. It is well-established that iontophoretic transport is directly proportional to the current and to the time of current application. In practice, however, there are limits to which these parameters can be increased. In terms of current density, it is generally agreed that 0.5 mA/cm² is the maximum tolerable in man [6]. It follows that the total current can be increased by increasing the surface area extracted. But, if one maintains the current density fixed, even under these conditions, the degree of sensation experienced by the subject increases with treated area, presumably because a greater number of dermal nociceptors are activated [30]. There are at least two other difficulties associated with increasing the total current and the area of skin over which reverse iontophoresis extraction is performed: (i) more current means that the (typically) Ag/AgCl electrodes used must be coated with an augmented larger of AgCl to ensure that the correct electrochemistry operates throughout the sampling period, and (ii) more area implies a greater volume into which the sample is collected, and this may
place more demands on the analytical method. While it has been suggested that iontophoresis-induced reddening of skin can be reduced by ‘pulsing’ the current on/off at different frequencies [15], the practical result is that the impact of irritation is not proven. In addition, as the extraction is much less efficient during the ‘off’ period, the total time for sampling has to be increased so that the total desired current can be passed. Alternating current shows no benefits whatsoever; however, switching electrode polarity at the end of each sampling period, as is done in the Glucowatch®, has the distinct advantage of allowing regeneration of the Ag/AgCl electrodes [44].
The third strategy is a method to avoid the present necessity to calibrate reverse iontophoretic extraction of an analyte with a blood sample. The amount of the compound of interest recovered at the skin surface is diluted in a certain volume of “acceptor” fluid. The concentration therein depends on the efficiency of extraction (the analyte’s transport number for an ion, the electroosmotic flow for a neutral species) and the volume of the “acceptor” solution. In the case of the Glucowatch®, for example, in each sampling period, the electroosmotic flow of less than 1µl is diluted into a volume of 400µl [44]; that is, a three order of magnitude dilution of the glucose. Calibration is therefore essential to relate the amount of sugar extracted to the blood concentration. The concept of an “internal standard” was initially proposed in 1993 [45] and has recently been significantly refined and reduced to practice [24]. The idea is as follows: reverse iontophoresis extracts numerous compounds at the same time; i.e., the process is non-specific and is only rendered specific for a particular compound by the use of a selective and precise assay. Suppose now that, in addition to the chosen target analyte (A), a second substance is also specifically analyzed in each sampling period. Suppose, further, that the blood concentration of this second molecule (IS) is effectively constant. It
follows that there should be a proportionality between the measured extraction flux ratio of A and IS (JA/JIS) and the ratio of their subdermal, or blood, concentrations (CA/CIS):
IS A IS A
C
C
K
J
J
=
.
Equation 9It follows that, given CIS is fixed and (presumably) known: IS A IS A
J
J
K
C
C
=
.
Equation 10Thus, if the proportionality constant K can be determined and shown to be invariant in a subject population, then an experimental determination of JA/JIS, together with the known, ‘constant’ term (CIS/K), allows CA to be found without the need for blood sampling. The success of this idea rests on the independence of the iontophoretic transport of the analyte and the internal standard. In other words, it is important that a change in the transport number of A (due, for example, to a fall in its systemic concentration) is not compensated by an increase in that of IS. In this case, the validity of Equation 9 breaks down. When the concept was proposed initially [45], the design of the experiments led to exactly this violation, with the result that the method could not be validated. Recently, however, the principle has been re-visited [24], the experimental test designed more carefully, and the technique has been shown to work. The first demonstrated success involved the reverse iontophoretic extraction of valproate using glutamic acid as an anionic internal standard [24]. Although the concentration of glutamate in vivo is not sufficiently constant for this amino acid to be considered as a practical internal standard, it served perfectly to prove the concept in this study. It was shown that (i) the extraction flux of valproate varied linearly with its subdermal concentration, (ii) the extraction flux of glutamate remained constant as the valproate concentration fluctuated, and (iii) the ratio of the valproate to glutamate extraction fluxes was proportional both to their subdermal
concentration ratio (Equation 9) and, as the glutamate concentration was fixed, to the valproate concentration. The approach allowed experimental variability to be reduced and permitted the subdermal valproate to be found even before the iontophoretic transport achieved ‘steady-state’.
Subsequently, similar success was achieved with the Li+/Na+(analyte/internal standard) couple (Figure 9). The sodium ion is a useful and practical internal standard due to the fact that the concentration of NaCl in vivo does not vary outside the range of 125-145 mM (and typically remains within a much narrower window); Na+ is also the major charge carrier in iontophoresis in the outward direction towards the cathode (much as Cl -performs the same function towards the anode). In vivo measurements, in patients, confirmed the constancy of the proportionality constant K in Equation 9. However, while in vitro experiments [46] indicated that Na+ may prove a valid internal standard for glucose as well, a subsequent in vivo study revealed that electroosmotic flow is a much more sensitive phenomenon and can vary by nearly a factor of ten even while the electromigrative flux of Na+ remains unchanged. It follows that it will be necessary to identify an electroosmotically-extracted internal standard for glucose in order to avoid the need for blood sampling.
VI. Conclusion
Recent progress in reverse iontophoresis confirms its considerable potential. The approval and commercialization of the Glucowatch® represents an important milestone for the technology as the first truly noninvasive monitoring device for diabetics. The value of the method is readily appreciated, furthermore, not only as a research tool but also as a practical means by which to improve the quality of care (and life) in patient populations for which repetitive blood sampling represents a significant burden:
pediatric, geriatric and chronically ill individuals are obvious examples. Therapeutic drug monitoring is similarly accessible via reverse iontophoresis and it is to be hoped that the size of the commercial markets here (relative to that for glucose monitoring) do not deter the ultimate realization of practical devices. The future holds promise, in particular, if analytical tools continue to evolve in term of sensitivity, specificity, and miniaturization, as they have in the recent past. If this is the case, then the application of reverse iontophoresis in “smart”, feedback drug delivery systems, and in remote sensing, can be foreseen.
Aknowledgements
This work was supported by the Fonds National Suisse de la Recherche Scientifique (3200-059042.99/1), the Programme Commun en Génie Biomédical of the EPFL and the Universities of Geneva and Lausanne, and USAAMRAA grant DAMD 17-02-1-0712, Fort Detrick, MD. The information presented does not necessarily reflect the position or the policy of the U.S. Government, and no official endorsement should be inferred.
References
1. Burnette RR 1989 Iontophoresis Transdermal Drug Delivery, ed J Hadgraft and RH Guy (New York: Marcel Dekker) pp 247-291 2. Leduc S 1900 Introduction of medicinal
substances into the depth of tissues by electric current Ann Electrobiol 3 545-560
3. Sage BH and Riviere JE 1992 Model systems in iontophoresis - transport efficacy Adv Drug Deliv Rev 9 265-287
4. Merino V, Kalia YN and Guy RH 1997 Transdermal therapy and diagnosis by iontophoresis Trends Biotechnol 15 288-290 5. Pikal MJ 1992 The role of electroosmotic flow
in transdermal iontophoresis Adv Drug Deliv Rev 9 201-237
6. Ledger PW 1992 Skin biological issues in electrically enhanced transdermal delivery Adv Drug Deliv Rev 9 289-307
7. Phipps JB and Gyory JR 1992 Transdermal ion migration Adv Drug Deliv Rev 9 137-176 8. Scott ER, Phipps JB, Gyory JR and
Padmanabhan RV 2000 Electrotransport systems for transdermal delivery: a practical implementation of iontophoresis Handbook of Pharmaceutical Controlled Release Technology, ed DL Wise (New York, USA: Marcel Dekker) pp 617-659
Figure 9: Simultaneous monitoring of lithium and sodium fluxes as a function of time. Data taken from [43]. 0 60 120 180 240 300 360 0 2 4 6 8


![Figure 9: Simultaneous monitoring of lithium and sodium fluxes as a function of time. Data taken from [43]](https://thumb-eu.123doks.com/thumbv2/123doknet/2205465.12962/31.892.166.524.193.413/figure-simultaneous-monitoring-lithium-sodium-fluxes-function-data.webp)


