Quantification of Four Isoflavones in Forages with UPLC
®-MS/ MS, Using
the Box-Behnken Experimental Design to Optimize Sample Preparation
Frédéric Daems1 ; Jean-Michel Romnee1 ; Catherine Rasse2 ; Eric Froidmont3 ; Stéphanie Heuskin4 ; Georges Lognay41 Valorisation of Agricultural Products Department, Walloon Agricultural Research Center, Chaussée de Namur 24, B-5030 Gembloux, Belgium
2 SMCS-IMMAQ, Université catholique de Louvain, Voie du Roman Pays 20, B-1348 Louvain-la-Neuve, Belgium 3 Products and Sectors Department, Walloon Agricultural Research Center, Rue de Liroux 8, B-5030 Gembloux, Belgium
4 Analytical Chemistry, Agro-Bio Chem Department, Gembloux Agro-Bio Tech, University of Liège, Passage des Déportés 2, B-5030 Gembloux, Belgium
Abstract
A performant method for the simultaneous quantification of daidzein, genistein, formononetin, and biochanin A in forages using an UPLC®-MS/MS was developed and fully validated. The ultrasound-assisted extraction and enzymatic hydrolysis used in the sample preparation step were optimized using the Box-Behnken experimental design. The optimal extraction conditions used for a representative mix of forage plants were 80 °C, 10 min, and 55 % methanol, and for hydrolysis, they were 20 °C, 18 h, and pH = 6. The chromatographic separation was achieved using an Acquity UPLC® HSS T3 column, with a water/ methanol linear gradient containing 0.01 % of formic acid at a 0.55 mL min-1 flow rate. The four isoflavones were detected by ESI mass spectrometry in positive ion MRM mode. The method allows high throughput analyses of samples and showed an adequate linear regression model for all isoflavones over a range from 5 to 125 ng mL-1. There weregood intra- and inter-day precisions (≤8.2 and ≤7.6 %) and accuracy (≤11.4 and ≤7.1 %). The recovery rates were in an acceptable range of 70-120 %, except for biochanin A, where the rate was about 50 %. Good method repeatability was also observed, and there was no matrix effect or carryover problem. The sample extracts were stable for at least 6 days of storage at -21 and 6 °C. The method proved to be sensitive, precise, and accurate for discriminating a wide variety of forages likely to be grazed by ruminants according to their isoflavone contents and to observe the impact of storage process on isoflavone content in forages.
Keywords UPLC®-MS/MS ; Optimization ; Experimental design ; Validation ; Isoflavones ; Forages
Electronic supplementary material The online version of this article (doi:10.1007/sl0337-016-3074-4)
contains supplementary material, which is available to authorized users.
Introduction
Isoflavones are secondary plant metabolites and form one of the most common categories of phytoestrogens [1, 2]. Isoflavones are polyphenolic compounds that are structurally similar to 17β-estradiol. In addition to their involvement in plant normal growth and development, numerous health benefits have been attributed to isoflavones [1-3], but many of them are also considered to be endocrine disruptors, with the potential to cause adverse health effects [4, 5]. They are found mainly in the Fabaceae family, such as soy (mainly daidzein and genistein) [1, 2, 6, 7] or red clover (mainly formononetin and biochanin A) [7-9], usually conjugated with a glucosyl group, which is often esterified with acetyl or malonyl groups [1, 2, 6, 8]. These conjugated forms are hydrolyzed in the human or animal gut into their aglycone forms before being metabolized [1,3].
Many different sample preparations (including extraction, hydrolysis, and purification steps) and analytical methods for quantifying plant phytoestrogens (including isoflavones) have been reported in the literature [3, 6, 7, 10-13]. The development of an optimized extraction procedure that would suit all of them is a challenging task. Ultrasound-assisted extraction (UAE) is now the most commonly used technique to extract isoflavones from plants matrix. This technique is cheap, has low instrumental requirements, and enhances extraction efficiency [6, 14]. The quantification of isoflavones is usually performed using reversed phase liquid chromatography (RP-LC) with gradients of a binary solvent system that contains acidified water and an acidified polar organic solvent, such as methanol or acetonitrile, and ultraviolet (UV) or mass spectrometry (MS) detection [3, 7, 13]. Considering the multiple sample preparation methods found in scientific literature, the wide variety of forage plants likely to be grazed by ruminants, and the wide variation in isoflavone concentrations, the objective of this study was to develop a reliable and performant analytical method for quantifying four isoflavones in one of the most important sources of isoflavones in cow feed. Response surface methodology (RSM) was used to optimize sample preparation. The whole analytical method was validated and used to measure daidzein, genistein,
formononetin, and biochanin A in forages silages originating from three different meadows. This development is part of a larger study on the metabolization of the biomolecules of interest and the potential accumulation of metabolites such equol in milk [15, 16].
Materials and Methods
Chemicals and Reagents
A freeze dried forage sample containing six plants (Trifolium pratense L., Trifolium repens L., Medicago sativa L., Lotus corniculatus L., Medicago lupulina L, and Lolium perenne L.; 1:1:1:1:1:1, w/w/w/w/w/w) was mixed with flaxseed meal [4:1, w/w; 93.7 ± 0.1 % dry matter). Formononetin 'FO' (CAS number: 485-72-3), biochanin A 'BA' (491-80-5), genistein 'GE' (446-72-0), and flavone 'IS' (525-82-6) were bought from Sigma-Aldrich (Diegem, Belgium). Daidzein 'DA' (486-66-8) was acquired from Cayman Europe (Tallinn, Estonia). Daidzein-d4 (1219803-57-2) was purchased from C/D/N ISOTOPES (Pointe-Claire, Canada). Individual molecule stock
solutions (100 µg mL-1) were prepared in methanol and stored at -20 °C in the dark.β-Glucosidase (from almonds, ≥6 U rng-1, 9001-22-3), β-glucuronidase (type H-2 from Helix pomatia, ≥ 85000 units mL-1, 9001-45-0), and cellulase (from Aspergillus niger, ≥0.3 units mg-1, 9012-54-8) were bought fromSigma-Adlrich (Diegem, Belgium). Sodium acetate (127-09-3) was obtained from Merck KGaA (Darmstadt, Germany). Throughout the study, the powder enzymes and Helix pomatia juice were dissolved in different proportions of 0.2-M sodium acetate buffer solution set at pH values between 4 and 6 (depending on the experimental design). Methanol 'MeOH' (LC-MS and HPLC grade) and acetonitrile 'ACN' (HPLC grade) were obtained from J.T Baker (Devender, Netherlands). Ethanol (96 %, AnalaR NORMAPUR) 'EtOH' was obtained from VWR (Fonte-nay-sous-bois, France), and formic acid (ULC-MS, 99 %) was obtained from Biosolve (Valkenswaard, the Netherlands). Deionized water has been prepared using a Milli-Q® Gradient system (Millipore, Overijse, Belgium).
LC-MS/MS Analysis
The LC analyses were performed on an ACQUITY UPLC® from Waters (Zellik, Belgium) equipped with a Waters ACQUITY UPLC® HSS T3 column (2.1 x 100 mm, 1.8-µm particle size) with a preconnected in-line filter (0.20 µm). The column was kept at 65 °C. The vials were at 4 °C, and an aliquot of 10 µL was injected. The mobile phase consisted of ultrapure water with 0.01 % of formic acid (eluent A) and methanol with the same percentage of acid (eluent B). The gradient elution was operated at a flow rate of 0.55 mL min-1 according to the following optimized gradient profile allowing good chromatographic resolution: 30 % B (0.0-1.0 min), 30-70 % B (1.0-6.0 min), 70-90 % B (6.0-6.1 min), 90 % B (6.1-6.5 min), and 90-30 % B (6.5-6.6 min). The column was then left to reequilibrate under the initial conditions for 1.4 min, resulting in a total runtime of 8 min.
The eluting compounds were detected using a Waters Quattro Premier XE (Micromass® Waters, Zellik, Belgium) with an electrospray ionization (ESI) interface. The ESI source was operated in positive ionization mode, and the quantification was performed using multiple reactions monitoring (MRM). A splitter was placed at the entrance of the device (split ratio 9/20) to give a mobile phase flow rate of 250 µL min-1 inside the mass spectrometer. The optimal source and desolvation temperatures were 140 and 350 °C, respectively. Cone gas and desolvation gas flow (both N2) were set at 50 and 700 L h
-1
, respectively. Argon was used for the collision-induced fragmentation. All the data were collected and processed using the MassLynx® software with a Quanlynx® program (Micromass® Waters, Zellik, Belgium).
Sample Preparation
An overview of the sample preparation procedure is shown in Fig. 1. Extraction was undertaken in an ultrasonic bath
(S80H, Elmasonic, Singen, Germany). 500 ± 5 mg of freeze-dried sample were mixed with 25 mL of solvent into a glass test tube with NS joints (Lenz Laborglas, Wertheim, Germany), with a Vigreux column (Lenz Laborglas, Wertheim, Germany). The best extraction conditions were determined using the experimental design described hereafter.
The extract was then poured into a centrifuge tube (50 mL) and centrifuged (5 min at 3200g). The 1 mL of the supernatant was then evaporated to dryness at 65 °C, and with a gentle stream of nitrogen. The dry residues were solubilized with 1 mL of sodium acetate buffer. The solution was sonicated (5 min at 750 W and room
temperature) and vortexed, and then 2 mL of the enzymatic solution was added. The mixture was then placed in an oven and shaken continuously (conditions: see experimental design). The mixture was centrifuged (5 min at 3200 g). An aliquot of supernatant was diluted with several H2O:methanol (40:60,v/v) solutions, depending on
diluted extract was transferred into a glass tube (15 mL) and evaporated to dryness. The dry residues were then reconstituted in 1 mL of H2O:methanol (40:60, v/v) with ISFlavone at 20 ng mL-1 and ISDaidzein-d4 at 50 ng mL-1. The
reconstituted solution was filtered through an Uptidisc™ CA 13 mm/0.2 µm (Interchim, Montluçon, France) and analyzed by UPLC®-MS/MS.
Fig. 1 Overview of the sample preparation optimization and validation described in this study
Experimental Designs
The Box-Behnken experimental design, involving three factors and three levels, was used to optimize both the extraction and hydrolytic conditions. The levels chosen for each factor in this study were based on the single-factor experiments and literature. The complete design consisted of 16 combinations, including four replicates of the center point.
The experimental results were analyzed by quadratic stepwise regression to fit the second-order equation (Eq. 1):
where Y stands for isoflavone yield, X1 - X2 - X3 for independent variables, β0 for the model intercept, and Bi - Bii
- Bij for regression coefficients of variables for linear, quadratic, and interaction terms, respectively. The JMP®7
statistical software package (SAS institute, Cary, USA) was used to obtain the coefficients of the quadratic polynomial model and to determine the best conditions for the ultrasound-assisted extraction 'UAE' and hydrolysis steps. Y was expressed in µg g-1 of dry matter 'DM', which was determined at 103 ± 2 °C until
constant weight [19].
For UAE optimization, the dried resuspended residues were mixed with 2 mL of enzyme mix solution (pH = 5), which contained ≥0.06, ≥4.2 and ≥3400 units mL-1 of cellulase, β-glucosidase, and β-glucuronidase, respectively. In line with two other studies [20, 21], the pH of buffer solution, temperature, and duration of the hydrolysis process was fixed at 5, 37 °C, and 18 h, respectively. Three extraction solvents (ACN, EtOH, and MeOH) were evaluated. Extraction temperature (X1), duration (X2), and solvent proportions (X3) were chosen as independent
variables. The three levels for each factor were: X1 (20, 50, and 80 °C); X2 (10, 50, and 90 min); and X3 (10, 50,
and 90 % organic solvent/water). The 16 combinations are summarized in Table 1. After the statistical treatments, the better extraction conditions were validated by performing seven extractions. In addition, the extraction efficiency was also checked by performing three consecutive extractions.
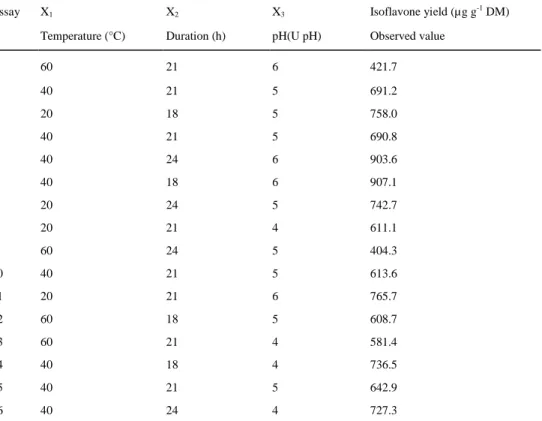
The enzymatic hydrolysis step was optimized using a second Box-Behnken experimental design. The three factors and levels selected were: hydrolysis temperature (X1: 20, 40, and 60 °C); hydrolysis time (X2: 18, 21, and
24 h); and pH (X3: 4, 5, and 6). The 16 combinations are shown in Table 2. The experimental results were
analyzed according to the aforementioned method, and the model was validated.
Method Validation
The validation was performed according to the EMA guidelines [22]. The calibration curves were based on the ratio between the peak areas and that of IS (Aa/Ais, daidzein-d4 (50 ng mL
-1
) was used for daidzein and flavone (20 ng mL-1)for the other three compounds) versus the standard concentration. A stock solution containing the four analyte (1 µg mL-1) was prepared in H2O:methanol (40:60, v/v). The working standard solutions were then
prepared by diluting this stock solution with different volumes of H2O:methanol (40:60, v/v).
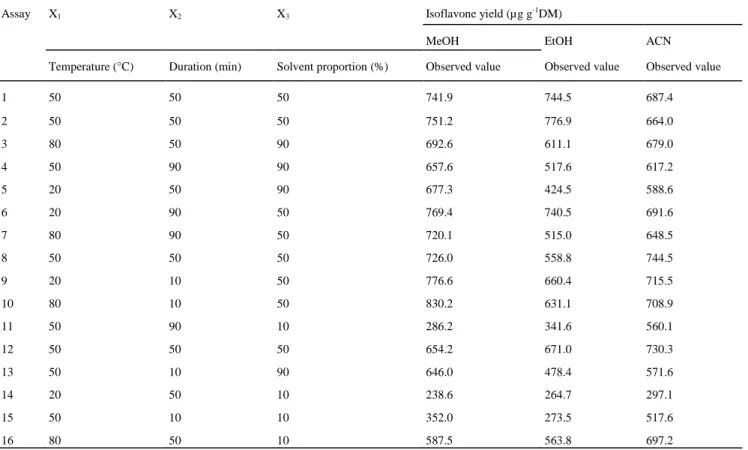
Table 1 Box-Behnken design and the response for isoflavone yield extracted from the forage mix
Assay X1 X2 X3 Isoflavone yield (µg g-1DM)
MeOH EtOH ACN
Temperature (°C) Duration (min) Solvent proportion (%) Observed value Observed value Observed value
1 50 50 50 741.9 744.5 687.4 2 50 50 50 751.2 776.9 664.0 3 80 50 90 692.6 611.1 679.0 4 50 90 90 657.6 517.6 617.2 5 20 50 90 677.3 424.5 588.6 6 20 90 50 769.4 740.5 691.6 7 80 90 50 720.1 515.0 648.5 8 50 50 50 726.0 558.8 744.5 9 20 10 50 776.6 660.4 715.5 10 80 10 50 830.2 631.1 708.9 11 50 90 10 286.2 341.6 560.1 12 50 50 50 654.2 671.0 730.3 13 50 10 90 646.0 478.4 571.6 14 20 50 10 238.6 264.7 297.1 15 50 10 10 352.0 273.5 517.6 16 80 50 10 587.5 563.8 697.2
Table 2 Box-Behnken design and the response for isoflavone yield hydrolyzed from the methanolic extract
Assay X1 X2 X3 Isoflavone yield (µg g-1 DM)
Temperature (°C) Duration (h) pH(U pH) Observed value
1 60 21 6 421.7 2 40 21 5 691.2 3 20 18 5 758.0 4 40 21 5 690.8 5 40 24 6 903.6 6 40 18 6 907.1 7 20 24 5 742.7 8 20 21 4 611.1 9 60 24 5 404.3 10 40 21 5 613.6 11 20 21 6 765.7 12 60 18 5 608.7 13 60 21 4 581.4 14 40 18 4 736.5 15 40 21 5 642.9 16 40 24 4 727.3
Silage Samples Analysis
Silage samples originating from three experimental meadows located in the Walloon Agricultural Research Center (Gembloux, Belgium) were analyzed. The first one 'P.Wiame' was predominantly composed of a mix of red clover (Trifolium pratense L.), white clover (Trifolium repens L.), and cocksfoot (Dactylis glomerata L.). The second one 'P.Class' was a classical permanent pasture constituted with a great part of ryegrass (Lolium perenne L.) and other local grasses (Poaceae sp.). Other plants were also present, such as: rumex (Rumex sp.), dandelion (Taraxacum sp.), or ribwort (Plantago sp.). The last one 'P.Dact' was constituted largely of cocksfoot. There was also the presence in low proportion of alfalfa (Medicago sativa L.), white and red clover. The meadows were mowed during summer 2013. Forages were prewilted on the field before wrapping in bale and stored until winter period. After opening, each bale was sampled, ground, freeze-dried, and stored in opaque vacuum bags at -21 °C until analysis.
Statistical Analysis
Most of the analyses were performed at least in triplicate. The Box-Behnken assays were performed only once, except for the center point and validation of the models, which were performed four and seven times,
respectively. Silage samples were analyzed in duplicate. Statistical analysis and graphics were conducted using Microsoft® Excel software (Microsoft®, Diegem, Belgium) and the JMP® 7 statistical software package (SAS institute, Cary, US). Analysis of variance (ANOVA; α = 0.05) and the comparison of averages by Tukey's HSD (α = 0.05) test were used to compare process and validation parameters.
Results and Discussion
Matrix and Isoflavones Choices to Optimize Extraction Process
The proposed method was intended to quantify, as accurately as possible and in a single analytical run, four isoflavones in forage plants. All analyses were performed on one homogeneous sample obtained by blending several ground and lyophilized plants with flaxseed meal to give a representative sample of cows feed.
Development of the LC-MS/MS Method
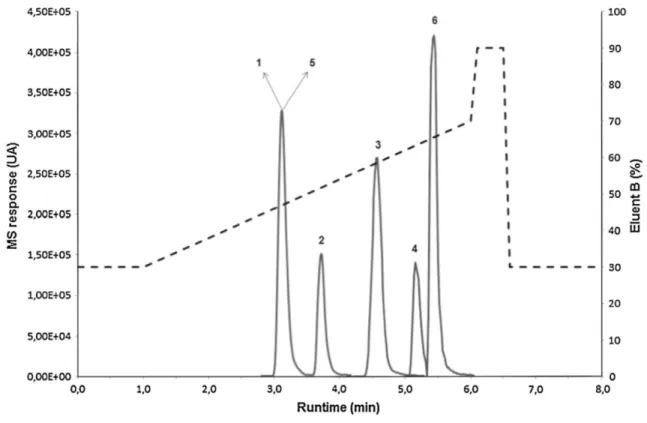
of the four isoflavones and the two ISs. The four isoflavones were eluted and reported by Vails et al. [23] for this type of stationary phase. As this figure shows, the peaks of DA and ISDaidzein_d4 had the same retention times, but
with the use of MRM, there was no difficulty in discriminating these two compounds. In addition, no interference was observed when plant extracts were injected.
The optimization of MRM conditions was achieved by infusing standard solutions of isoflavones and ISs (1 µg mL-1 in methanol) directly in the MS/MS. The positive mode was selected for each molecule, which was detected using the precursor ion and two characteristic product ions (BA 285.2 > 213, 269.1; DA 255 > 199, 137; GE 271.1 > 153, 215; FO 269.2 > 197, 237.1). The most abundant fragments were selected for quantification (Q), and the second most abundant were used for confirmation (q). The optimized parameters and ions selected are shown in Table S1.
Isoflavones are generally solubilized in methanol containing water. To optimize the dissolution, a mixture of the four isoflavone and the two ISs at 50 ng mL-1 was prepared in methanol/water ratios ranging from 10 to 100 % and injected in triplicate (Fig. S1). A 60 % aqueous methanol was chosen, because this proportion led to the best solubilization and analytical repeatability. As shown in Fig. S2, this solvent proportion was also chosen for the solubilization of isoflavone from dry residues, because this proportion led to a low and stable residual of isoflavones after reconstitution step.
Optimization of UAE
Response Surface Methodology
MeOH, EtOH, and ACN were evaluated for their efficiency in extracting isoflavones in a forage plant mix according to the conditions of Table 1. As shown in this table, the isoflavone concentrations found in the assays from the center point (four analyses for each solvent) were close to each other. Moreover, as shown in Table 3, it was found that extraction yield was influenced mainly by solvent proportion (X3).
The second-order polynomial models describing the correlation between isoflavone extraction yield and the three variables for each solvent are presented in Eqs. 2-4. The statistical significance of these equations was
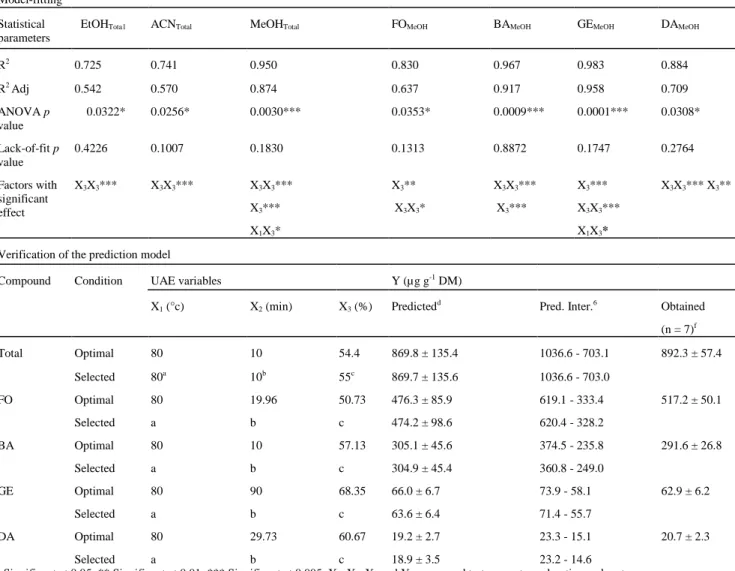
determined using the ANOVA results shown in Table 3. The ANOVA p-values indicated that the models were significant (p value <0.05) for the three solvents. The lack-of-fit tests were not significant (p values >0.05), and therefore, no lack of matching between the data and the model can be shown. The goodness of fit was checked by the coefficient of determination (R2) [24]. There is no specific rule relating to the minimum value accepted for this coefficient, but 80 % is a commonly accepted limit [25]. Lower values can be tolerated, providing that the quality of the model has been proved [26]. For UAE with MeOH, R2 was 95 %, implying that only 5 % of the total variation could not be explained by the model. The R2 values were lower for EtOH and ACN, but remained within an acceptable range. These results suggested that the models adequately represented a large part of the real relationship between the chosen factors in the range of selected values.
In Table 3, the best R2 value was found for MeOH, indicating that the model for extraction with MeOH provided a better explanation of the variations observed than the two other models. In addition, with these equations, the best extraction yield was predicted for MeOH, which was ultimately chosen for the UAE optimization.
Among the four target compounds present in the forage mix, FO and BA were the most abundant. With regard to DA and GE, only several dozen micrograms per gram dry matter were quantified. If UAE had been optimized, considering the overall isoflavones, the compounds present at the highest levels would probably have influenced the choice of extraction conditions. This situation was considered in developing the optimization protocol, and a second-order polynomial model was fitted for each compound (see Eqs. 5-8). As shown in Table 3, all ANOVA p-values were lower than 0.05, and all lack-of-fit p-values were higher than 0.05, indicating that the quality of the models has been also proved for each analyte.
As shown in Table 3, the MeOH proportion had significant linear and quadratic effects on all isoflavone extractions. The combination of these two observations allowed an optimum level for each isoflavone to be obtained for a solvent mixture containing between 50 and 70 % of MeOH. Temperature interacted significantly with MeOH concentration for GE extraction, reflecting the situation with overall isoflavone extraction. For duration, however, no effect on isoflavone extraction was found.
The lack of a significant impact of duration and temperature is likely the cause of the numerous extraction conditions found in scientific literature. The concentration range found, however, was slightly lower than that cited in the literature for forage plants (≥70 % of organic solvent) [7, 9, 17, 19, 27]. One possible explanation could be the presence of numerous conjugated forms in plant matrices, which are more polar than the aglycone forms. For other plant matrices [28, 29], this solvent composition and proportion is not uncommon and has even been recommended [14]. Increasing the water proportion in the extraction solvent helps the effective swelling of the plant matrix and increases the propagation of ultrasonic waves [30]. Nevertheless, according to Rostagno et al. [14], there should be no more than 60 % of water to prevent oxidative reactions that could reduce extraction efficiency.
Choice of Conditions and Verification of the Model
Equations 2 and 5-8 generated earlier allowed the best extraction conditions for total and individual isoflavone to be extracted (Table 3). The optimal temperature was the same for each compound. The situation, however, differed for the other two variables, and a compromise was needed. The optimal duration was very different for each individual compound. This variable, however, showed no significant impact on extraction yield (Table 3). To reduce the sample preparation time, therefore, this variable was arbitrarily set at 10 min. For the last one, the optimum concentration for each compound was obtained for solvent proportionsbetween 50.7 and 68.3 % of MeOH. The selected extraction conditions finally fixed were: temperature 80 °C; duration 10 min; and MeOH concentration 55 %. In Table 3, the predicted yield for each compound with the selected conditions is within the standard deviation of the predicted value with the optimal conditions. This finding shows that these selected conditions represent a good compromise.
To verify the predictive capacity of the model, seven extractions with the selected conditions were performed. The total isoflavone yield was 892.3 ± 57.4 µg g-1 DM, which was within the prediction interval (1036.6-703.0-µg g-1 DM). This finding was the same for each individual compound (Table 3). These data proved the validity of the models designed in this study.
The extraction efficiency was also checked by performing three consecutive extractions under the selected conditions (Fig. S3). This investigation demonstrated that according to the molecules, 85-90 % have been recovered after one extraction. This value and the good reproducibility of the measurements were judged acceptable for a single extraction.
Fig. 2 Optimized elution gradient and overlay graphs of the TIC of standard solutions of daidzein (1), genistein
(2), formononetin (3), biochanin A (4), daidzein-d4 'IS' (5), and flavone 'IS' (6). Compounds 1-5 and 6 are set at
50 ng mL-1 and 20 ng mL-1, respectively
Optimization of Hydrolysis Conditions
Choice of Enzymes
Enzymatic hydrolysis was preferred to acidic hydrolysis, because some authors have cited the problem of incomplete cleavage of conjugated forms, as well as stability problems for some compounds [6, 31]. β-Glucosidase, cellulase, and β-glucuronidase/arylsulfatase from Helix pomatia digestive juice are the enzymes commonly used to perform isoflavone hydrolysis. The combination of these three enzymes has been reported to be a more effective way for determining total isoflavone content in vegetables [20].
Before optimization with RSM, the impact of each enzyme and their concentrations on hydrolysis yield were investigated. Hydrolysis with each enzyme alone, as well as with the enzyme mix, was tested in triplicate. Three blank assays using only a buffer solution without enzymes were also undertaken. It was found that very low isoflavone content was found in the extracts without hydrolysis. These findings confirm that isoflavones are present mainly in conjugated forms in plants [1, 2, 6, 8]. In any case, each enzyme seems to play a role in the hydrolysis of conjugated isoflavones, and using the three enzymes in solution is, therefore, probably the best approach (Fig. S4). The concentration of the enzymatic suspension was also investigated. An enzymatic solution that contains ≥12, ≥24, and ≥10,200 units mL-1 of cellulase, β-glucosidase, and β-glucuronidase, respectively, was prepared. This enzymatic solution was then diluted 2, 4, and 8 times with sodium acetate buffer solution (pH = 5). All tests werecarried out in triplicate. It was found that enzyme mix concentration had no impact on the hydrolysis yield of DA and BA. For GE and FO, however, the stock solution and the one diluted twice had a better hydrolysis yield than the other two dilute solutions (Fig. S5). In this study, the enzymatic solution with ≥6, ≥12, and ≥5100 units mL-1 of cellulase, β-glucosidase, and β-glucuronidase, respectively, was finally selected.
One disadvantage of using Helix pomatia digestive juice is that it usually contains appreciable levels of some iso-flavones that can affect quantification [21, 32]. The iso-flavone concentrations found in crude solution, however, appear to fluctuate over time. For this reason, blank samples were made for each experiment to correct the concentration found by subtracting the isoflavone amount in the hydrolysis reagent from the amount quantified in each sample. When the extract was diluted by a factor of minimum 10 in the post-hydrolysis steps, however, the three isofla-vones were present as traces, and there was no difficulty in quantification.
Response Surface Methodology
using RSM. The results of the experimental design are given in Table 4. The second-order polynomial models for the total amount of isoflavones and for each individual compound are given in Eqs. 9-13, and their statistical significances are given in Table 4.
All the ANOVA p-values indicated that the models were significant (p value <0.05). The lack-of-fit tests were not significant (p values >0.05), and therefore, no lack of matching between the data and the model can be shown. All the R2 values were higher than 80 %, except for DA, which had R2 of 78 %. All the models, therefore, proved to be suitable for an adequate representation of the relationship between the selected variables and isoflavone yield after hydrolysis. As shown in Table 4, all the variables interacted significantly, but in different way, depending on the compound. Nevertheless, temperature (X1) was the most significant parameter and
showed significant linear and/or quadratic effects (p value <0.05) on the hydrolysis of all isoflavones. An optimum below the middle of the selected temperature range was found for each analyte. Temperature also interacted significantly with pH (X3) for DA. Duration (X2) had a significant quadratic effect only on BA
hydrolysis, which reflects overall isoflavone hydrolysis, and a linear effect on GE hydrolysis. The last variable, pH (X3), had a significant linear impact only on GE hydrolysis.
The optimal temperatures were quite far below the temperature of 37 °C cited in other studies [20, 21, 33] and used by the suppliers for estimating the activity of their enzymes. This finding is not unusual, though Steinshamn et al. [34] performed hydrolysis with a cellulase at ambient temperature. In other studies, hydrolysis duration has usually been reported to be a minimum of 16 h [20, 21, 34], with the exception of Andersen's et al. [33] work, whose hydrolysis protocol with β-glucuronidase lasted only 1 h. The results suggest that overnight (16-20 h) hydrolysis is appropriate. Even if the last variable seems to have lower impact than the other two, pH = 6 was defined as the optimal value for all tested compounds. This optimum pH was one unit above the value usually used in other studies [20, 21, 34] and by enzyme suppliers.
Choice of Conditions and Verification of the Model
The best hydrolysis conditions for total and individual isoflavones were determined in the same way as before. As shown in Table 4, pH was the same for each compound. For the two other variables, the best conditions differed among individual compounds, and a compromise, therefore, had to be found. The optimal working conditions were finally fixed as follows: temperature of 20 °C for 18h at pH = 6. The predicted yield for each compound with the selected conditions was within the standard deviation of the predicted value with the optimal conditions. This finding shows that these selected conditions represent a good compromise.
To verify the predictive capacity of the model, seven extractions under the selected conditions were also performed. The total isoflavone yield was 827.8 ± 25.3 µg g-1 DM, which was within the prediction interval (1084.5-716.5-µg g-1 DM). This was also true for each individual compound (Table 4). These data proved that the models designed for this hydrolysis optimization were valid.
Method Validation
Two internal standards: daidzein-d4 for daidzein and fla-vone for the other three analytes, were used for
quantification. No trace of flavone was found neither in the plant mix nor in the enzymatic solution. The validation parameters of the analytical method were first checked to ensure reliable responses from UPLC® -MS/MS, after which the validation of the complete method was undertaken by checking recoveries, ME, repeatability, robustness, and stability of hydro-lyzed methanol extracts under two storage conditions. The specificity of the detection of each compound was characterized by its retention time (RT) and by two precursor-product ion transitions. The RT and Q/q ratios are shown in Table 5. These two parameters were observed throughout the development and validation process. The relative retention time (RRT) for each analyte was always included in the RRT tolerance range of ±2.5 %, and the q/Q ratio was also always included in a tolerance range of ±20 % [35, 36].
The calibration curves were established by injecting six replicates of each isoflavone standard solution with IS s (50 ng mL-1 for daidzein-d4 and 20 ng mL-1 for flavone) at concentrations ranging from 5 to 125 ng mL-1 for all
target isoflavones. This range was judged satisfactory given the isoflavones that can be found in forages. To validate these calibration curves, several linearity criteria needed to be met: a minimum of five concentration points per curve; the relative standard deviation (RSD) for each point not to exceed 20 % for points near LOQ or 15 % for others [22]; and a correlation coefficient (R2) equal to or higher than 0.99 [37]. In addition, an ANOVA with lack-of-fit test was used to confirm if the least squares linear regression model between the Aa/Ais ratio and
concentration was adequate for describing the observed data (α = 0.05) [38].
The LOD and LOQ were determined as the concentration at a signal to noise (S/N) of 3 and 10, respectively [37]. The S/N of each compound was calculated in a blank matrix spiked with isoflavones at concentrations near the lower calibration concentration (LCC) (n = 5). None of the forage samples, however, was free of the four target analytes. Flaxseed was, therefore, used to evaluate limits of these four isoflavones. The results are shown in Table 5. The LOQ values were 0.50, 0.50, 0.53, and 4.46 ng mL-1 for DA, BA, FO, and GE, respectively. These values were experimentally confirmed by analyzing other flaxseed samples spiked with the target analytes at concentrations equal to or slightly higher (<20 %) than calculated limits (n = 6)[39]. It was found that the variation in the peak area did not exceed 20 %. The LOQs calculated were lower than the LCCs. Therefore, even if these LOQs were estimated only in flaxseed samples, LCCs set at 5 ng ml-1 would be considered satisfactory. Intra-day (five injections within 1 day) precision (expressed as RSD %) and accuracy (expressed as bias %) at four concentrations (15, 30, 50, and 80 ng mL-1) were determined. Inter-day (five injections over 3 days) precision and accuracy were also evaluated for the same standard concentrations (Table S2). The intra- and inter-day RSD values did not exceed the maximum allowed value of 20 % for the points close to LOQ or 15 % for the other ones [22, 40]. The maximum values for BA were at 15 ng mL-1 with 8.2 and 7.6 % for intra- and inter-day, respectively. For accuracy, the maximum bias between the measured and assigned values for intra- and inter-assay was observed for BA at 30 ng mL-1. The two values (11.4 and 7.1 %) were lower than the allowed value of 15 % [22, 40]. These observations indicated that the UPLC®-MS/MS method used had an acceptable level of precision and accuracy.
To check the carryover, 10 µL of H2O: methanol (40:60, v/v) was injected after the injection of three
high-standard concentration solutions containing the four analytes (250 ng mL-1) and ISs (50 and 100 ng mL-1 for flavone and daidzein-d4 respectively). No signals with S/N >3 were observed at the RT of each analyte or the
ISs.
The ME was studied for each molecule by comparing the slopes of the calibration curves obtained after adding appropriate calibration standard solutions in flaxseed dry residues with the slopes calculated from the same standard solutions in H2O:methanol (40:60, v/v) [39]. To avoid the occurrence of the four target analytes in the
dry residues, flaxseed extract was used. Three kinds of curves were prepared: one in MeOH 60 % (external calibration in solvent taken as reference); one with no dilution of hydrolyzed extract before the evaporation step; and one with a dilution factor of 10. Each curve was achieved with five points in triplicate, and the mean slopes were calculated and compared. During pretests, an important ion enhancement was found for DA (data not shown). This was clearly linked to the enzymatic solution. To avoid this important matrix effect for DA, the use of the deuterated form of daidzein was selected. The percentage difference 'ME (±%)' between the slope of the calibration curve obtained by adding standard solutions in dry residues and the one arising from H2O:methanol
(40:60, v/v) is shown in Table 5. Ion enhancement and suppression were both observed, depending on the analyte, but in an acceptable range (±20 %) [18]. Ion enhancement was observed for FO and GE with an ME just at the limit of the acceptable range for the last one in the undiluted extract. Between the undiluted and diluted extracts, the ME of DA increased from a negative value to a slightly positive value, always considered negligible. For BA, ion suppression was observed in both cases, also with a ME value just at the limit of acceptable range for the undiluted extract. In general, a decrease in ME was observed between the undiluted and
ten times diluted extract. This finding leads us to recommend a dilution of the extract between the hydrolysis step and LC-MS/MS analysis. With the mix of forage plants used for this optimization process, dilution by a factor of 10 for DA and GE and more for the other two was necessary to put the signals in the range of calibration. The calibration curve in H2O:methanol (40:60, v/v) was, therefore, used for measuring the target
analytes in the forage samples.
In the absence of certified reference materials, the recovery was evaluated by comparing the concentration found in spiked samples and the expected concentration. For the same reason as previously mentioned, flaxseed was used to calculate the percentage recovery. Samples were spiked with the appropriate amounts of standard solutions to obtain final concentrations of 25, 50, and 75 ng mL-1 (considering dilution by a factor of 10 after the enzymatic hydrolysis step). The analysis was carried out in triplicate. As shown in Table 5, values for three of the four target analytes fell within the acceptable range 70-120 % [40, 41]. For each analyte, the recovery value was fairly similar, whatever the concentration level added. BA showed alower recovery (mean recovery of 51 ± 5.6 %). Nevertheless, the reproducibility over all levels was satisfactory. The low recovery for BA can be outweighed using a correction factor to get closer to the actual BA content in the sample.
Table 3 Model-fitting results for UAE optimization with the three solvents and each isoflavone for MeOH are
presented in the upper part of the table. Isoflavone content predicted and obtained under optimal and selected UAE conditions are presented in the lower part of the table
Model-fitting Statistical parameters
EtOHTota1 ACNTotal MeOHTotal FOMeOH BAMeOH GEMeOH DAMeOH
R2 0.725 0.741 0.950 0.830 0.967 0.983 0.884 R2 Adj 0.542 0.570 0.874 0.637 0.917 0.958 0.709 ANOVA p value 0.0322* 0.0256* 0.0030*** 0.0353* 0.0009*** 0.0001*** 0.0308* Lack-of-fit p value 0.4226 0.1007 0.1830 0.1313 0.8872 0.1747 0.2764 Factors with significant effect X3X3*** X3X3*** X3X3*** X3*** X1X3* X3** X3X3* X3X3*** X3*** X3*** X3X3*** X1X3* X3X3*** X3**
Verification of the prediction model
Compound Condition UAE variables Y (µg g-1 DM)
X1 (°c) X2 (min) X3 (%) Predictedd Pred. Inter.6 Obtained
(n = 7)f Total Optimal 80 10 54.4 869.8 ± 135.4 1036.6 - 703.1 892.3 ± 57.4 Selected 80a 10b 55c 869.7 ± 135.6 1036.6 - 703.0 FO Optimal 80 19.96 50.73 476.3 ± 85.9 619.1 - 333.4 517.2 ± 50.1 Selected a b c 474.2 ± 98.6 620.4 - 328.2 BA Optimal 80 10 57.13 305.1 ± 45.6 374.5 - 235.8 291.6 ± 26.8 Selected a b c 304.9 ± 45.4 360.8 - 249.0 GE Optimal 80 90 68.35 66.0 ± 6.7 73.9 - 58.1 62.9 ± 6.2 Selected a b c 63.6 ± 6.4 71.4 - 55.7 DA Optimal 80 29.73 60.67 19.2 ± 2.7 23.3 - 15.1 20.7 ± 2.3 Selected a b c 18.9 ± 3.5 23.2 - 14.6
* Significant at 0.05, ** Significant at 0.01, *** Significant at 0.005. X1, X2, X3 and Y correspond to temperature, duration, solvent concentration and isoflavone yield, respectively
a Selected temperature b Selected duration c Selected solvent proportion d
Predicted content ± half confidence interval (α = 0.05) e Prediction interval of 95 %
Table 4 Model-fitting results for enzymatic hydrolysis optimization are presented in the upper part of the table.
Isoflavone content predicted and obtained under optimal and selected hydrolysis conditions are presented in the lower part of the table
Model-fitting
Statistical parameters Isoflavone total FO BA GE DA
R2 0.908 0.885 0.892 0.938 0.785
R2Adj 0.770 0.714 0.729 0.845 0.598
ANOVA p value 0.0162* 0.0295* 0.0254* 0.0054** 0.0311*
Lack-of-fit p value 0.1058 0.1636 0.1724 0.5330 0.0851
Factors with significant effect X1X1**
X1** X2X2* X1X1** X1* X1*** X2X2* X1X1* X1*** X1X1* X3* X2* X1** X1X3*
Verification of the prediction model
Compound Condition Enzymatic hydrolysis variables Y (µg g-1 DM)
X1 (°c) X2(h) X3(U pH) Predictedd Pred. Inter.e Obtained
(n = 7)f Total Optimal 21.6 24 6 940.7 ± 182.6 1123.3 - 758.1 827.8 ± 25.3 Selected 20a 18b 6c 900.5 ± 191.9 1084.5 - 716.5 FO Optimal 32.1 18 6 613.8 ± 99.2 732.2 - 495.6 523.1 ± 32.6 Selected a b c 582.7 ± 128.9 706.3 - 459.1 BA Optimal 20.0 24 6 246.8 ± 66.7 310.7 - 182.8 217.8 ± 11.1 Selected a b c 209.0 ± 66.7 272.9 - 145.1 GE Optimal 25.3 18 6 90.6 ± 14.4 106.2 - 75.0 70.7 ± 3.8 Selected a b c 90.0 ± 16.7 106.0 - 73.9 DA Optimal 20 18 6 19.0 ± 2.2 21.5 - 16.5 16.2 ± 0.8 Selected a b c 19.0 ± 2.2 21.5 - 16.5
* Significant at 0.05, ** Significant at 0.01, *** Significant at 0.005. X1, X2, X3 and Y correspond to temperature, duration, pH and isoflavone yield, respectively
a Selected temperature b Selected duration c Selected pH
d Predicted content ± half confidence interval (α = 0.05) e Prediction interval of 95 %
f Mean value ± standard deviation
The intrinsic variability of the complete sample work-up (extraction, hydrolysis, and UPLC®-MS/MS analysis) was assessed by performing a multiple independent analysis of two plant sample mixes (n = 9, within 3 days and by two analysts). The RSDs for the quantified amounts are given in Table 5, and the repeatability of the whole analytical procedure was considered satisfactory for each isoflavone (RSD ≤20 %) [40]. The maximum RSD was found for GE (present only in sample 1), with 18.8 %. The repeatabilityof all the analytical protocol was judged to be satisfactory for estimating the isoflavone content of different types of forage.
The stability of sample extracts during storage was also investigated. Extract from sample 1 analyzed on the first day of repeatability check was stored in two vials, one at -20 ± 1 °C and the other at 6 ± 1 °C. The sample extracts were reanalyzed in triplicate after 6 days of storage. No significant difference was found with the Tukey's HSD test between the isoflavone content found in the first analysis and after 6 days. There was, therefore, no isoflavone degradation in the methanolic extracts stored at -21 and 6 °C for at least 6 days. Robustness of the extraction step was checked by modifying the ultrasound power. The extractions were performed in triplicate with two levels of power (750 and 550 W). The Tukey's HSD test revealed no significant difference between extraction yields obtained with the two ultrasound power levels (Table 5).
quantify the target compounds in forage samples with accurate sensitivity.
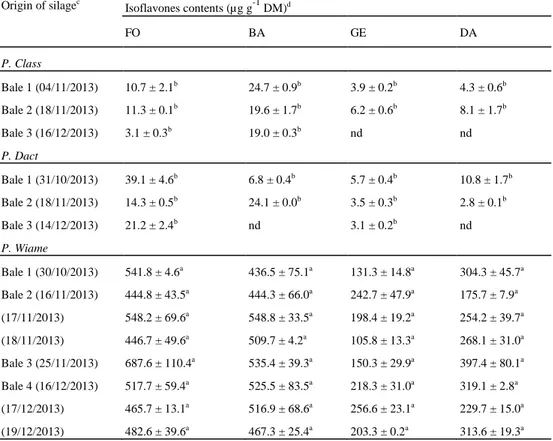
Use of the Method in an Experimental Setting
The method was used to determine the four isoflavones present in silages used in an experimental study intended to assess the impact of high isoflavones diets on cow's milk quality (unpublished data). As shown in Table 6, there are great differences between isoflavones found in the silages originating from the three meadows. P. Class and P. Dact have low and similar isoflavones contents compared with P. Wiame, which has contents above 100-µg g-1 DM for all target compounds. In P. Wiame, the minimum content was found for GE (105.8 ± 13.3 µg g-1 DM), and the maximumwas found for FO (687.6 ± 110.4 µg g-1 DM). This finding is correlated with the presence of red clover (Trifolium pratense L.) in silages from P. Wiame, known for its high isoflavone contents, especially, FO and BA [1, 8, 9, 33]. For the same type of silage, the isoflavones contents found in each bale were rather similar, except for low contents (P. Class and P. Dact) where some compound were sometime not
detected. This suggests that isoflavones are stable and does not undergo transformation during silage storage period. A forage bale can be used several days to feed animals, so with two bales originating from P. Wiame, three sampling were realized over a 3 days period. The concentrations found remained similar for all isoflavones. The oxygen and light supplies with the opening of the bale also do not seem to affect the concentration of isoflavones in the forage. These exploratory analyses clearly confirm that grassland management affects the isoflavones contents present in silage. All the interpretations and assumptions above, however, must be confirmed by further studies. Even if isoflavones content seems to be stable during the silage storage period, it would be useful to investigate their evolution over a longer period from a well-characterized sample and under controlled conditions.
Conclusions
This study proposes a reliable and sensitive analytical method for simultaneous quantification of daidzein, gen-istein, formononetin, and biochanin A in forages grazed by ruminants. It is based on aglycones released by methanolic UAE, followed by enzymatic hydrolysis and UPLC®-MS/ MS analysis. The application of RSM enabled both the enzymatic hydrolysis and the extraction process to be optimized. The impact of several factors on the extraction and hydrolysis yield of four isoflavones was discussed, and a compromise in the conditions of application of these two processes was proposed. This analytical method was validated, following international recommendations, and is well suited to routine analysis. It can be used, among other things, to evaluate the modification of isoflavone content in forage silages.
Acknowledgments The authors wish to thank the Public Service of Wallonia (PhytoHealth project, Moerman
funds) for providing financial assistance during the course of this research. They wish to thank Christophe Jasselette for his involvement in the development and validation of this analytical method. They also wish to thank all the people at CRA-W who participated, directly or indirectly, in the development of this method and the members of GrassMilk project for the collection of the samples.
Compliance with Ethical Standards Conflict of interest
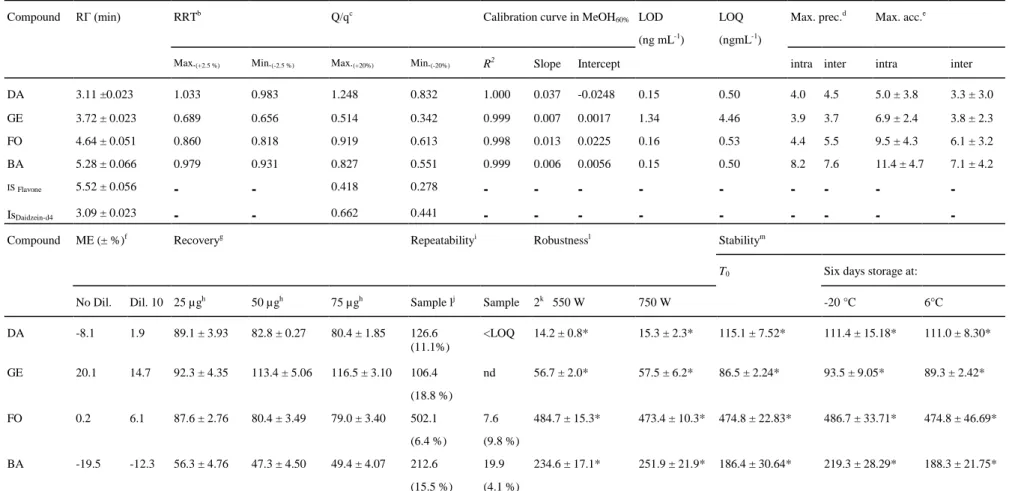
Table 5 Validation parameters of the analytical method: retention time 'RT'; relative retention time 'RRT'; Q/q ratio; correlation coefficient 'R2', slope and intercept of calibration curves in MeOH60%; LOD and LOQ calculated for the four target analytes; and maximum values for intra-/inter-assay precision (Max. prec.) and accuracy (Max.
acc); are presented in the upper part of the table. Validation parameters for the complete method: matrix effect 'ME', recovery, repeatability, robustness and stability; are presented in the lower part of the table
Compound RΓ (min) RRTb Q/qc Calibration curve in MeOH
60% LOD
(ng mL-1)
LOQ (ngmL-1)
Max. prec.d Max. acc.e
Max.(+2.5 %) Min.(-2.5 %) Max.(+20%) Min.(-20%) R2 Slope Intercept
intra inter intra inter
DA 3.11 ±0.023 1.033 0.983 1.248 0.832 1.000 0.037 -0.0248 0.15 0.50 4.0 4.5 5.0 ± 3.8 3.3 ± 3.0 GE 3.72 ± 0.023 0.689 0.656 0.514 0.342 0.999 0.007 0.0017 1.34 4.46 3.9 3.7 6.9 ± 2.4 3.8 ± 2.3 FO 4.64 ± 0.051 0.860 0.818 0.919 0.613 0.998 0.013 0.0225 0.16 0.53 4.4 5.5 9.5 ± 4.3 6.1 ± 3.2 BA 5.28 ± 0.066 0.979 0.931 0.827 0.551 0.999 0.006 0.0056 0.15 0.50 8.2 7.6 11.4 ± 4.7 7.1 ± 4.2 IS Flavone 5.52 ± 0.056 - - 0.418 0.278 - - - - - - - - -IsDaidzein-d4 3.09 ± 0.023 - - 0.662 0.441 - - - - - - - -
-Compound ME (± %)f Recoveryg Repeatabilityi Robustnessl Stabilitym
T0 Six days storage at:
No Dil. Dil. 10 25 µgh 50 µgh 75 µgh Sample lj Sample 2k 550 W 750 W -20 °C 6°C
DA -8.1 1.9 89.1 ± 3.93 82.8 ± 0.27 80.4 ± 1.85 126.6 (11.1%) <LOQ 14.2 ± 0.8* 15.3 ± 2.3* 115.1 ± 7.52* 111.4 ± 15.18* 111.0 ± 8.30* GE 20.1 14.7 92.3 ± 4.35 113.4 ± 5.06 116.5 ± 3.10 106.4 (18.8 %) nd 56.7 ± 2.0* 57.5 ± 6.2* 86.5 ± 2.24* 93.5 ± 9.05* 89.3 ± 2.42* FO 0.2 6.1 87.6 ± 2.76 80.4 ± 3.49 79.0 ± 3.40 502.1 (6.4 %) 7.6 (9.8 %) 484.7 ± 15.3* 473.4 ± 10.3* 474.8 ± 22.83* 486.7 ± 33.71* 474.8 ± 46.69* BA -19.5 -12.3 56.3 ± 4.76 47.3 ± 4.50 49.4 ± 4.07 212.6 (15.5 %) 19.9 (4.1 %) 234.6 ± 17.1* 251.9 ± 21.9* 186.4 ± 30.64* 219.3 ± 28.29* 188.3 ± 21.75*
Values marked by '*' are not significantly different with the Tukey's HSD test (p value > 0.05). LOQ for DA was 1.6 µg g-1 DM a n ≥ 180 injections of standard solutions and samples over 2 months b RRT = RT
analyte/RTIS c
Q/q = Signal2/Signal1
d Precision is expressed in RSD % e Accuracy is expressed in biais %
h Amount added by different volumes of analyte solution
i Expressed in µg g-1 DM (RSD%, n=9 on 3 days) and nd = no detected j Silage with a large proportion of Leguminosae and mixed with flaxseed meal k Silage with a large proportion of grasses
1 Expressed in µg g-1 DM (mean ± SD, n = 3)
m
Expressed in µg g-1 DM (mean ± SD, n = 3)
Table 6 FO, BA, GE and DA (µg g-1 DM) present in silage samples originating from experimental meadows
Origin of silagec Isoflavones contents (µg g-1 DM)d FO BA GE DA P. Class Bale 1 (04/11/2013) 10.7 ± 2.1b 24.7 ± 0.9b 3.9 ± 0.2b 4.3 ± 0.6b Bale 2 (18/11/2013) 11.3 ± 0.1b 19.6 ± 1.7b 6.2 ± 0.6b 8.1 ± 1.7b Bale 3 (16/12/2013) 3.1 ± 0.3b 19.0 ± 0.3b nd nd P. Dact Bale 1 (31/10/2013) 39.1 ± 4.6b 6.8 ± 0.4b 5.7 ± 0.4b 10.8 ± 1.7b Bale 2 (18/11/2013) 14.3 ± 0.5b 24.1 ± 0.0b 3.5 ± 0.3b 2.8 ± 0.1b Bale 3 (14/12/2013) 21.2 ± 2.4b nd 3.1 ± 0.2b nd P. Wiame Bale 1 (30/10/2013) 541.8 ± 4.6a 436.5 ± 75.1a 131.3 ± 14.8a 304.3 ± 45.7a Bale 2 (16/11/2013) 444.8 ± 43.5a 444.3 ± 66.0a 242.7 ± 47.9a 175.7 ± 7.9a (17/11/2013) 548.2 ± 69.6a 548.8 ± 33.5a 198.4 ± 19.2a 254.2 ± 39.7a (18/11/2013) 446.7 ± 49.6a 509.7 ± 4.2a 105.8 ± 13.3a 268.1 ± 31.0a Bale 3 (25/11/2013) 687.6 ± 110.4a 535.4 ± 39.3a 150.3 ± 29.9a 397.4 ± 80.1a Bale 4 (16/12/2013) 517.7 ± 59.4a 525.5 ± 83.5a 218.3 ± 31.0a 319.1 ± 2.8a (17/12/2013) 465.7 ± 13.1a 516.9 ± 68.6a 256.6 ± 23.1a 229.7 ± 15.0a (19/12/2013) 482.6 ± 39.6a 467.3 ± 25.4a 203.3 ± 0.2a 313.6 ± 19.3a
Values marked with the same letter are not significantly different with the Tukey's HSD test (p value > 0.05) c The dates in brackets correspond to the sampling dates
References
1. Mostrom M, Evans TJ (2012) In: Gupta Ramesh C (ed) Veterinary toxicology—basic and clinical principles, 2nd edn. Elsevier, London 2. Vitale DC, Piazza C, Melilli B, Drago F, Salomone S (2013) Isoflavones: estrogenic activity, biological effect and bioavailability. Eur J Drug Metab Pharmacokinet 38:15-25
3. Ko KP (2014) Isoflavones: Chemistry, analysis, functions and effects on health and cancer. Asian Pac J Cancer Prev 15(17):7001-7010 4. Sirotkin AV, Harrath AH (2014) Phytoestrogens and their effects. Eur J Pharmacol 741:230-236
5. Patisaul HB, Jefferson W (2010) The pros and cons of phytoestrogens. Front Neuroendocrin 31:400-4119
6. Rostagno MA, Villares A, Guillamón E, García-Lafuente A, Martínez JA (2009) Sample preparation for analysis of isoflavones from soybeans and soy foods. J Chromatogr A 1216(l):2-29
7. Wu Q, Wang M, Simon JE (2004) Analytical methods to determine phytoestrogenic compounds. J Chromatogr B 812:325-355 8. Saviranta NMM, Julkunen-Tiitto R, Oksanen E, Karjalainen RO (2010) Leaf phenolic compounds in red clover (Trifolium prat-ense L.) induced by exposure to moderately elevated ozone. Environ Pollut 158:440-446
9. Tsao R, Papadopoulos Y, Yang R, Young JC, McRae K (2006) Isoflavone profiles of red clovers and their distribution in different parts harvested at different growing stages. J Agric Food Chem 54:5797-5805
10. Vacek J, Klejdus B, Lojková L, Kuban V (2008) Current trends in isolation, separation, determination and identification of isoflavones: a review. J Sep Sci 31:2054-2067
11. Grynkiewicz G, Ksycinska H, Ramza J, Zagrodzka J (2005) Chromatographic quantification of isoflavones (why and how). J Acta Chromatogr 15:31-65
12. Wang CC, Prasain JK, Barnes S (2002) Review of the methods used in the determination of phytoestrogens. J Chromatogr B 777:3-28 13. Stalikas CD (2007) Extraction, separation, and detection methods for phenolic acids and flavonoids. J Sep Sci 30:3268-3295 14. Rostagno MA, Palma M, Barroso CG (2003) Ultrasound-assisted extraction of soy isoflavones. J Chromatogr A 1012(2): 119-128 15. Daems F, Jasselette C, Romnee JM, Planchon V, Lognay G, Froidmont É (2015) Validating the use of an ultra-performance liquid chromatography with tandem mass spectrometry method to quantify equol in cow's milk. Dairy Sci Technol 95(3):303-319
16. Daems F, Romnee JM, Heuskin S, Froidmont É, Lognay G (2016) Analytical methods used to quantify isoflavones in cow's milk: a review. Dairy Sci Technol 1-23. doi:10.1007/ S13594-015-0276-8
17. Hoerger CC, Praplan AP, Becker L, Wettstein FE, Hungerbüh-ler K, Bucheli TD (2011) Quantification of five isoflavones and coumestrol in various solid agroenvironmental matrices using 13C
3-labeled internal standards. J Agric Food Chem 59:847-856
18. Ferrer C, Lozano A, Agüera A, Girón AJ, Fernandez-Alba AE (2011) Overcoming matrix effects using the dilution approach in multiresidue methods for fruits and vegetables. J Chromatogr A 1218:7634-7639
19. Reynaud A, Fraisse D, Cornu A, Farruggia A, Pujos-Guillot E, Besle JM, Martin B, Lamaison JL, Paquet D, Doreau M, Graulet B (2010) Variation in content and composition of phenolic compounds in permanent pastures according to botanical variation. J Agric Food Chem 58:5485-5494
20. Konar N, Poyrazoǧlu ES, Demir K, Artik N (2012) Effect of different sample preparation methods on isoflavone, lignan, coume-stan and flavonoid contents of various vegetables determined by triple quadrupole LC-M/MS. J Food Compos Anal 26:26-35
21. Kuhnle GGC, Dell'Aquila C, Low YL, Kussmaul M, Bingham SA (2007) Extraction and quantification of phytoestrogens in foods using automated solid-phase extraction and LC/MS/MS. Anal Chem 79:9234-9239
22. EMA (2015) VICH GL49: Studies to evaluate the metabolism and residue kinetics of veterinary drugs in food-producing animals: Validation of analytical methods used in residue depletion studies. http://www.ema.europa.eu/docs/en_GB/document_hbrary/ Scientific_guideline/2011/04/WC500105053.pdf. Accessed February 2015
23. Valls J, Millán S, Martí MP, Borràs E, Arola L (2009) Advanced separation methods of food anthocyanins, isoflavones and fla-vanols. J Chromatogr A 1216:7143-7172
24. Zou Y, Xie C, Fan G, Gu Z, Han Y (2010) Optimization of ultrasound-assisted extraction of melanin from Auricularia auricular fruit bodies. Innov Food Sci Emerg Technol 11:611-615
25. Joglekar AM, May AT (1987) Product excellence through design of experiments. Cereal Foods World 32:857-868
26. Malcolmson LJ, Matsuo RR, Balshaw R (1993) Textural optimization of spaghetti using response surface methodology: Effects of drying temperature and durum protein level. Cereal Chem 70:417-423
27. Zgórka G (2009) Ultrasound-assisted solid-phase extraction coupled with photodiode-array and fluorescence detection for chem-otaxonomy of isoflavone phytoestrogens in Trifolium L. (clover) species. J Sep Sci 32:965-972
28. Kiss B, Popa DS, Hanganu D, Pop A, Loghin F (2010) Ultra-performance liquid chromatography method for the quantification of some phytoestrogens in plant material. Rev Roum Chim 55(8):459-465
29. Niranjan A, Pandey A, Misra P, Trivedi PK, Lehri A, Amla DV (2011) Development and optimization of HPLC-PDA-MS-MS method for simultaneous quantification of three classes of flavo-noids in legume seeds, vegetables, fruits, and medicinal plants. J Liq Chromatogr RT 34:1729-1742
31. Schwartz H, Sontag G, Plumb J (2009) Inventory of phytoestrogen databases. Food Chem 113:736-747
32. Alves RC, Almeida IMC, Casal S, Oliveira MBPP (2010) Method development and validation for isoflavones quantification in coffee. Food Chem 122:914-919
33. Andersen C, Nielsen TS, Pump S, Kristensen T, Eriksen J, Søegaard K, Sørensen J, Fretté XC (2009) Phyto-oestrogens in herbage and milk from cows grazing white clover, red clover. Lucerne or chicory-rich pastures. Animal 3(8):1189-1195
34. Steinshamn H, Purup S, Thuen E, Hansen-M0∏er J (2008) Effects of clover-grass silages and concentrate supplementation on the content of phytoestrogens in dairy cow milk. J Dairy Sci 91:2715-2725
35. Moreno-González D, Huertas-Pérez JF, García-Campaña AM, Bosque-Sendra JM, Gámiz-Gracia L (2013) Ultrasound-assisted surfactant-enhanced emulsification microextraction for the determination of carbamates in wines by ultra-high performance liquid chromatography-tandem mass spectrometry. J Chromatogr A 1315:1-7
36. Antignac JP, Cariou R, Le Bizec B, Cravedi JP, Andre F (2003) Identification of phytoestrogens in bovine milk using liquid chromatography/electrospray tandem mass spectrometry. Rapid Commun Mass Spectrom 17:1256-1264
37. Fiechter G, Opacak I, Raba B, Mayer HK (2013) A new ultrahigh pressure liquid chromatography method for the determination of total isoflavone aglycones after enzymatic hydrolysis: Application to analyze isoflavone levels in soybean cultivars. Food Res Int 50:586-592 38. De Bock L, Boussery K, Colin P, De Smet J, T'Jollyn H, Van Bocxlaer J (2012) Development and validation of a fast and sensitive UPLC-MS/MS method for the quantification of six probe metabolites for the in vitro determination of cytochrome P450 activity. Talanta 89:209-216
39. Salomone A, Gerace E, Brizio P, Gennaro MC, Vincenti M (2011) A fast liquid chromatography-tandem mass spectrometry method for determining benzodiazepines and analogues in urine. Validation and application to real cases of forensic interest. J Pharmaceut Biomed 56:582-591
40. Ellis RL (2008) Development of veterinary drug residue controls by the Codex Alimentarius Commission: a review. Food Addit Contam 25(12): 1432-1438
41. Delgado-Zamarreño MM, Pérez-Martín L, Bustamante-Rangel M, Carabias-Martínez R (2012) A modified QuEChERS method as sample treatment before the determination of isoflavones in foods by ultra-performance liquid chromatography-triple quad-rupole mass spectrometry. Talanta 100:320-328