HAL Id: hal-01837421
https://hal.archives-ouvertes.fr/hal-01837421
Submitted on 28 May 2020
HAL is a multi-disciplinary open access
archive for the deposit and dissemination of sci-entific research documents, whether they are pub-lished or not. The documents may come from teaching and research institutions in France or abroad, or from public or private research centers.
L’archive ouverte pluridisciplinaire HAL, est destinée au dépôt et à la diffusion de documents scientifiques de niveau recherche, publiés ou non, émanant des établissements d’enseignement et de recherche français ou étrangers, des laboratoires publics ou privés.
S.P. Galindez-Najera, P. Choomjaihan, Cecile Barron, Valerie Lullien-Pellerin,
G.M. Campbell
To cite this version:
S.P. Galindez-Najera, P. Choomjaihan, Cecile Barron, Valerie Lullien-Pellerin, G.M. Campbell. A compositional breakage equation for wheat milling. Journal of Food Engineering, Elsevier, 2016, 182, pp.46-64. �10.1016/j.jfoodeng.2016.03.001�. �hal-01837421�
Version postprint
A compositional breakage equation for wheat milling
S.P. Galindez-Najera, P. Choomjaihan, C. Barron, V. Lullien-Pellerin, G.M. Campbell PII: S0260-8774(16)30060-7
DOI: 10.1016/j.jfoodeng.2016.03.001
Reference: JFOE 8499
To appear in: Journal of Food Engineering Received Date: 16 November 2015
Revised Date: 1 March 2016 Accepted Date: 2 March 2016
Please cite this article as: Galindez-Najera, S., Choomjaihan, P, Barron, C, Lullien-Pellerin, V, Campbell, G., A compositional breakage equation for wheat milling, Journal of Food Engineering (2016), doi: 10.1016/j.jfoodeng.2016.03.001.
This is a PDF file of an unedited manuscript that has been accepted for publication. As a service to our customers we are providing this early version of the manuscript. The manuscript will undergo copyediting, typesetting, and review of the resulting proof before it is published in its final form. Please note that during the production process errors may be discovered which could affect the content, and all legal disclaimers that apply to the journal pertain.
Version postprint
M
AN
US
CR
IP
T
AC
CE
PT
ED
A compositional breakage equation for wheat milling
1 2
Galindez-Najera SP1, Choomjaihan P2, Barron C3, Lullien-Pellerin V3 and Campbell GM1,4*
3 4
1. Satake Centre for Grain Process Engineering, School of Chemical Engineering and
5
Analytical Science, The University of Manchester, Oxford Rd, Manchester, M13 9PL, UK
6
2. Curriculum of Agricultural Engineering, Department of Mechanical Engineering, Faculty
7
of Engineering, King Mongkut’s Institute of Technology Ladkrabang, Bangkok, 10520,
8
Thailand
9
3. UMR 1208 Ingénierie des Agropolymères et Technologies Emergentes, INRA, UMII,
10
Cirad, Montpellier Supagro 2, Place P. Viala, bâtiment 31, 34060 Montpellier Cedex 2,
11
France
12
4. Current address: School of Applied Sciences, University of Huddersfield, Queensgate,
13
Huddersfield, HD1 3DH, UK
14
* corresponding author: [email protected]
15 16
Abstract
17
The compositional breakage equation is derived, in which the distributions of botanical
18
components following milling of wheat are defined in terms of compositional breakage
19
functions and concentration functions. The forms of the underlying functions are determined
20
using experimental data for Outer Pericarp, Intermediate Layer, Aleurone and Starchy
21
Endosperm generated from spectroscopic analysis of milled fractions of a hard and a soft
22
wheat milled under Sharp-to-Sharp (S-S) and Dull-to-Dull (D-D) dispositions. For the hard
23
Mallacca wheat, the Outer Pericarp, Intermediate Layer and Aleurone compositions mostly
24
varied with particle size in similar ways, consistent with these layers fusing together as
25
“bran” and breaking together, although with possibly a subtle difference around the
26
production of very fine particles under D-D milling. By contrast, for the soft Consort wheat,
27
Outer Pericarp, Intermediate Layer and Aleurone were distributed in broken particles very
28
differently, particularly under D-D milling, suggesting a different breakage mechanism
29
associated with differences in the mechanical properties and adhesion of the bran layers.
30
These new insights into the nature of wheat breakage and the contributions of the component
31
tissues could have implications for wheat breeding and flour mill operation.
32
33
Keywords
34
flour milling; composition; pericarp; aleurone; endosperm; breakage function
Version postprint
M
AN
US
CR
IP
T
AC
CE
PT
ED
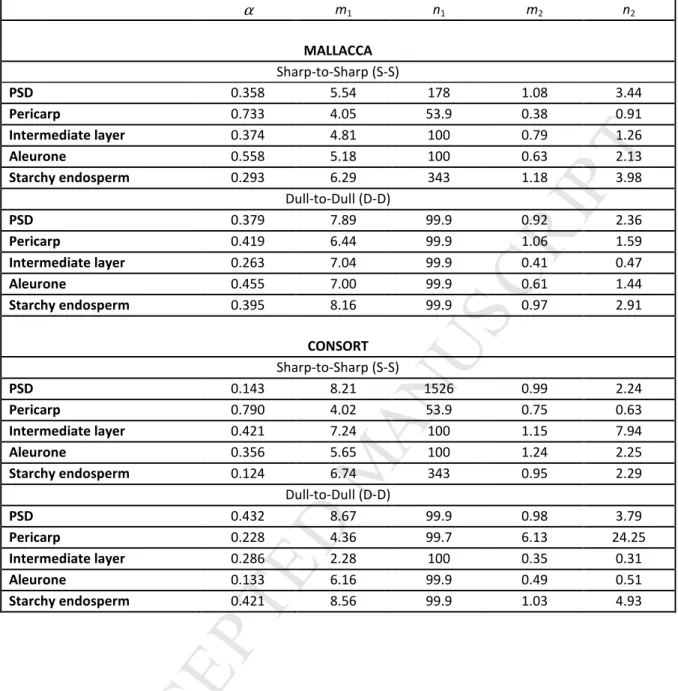
Introduction 36In the 1950s Broadbent and Callcott introduced breakage matrices to relate input and output
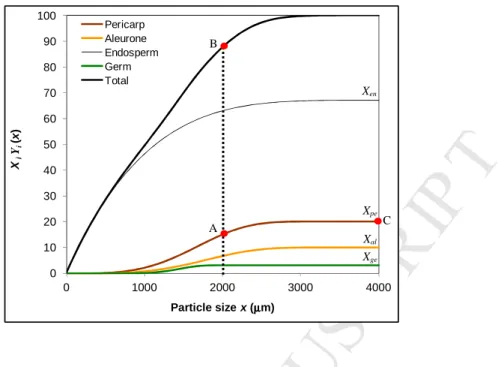
37
particle size distributions during grinding operations (Broadbent and Callcott, 1956a, 1956b,
38
1957). They used square matrices in which the input and output particle size distributions
39
covered the same size ranges, and applied this approach to model coal grinding. Campbell
40
and Webb (2001) applied the breakage matrix approach to roller milling of wheat, extending
41
the approach to use non-square matrices covering different size ranges for the input and
42
output particle size distributions, thus improving the applicability and accuracy of the
43
approach.
44
A complete understanding of milling requires the ability to predict the size distribution of
45
broken particles and also the composition of particles of different sizes. Fistes and Tanovic
46
(2006) demonstrated that compositional breakage matrices could also be constructed that,
47
combined with breakage matrices for predicting output particle size, allowed the composition
48
of those output particles also to be predicted. They also employed roller milling of wheat as
49
the system with which to demonstrate the value of predictions for composition as well as
50
size; the key feature of roller milling of wheat is that the bran tends to stay as large particles
51
and the endosperm as small particles, hence facilitating separation of bran and endosperm by
52
sifting.
53
Subsequent work by Campbell and co-workers focussed on the continuous form of the
54
breakage equation and of breakage functions, rather than the discrete forms that underpin the
55
construction of breakage matrices; continuous functions are more generally applicable and
56
more readily interpretable, thus yielding greater predictive power and greater mechanistic
57
insights regarding wheat breakage. This body of work has allowed the effects on the output
58
particle size distribution of roll gap, roll disposition, wheat kernel hardness, moisture content
59
and shape to be quantified (Campbell and Webb, 2001; Campbell et al., 2001, 2007, 2012;
60
Fang and Campbell, 2003a,b; Fuh et al., 2014). The objectives of the current work are to
61
demonstrate that continuous breakage functions can also be defined in relation to particle
62
composition, for use alongside breakage functions that predict particle size distribution, and
63
to generate experimental data to begin to identify the form and significance of those functions
64
and the new insights they reveal. The current work thus represents the continuous equivalent
65
of the discrete compositional breakage matrices introduced by Fistes and Tanovic (2006).
66
Version postprint
M
AN
US
CR
IP
T
AC
CE
PT
ED
Theory 68The breakage equation for roller milling of wheat in its cumulative form is
69
∫
∞ = 0 1 2(x) B(x,D) (D)dD Pρ
(1) 70where D is the input particle size, x is the output particle size, P2(x) is the proportion by mass
71
of output material smaller than size x, B(x, D) is the breakage function and
ρ
1(D) is the72
probability density function describing the input particle size distribution (Campbell et al.,
73
2007). The logic of the breakage equation is that the total mass of particles smaller than a
74
given size x arises from contributions from all the inlet particles. The contribution from inlet
75
particles initially of size D depends on how many of those particles there are (which is
76
quantified by
ρ
1(D)) and on how those particles break (which is quantified by the breakage77
function, B(x, D). The total mass is found by integrating all of these contributions over the
78
range of inlet particle sizes.
79
Applying equivalent logic, the composition of particles can also be described and related to
80
the particle size distribution. Choomjaihan (2009) derives the relationships by proposing that
81
the entire wheat kernel, and its milled fractions, can be considered to be made up of four
82
main components: Pericarp (including testa and nucellar tissue), Aleurone, Starchy
83
Endosperm and Germ. The sum of the proportions of these four components is unity:
84 1 = + + + al en ge pe X X X X (2) 85
where Xpe is the proportion of the whole wheat that is Pericarp, Xal is the proportion of the
86
whole wheat that is Aleurone, Xen is the proportion of the whole wheat that is Endosperm,
87
and Xge is the proportion of the whole wheat that is Germ. Typically Xpe would be about 8%,
88
Xal about 7%, Xen about 82% and Xge about 3% (Pomeranz, 1988).
89
On breakage, particles are formed that individually may contain Pericarp, Aleurone,
90
Endosperm and Germ in different proportions. In general, the particles in a size range, say
91
from 100-200 µm, will have a proportion of each component that will be different from
92
particles in a different size range, say 2000-2100 µm; the smaller particles are likely to
93
contain more Endosperm material, the larger particles more bran material (i.e. Pericarp and
94
Aleurone).
Version postprint
M
AN
US
CR
IP
T
AC
CE
PT
ED
Consider the total proportion of outlet particles smaller than size x, given by P2(x). These
96
particles, as a whole, are made up of a proportion of Pericarp, a proportion of Aleurone, a
97
proportion of Endosperm, and a proportion of Germ. The total amount of particles smaller
98
than size x is made up of the total Pericarp that is in particles smaller than size x, plus the
99
total Aleurone that is in particles smaller than x, plus the total Endosperm that is in particles
100
smaller than x, plus the total Germ that is in particles smaller than x. Mathematically:
101 ) ( · ) ( · ) ( · ) ( · ) ( · ) ( mass total an smaller th particles of mass total 2 x Y X x Y X x Y X x Y X x Y X x P ge ge en en al al pe pe i i i x + + + = = =
∑
(3) 102where Ype(x) is the proportion (by mass) of the total Pericarp that is in particles smaller than
103
x, and so on for Yal(x), Yen(x) and Yge(x). Figure 1 illustrates how the distributions of the four
104
components sum to give the total particle size distribution. Figure 2 illustrates the
105
distributions in their non-cumulative forms. (Note that in Figures 1 and 2, the proportions of
106
the four components are unrealistic, having been set at 20%, 10%, 67% and 3% arbitrarily,
107
just to separate out the lines in order to illustrate the point. The shapes of the curves are also
108
arbitrary, contrived to show Endosperm predominantly breaking into small particles, Pericarp
109
and Aleurone staying in larger particles, and Germ forming a narrow peak within the
mid-110
range particles.)
111
For example, consider the more realistic situation that in the whole wheat, Xpe = 0.08, Xal =
112
0.07, Xen = 0.82, Xge = 0.03. The wheat is milled, forming particles ranging in size from 0 up
113
to 4000 µm, with most of the particles at the smaller end of the range. Consider just those
114
particles that are smaller than 500 µm. Imagine that 40% of the total Pericarp has ended up
115
in those particles; the other 60% is in particles that have remained larger than 500 µm.
116
However, the Aleurone has not broken so readily, so only 30% of the total Aleurone has
117
ended up in the particles smaller than 500 µm; 70% of the Aleurone has stayed in the larger
118
particles. The Endosperm has broken easily; 80% of the Endosperm is now in small
119
particles, with only 20% in large particles. Meanwhile, the Germ is evenly split; half of the
120
Germ material is in particles that are smaller than 500 µm. Thus:
121 50 . 0 ) 500 ( , 80 . 0 ) 500 ( , 30 . 0 ) 500 ( , 40 . 0 ) 500 ( = al = en = ge = pe Y Y Y Y 122
Then, the total proportion of particles smaller than 500 µm is given by
Version postprint
M
AN
US
CR
IP
T
AC
CE
PT
ED
724 . 0 015 . 0 656 . 0 021 . 0 032 . 0 5 . 0 03 . 0 8 . 0 82 . 0 3 . 0 07 . 0 4 . 0 08 . 0 ) ( 2 = + + + = × + × + × + × = x P 124i.e. 72.4% of particles are smaller than 500 µm. Taking these particles as a whole, they are
125
made up of 0.032/0.724=4.4% Pericarp, 2.9% Aleurone, 90.6% Endosperm and 2.1% Germ,
126
i.e. they are enriched in Endosperm, and depleted in the other components, compared with the
127
material as a whole.
128
This is a contrived example, to illustrate the mathematics, but it reflects the known behaviour
129
of wheat during breakage, that bran material (Pericarp and Aleurone) tends to stay in large
130
particles, while endosperm shatters more readily into smaller particles. Thus, separation on
131
the basis of size using repeated milling and sifting allows separation of the bran from
132
endosperm to produce relatively pure white flour. As in the contrived example here, one
133
would expect smaller particles to be enriched in endosperm material, compared with the
134
endosperm content of the whole wheat.
135
Now, taking the Pericarp as an example, the Pericarp concentration in this group of particles,
136
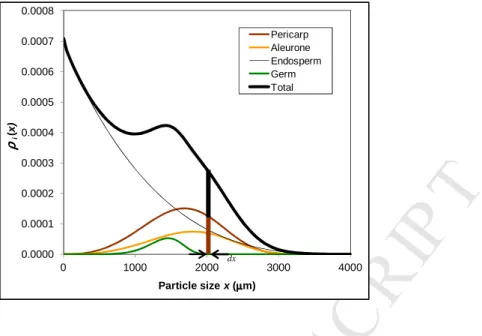
Y*pe(x), is given by the total amount of Pericarp in particles smaller than x, divided by the
137
total amount of particles smaller than x. The latter is the sum of the individual components,
138 hence: 139 ) ( · ) ( · ) ( · ) ( · ) ( · ) ( ) ( · an smaller th particles in mass total an smaller th particles in component of mass ) ( 2 * x Y X x Y X x Y X x Y X x Y X x P x Y X x x i x Y ge ge en en al al pe pe pe pe pe pe i + + + = = = (4) 140 ) ( × + ) ( × + ) ( × + ) ( × ) ( × = ) ( ) ( × = ) ( ′ 2 x Ge Ge x En En x Al Al x Pe Pe x Pe Pe x P x Pe Pe x e P tot tot tot tot tot tot (5) 141
and similarly for the concentrations of the other components, defined as Y*al(x), Y*en(x) and
142
Y*ge(x). Similarly to Xi, the sum of all Y*i concentrations must be unity:
143 1 ) ( ) ( ) ( ) ( ) ( * * * * * = + + + =
∑
Y x Y pe x Y al x Y en x Y ge x i i (6) 144Version postprint
M
AN
US
CR
IP
T
AC
CE
PT
ED
Referring to Figure 1, Xpe(x) is defined by the point A divided by the point C (the amount of
145
Pericarp in particles smaller than x divided by the total amount of Pericarp), while Y*pe(x) is
146
defined by the point A divided by the point B (the amount of Pericarp in particles smaller
147
than x divided by the total amount of particles smaller than x, i.e. the average concentration of
148
Pericarp in particles smaller than x). Note that this is the average concentration across all of
149
the particles smaller than x. The concentration of Pericarp in particles of size x will be
150
different from this average. We turn our attention to this now.
151
The preceding paragraphs have focussed on cumulative probability density functions. The
152
probability density function for component i in its non-cumulative form,
ρ
i(x), is defined as:153 ) ( ) ( Y x dx d x i i = ρ (7) 154
The quantity
ρ
i(x)dx is the proportion of the total component i that is in particles of size x,155
x+dx. Multiplying this by the total proportion of component i in the material as a whole gives
156
the total of the material as a whole that is component i and that is in the size range x, x+dx.
157
This is equal to the proportion of total material in the size range x, x+dx, multiplied by the
158
component i concentration of that material. Figure 2 illustrates for Pericarp the two ways of
159
defining this quantity of material, based on the particle size distribution and composition, or
160
on the Pericarp total and distribution, showing that they are equivalent. This equivalence is
161
expressed mathematically as:
162
X
iρ
i(x)dx
=
ρ
2(x) y
i(x)dx
(8)163
where
ρ
2(x) is the probability density function describing the outlet particle size distribution,164
and yi(x) is the concentration of component i in particles of size x. Thus the amount of
165
material defined by the brown area in Figure 2 is the value of the probability density function
166
for Pericarp at that point,
ρ
pe(x), multiplied by dx and by the total proportion of Pericarp, Xpe.167
This is equal to the total amount of material in the range x+dx multiplied by the concentration
168
of Pericarp in that total, ype(x).
169
Similarly, yal(x) is the concentration of Aleurone material, yen(x) is the concentration of
170
Endosperm material and yge(x) is the concentration of Germ material in particles of size x.
171 Clearly 172 1 ) ( ) ( ) ( ) ( ) ( = + + + =
∑
y x ype x yal x yen x yge x i i (9) 173Version postprint
M
AN
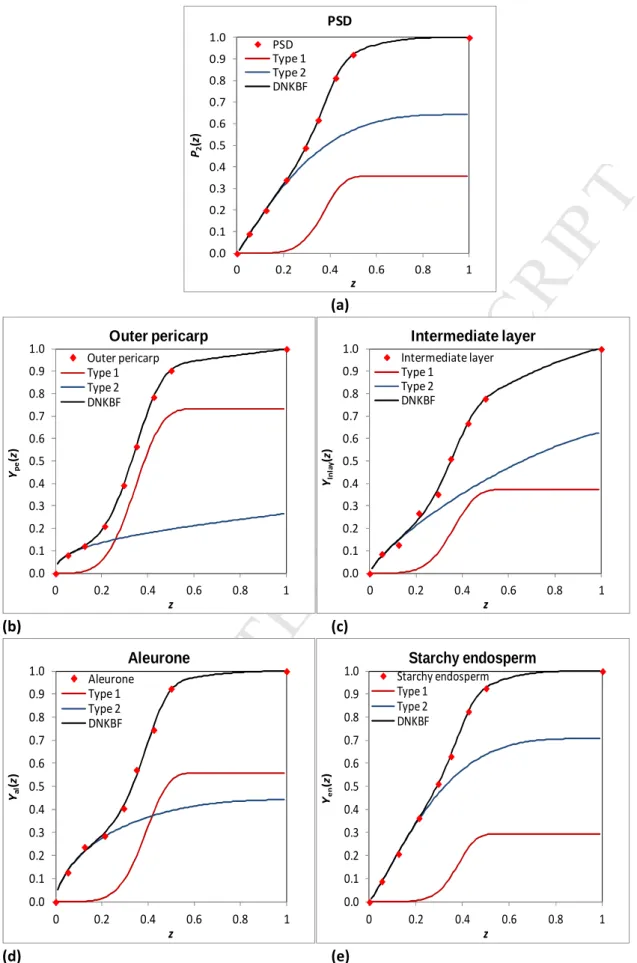
US
CR
IP
T
AC
CE
PT
ED
and 174 ) ( ) ( ) ( ) (x 2 x y x 2 x X i i i i iρ
=ρ
∑
=ρ
∑
(10) 175The breakage equation is given by Eqn. (1). If D is essentially monodispersed (little variation
176
in wheat kernel size), then the breakage is described by P2(x) = B(x,D) or, more generally, by
177
B(x,G/D) – the proportion of particles smaller than x arising from breakage of wheat at a
178
given milling ratio G/D, where G is the roll gap. The functions yi(x) similarly become
179
yi(x,G/D), the proportion of botanical component i in particles of size x resulting from milling
180
wheat at a milling ratio G/D. If the yi(x,G/D) are known, then both the size distribution of
181
particles following breakage and their compositions can be predicted. Thus the
182
compositional breakage equation is:
183
∑∫
∑
∑ ∫
= = = i x i i i x i i i i dx D G x y D G x dx D G x X D G x Y X D G x P 0 2 0 2 )· / , ( )· / , ( )· / , ( · ) / , ( · ) / , ( ρ ρ (11) 184and in its non-cumulative form:
185
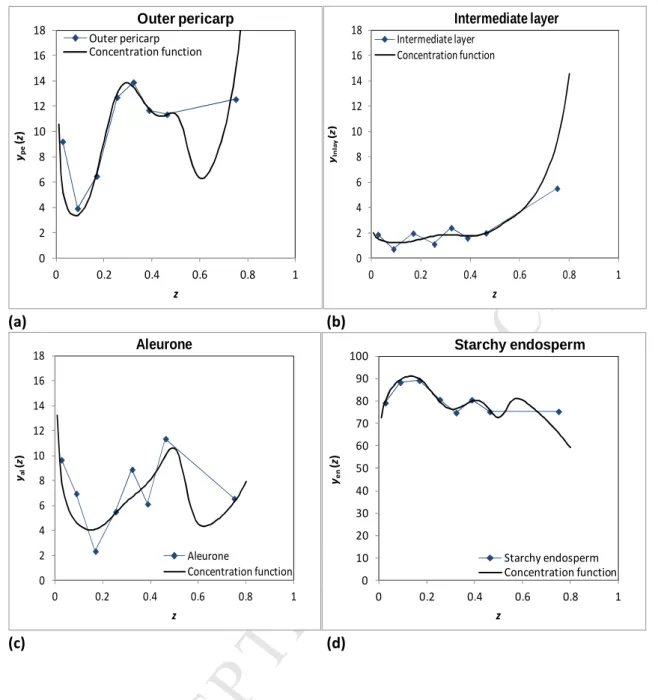
∑
∑
= = i i i i i D G x y D G x D G x X D G x ) / , ( )· / , ( ) / , ( · ) / , ( 2 2 ρ ρ ρ (12) 186Equations 11 and 12 allow both the particle size distribution, and the composition of each
187
size fraction, to be described by a single equation. This simplifies the problem to establishing
188
“concentration functions” to describe ype(x,G/D), yal(x,G/D), yen(x,G/D) and yge(x,G/D),
189
leading to “compositional breakage functions” that describe
ρ
pe(x,G/D),ρ
al(x,G/D),190
ρ
en(x,G/D) andρ
ge(x,G/D). This could be done by milling wheat at different roll gaps, sifting191
it into difference size fractions, and measuring the compositions of those size fractions, i.e.
192
the relative proportions of Pericarp, Aleurone, Endosperm and Germ in each fraction.
193
Knowing how these relative compositions change, curves could then in principle be fitted to
194
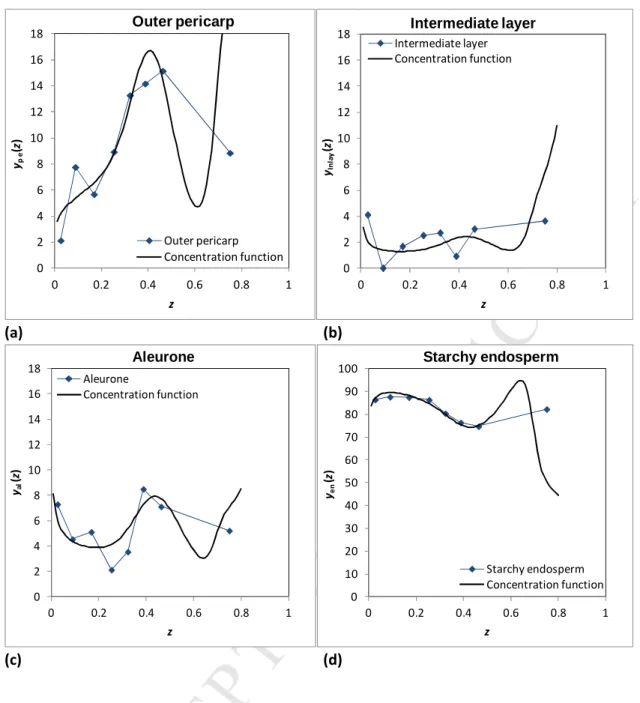
describe these changes as functions of x and G/D. Ultimately, of course, with a very large
195
experimental programme, these compositional breakage functions could be extended to
196
include hardness, as Campbell et al. (2007) did for the size-based breakage function. These
197
ambitions were beyond the scope of the current work.
Version postprint
M
AN
US
CR
IP
T
AC
CE
PT
ED
Equations 11 and 12 represent the continuous equivalent of the discrete compositional
199
breakage matrices introduced by Fistes and Tanovic (2006). The equations presented here are
200
continuous functions that are more generally applicable and more readily interpretable.
201
202
Identifying the form of compositional breakage functions
203
Having derived the compositional breakage equation above, the first objective of the current
204
work, the second objective is to begin to understand the form of the compositional breakage
205
functions by generating experimental data. In principle this is as simple as measuring the
206
concentrations of Pericarp, Aleurone, Endosperm and Germ in size fractions following
207
milling, and fitting functions to describe the variation. However, there are two difficulties
208
with this. Firstly, these concentration functions are not probability density functions and
209
hence do not have the well defined constraints of probability density functions that allow easy
210
fitting. Secondly, measuring the proportions of these materials in milled wheat samples is not
211
straightforward.
212
Taking the first of these issues, Eqn. (8) can be rearranged to give
213 ) ( ) ( ) ( 2 x x X x y i i i
ρ
ρ
= (13) 214 where 215 ) ( ) ( 2 2 P x dx d x = ρ (14) 216and
ρ
i(x) is similarly the derivative of Yi(x) as defined in Eqn. 7. Campbell et al. (2012)217
introduced the Double Normalised Kumaraswamy Breakage Function (DNKBF) as a flexible
218
probability density function well suited to describing the particle size distributions arising
219
from roller milling of wheat, and having a cumulative form that is easy to fit and is then
220
differentiable. Assuming this function has the flexibility to describe Yi(x) as well, from
221
which
ρ
i(x) could be obtained by differentiation, Eqn. 13 then allows yi(x), the concentration222
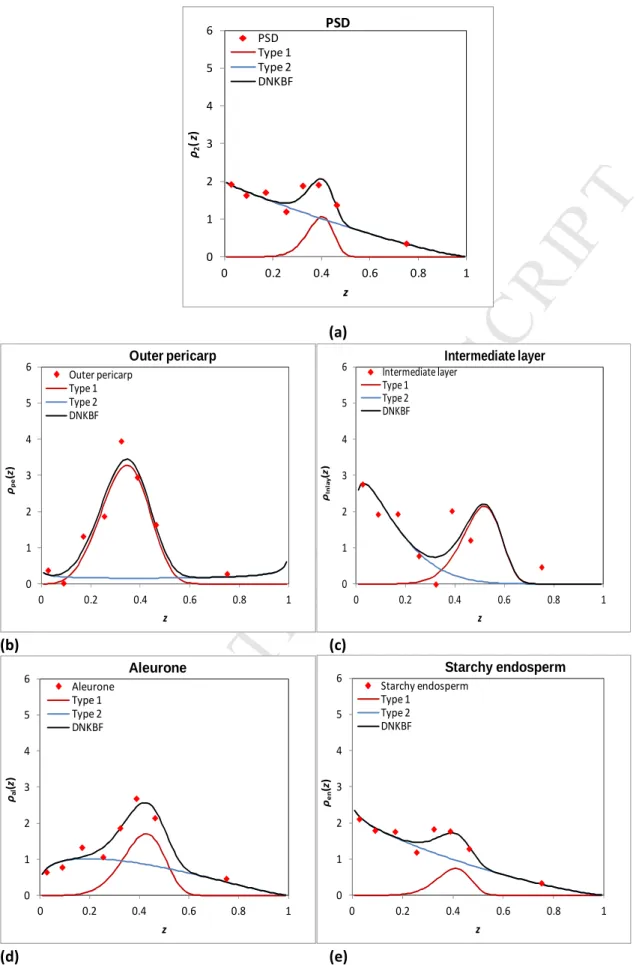
of component i in particles of size x, to be calculated as the ratio of these two probability
223
density functions. This approach, involving fitting a cumulative probability density function
224
to the accumulated data, is likely to deal with inaccuracies in the experimental data more
225
effectively, and to yield more meaningful descriptions of the compositional breakage
226
functions, than attempting to fit the concentration data directly.
Version postprint
M
AN
US
CR
IP
T
AC
CE
PT
ED
The second issue identified above is that of experimentally measuring the composition of
228
milled fractions. In principle this can be done using suitable biochemical markers specific for
229
each tissue type (Peyron et al., 2002; Barron et al., 2007; Barron and Rouau, 2008; Hemery et
230
al., 2009; Barron et al., 2011). However, Barron (2011) predicted the relative tissue
231
proportion in wheat mill streams by FTIR spectroscopy and PLS analysis. In that study,
232
Aleurone Layer, Intermediate Layer (composed of three layers: hyaline layer, testa and inner
233
pericarp (Barron et al., 2007; Barron, 2011), Outer Pericarp and Starchy Endosperm were
234
isolated as in previous works from the same author from various common wheat cultivars.
235
(Germ constitutes about 3% of the grain; its omission adds an error of a magnitude that is
236
within the analytical error of the method.) Different milled streams arising from debranning,
237
conventional milling and bran fractionation were produced from two French wheat varieties.
238
The spectra of botanical tissues and milled fractions were collected with a FTIR coupled with
239
an ATR device. The biochemical markers technique studied by the same author was used as
240
the reference method (Barron et al., 2007; Hemery et al., 2009; Barron et al., 2011). PLS
241
models were developed to predict the proportion of the botanical tissues in the milled
242
streams. The predictions obtained were good despite the complex natures and compositions
243
of botanical tissues. These models were used in the current work to quantify the
244
compositions of milled fractions in order to fit compositional breakage functions.
245
246
Materials and Methods
247
In order to demonstrate the compositional breakage equation approach, in the current work a
248
hard UK wheat, Mallacca (average hardness = 52.5, average mass = 47.6 mg, average
249
diameter = 3.26 mm after conditioning, as measured by the Single Kernel Characterisation
250
System Model 4100 (Perten Instruments, Sweden)) and a UK soft wheat, Consort (SKCS
251
hardness = 33.9, average mass = 34.7 mg, average diameter = 2.89 mm after conditioning)
252
were conditioned to 16% moisture (wet basis). 100 g samples were milled on the Satake
253
STR100 mill (Satake Corporation, Hiroshima, Japan) at a roll gap of 0.5 mm under
Sharp-to-254
Sharp (S-S) and Dull-to-Dull (D-D) dispositions, and separated by sifting into eight fractions
255
using sieves of size 2000, 1700, 1400, 1180, 850, 500 and 212 µm, using equipment and
256
methods described elsewhere (Campbell et al., 2007). The milled fractions were analysed
257
using Barron’s spectroscopy-based models, in order to estimate the proportions of Outer
258
Pericarp, Intermediate Layer, Aleurone and Starchy Endosperm in each fraction. In total 34
Version postprint
M
AN
US
CR
IP
T
AC
CE
PT
ED
samples were analyzed: two wheat types × two dispositions × one roll gap × eight fractions =
260
32, plus the two whole wheats = 34. This work is presented more fully in Galindez-Najera
261
(2014). No replication was undertaken due to practical limitations; within the constraints of
262
the work, we preferred to generate data from contrasting wheats and milling conditions, to
263
serve the purposes of illustrating the approach and allowing tentative new insights.
264
The protocol for spectroscopic analysis of the samples was based on the method described by
265
Barron (2011): milled fractions were first ground in liquid nitrogen with a Spex CertiPrep
266
6750 laboratory impact grinder to have a homogenous size. Spectra were recorded in the MIR
267
region using a Nicolet Nexus 6700 (ThermoScientific, Courtaboeuf, France) spectrometer
268
equipped with an ATR Smart DuraSampleIR accessory (ThermoScientific, U.K.) and a
269
Mercury Cadmium-Telluride-High D detector. Spectra were recorded between 800 and 4000
270
cm–1, with samples pressed onto the diamond ATR area. Interferograms (128) were collected
271
at 4 cm–1 resolution and co-added before Fourier transformation. For each sample five
272
spectra were collected. An air-background scan was recorded every three spectra. Partial
273
Least Square (PLS) quantification was applied using models developed by Barron (2011).
274
Similar spectral pre-treatments were then applied to predict each tissue proportion. Outer
275
Pericarp, Intermediate Layer (including inner pericarp), Aleurone and Starchy Endosperm
276
were predicted in each milled fraction, and the results interpreted through the compositional
277
breakage equation.
278
A number of cautions are emphasised at this point. Firstly, we acknowledge that the
279
correlations used in the model were based on French wheats, such that the absolute results
280
generated for these UK samples are unlikely to be accurate. However, the relative values are
281
likely to be sufficiently meaningful to allow the approach here to be demonstrated and to
282
yield valid insights. Secondly, the models do not allow quantification of the Germ, and they
283
distinguish between the Outer Pericarp and the Intermediate Layer. The information they
284
provide is therefore not quite in the form of the derivations above, in particular not intending
285
to provide mutually exclusive proportions of components that sum to unity. The values for
286
Outer Pericarp, for example, should be considered to indicate how the Outer Pericarp
287
concentration varies with particle size, but the corresponding variations of Intermediate
288
Layer, Aleurone and Endosperm are not expected to sum to one. Thus the data can be used in
289
conjunction with Eqn. 12 to find the form of the compositional breakage functions but not
290
their absolute values, and could not be used at this stage to define completely Eqn. 11, the
Version postprint
M
AN
US
CR
IP
T
AC
CE
PT
ED
compositional breakage equation. We also acknowledge that the individual trials were not
292
replicated.
293
294
Results and Discussion
295
Table 1 shows the proportion of material on each sieve size following milling under S-S or
296
D-D, and the percentages of Outer Pericarp, Intermediate Layer, Aleurone and Starchy
297
Endosperm in each fraction as predicted by Barron’s model, along with the predictions for
298
each component in whole wheat samples. Note that the independent raw data for each
299
component did not sum to unity, due to inherent errors in the predictions and in their
300
application to UK wheats; on average the total material was overestimated by 8.3% for the
301
Mallacca samples and 4.9% for Consort, possibly suggesting that the French wheats used to
302
generate the models were more similar to the soft Consort wheat, although the discrepancy is
303
within the accuracy of the method. The data reported in Table 1 have been normalised to
304
unity, as a reasonable approximation to the composition of particles in each size range, and to
305
fit the assumptions underlying the formulation of the compositional breakage equation.
306
The total percentage of each component in the whole Mallacca wheat was Xpe = 8.3%, XInlay =
307
1.2%, Xal = 6.0% and Xen = 84.4%; and in the whole Consort wheat was Xpe = 2.3%, XInlay =
308
2.9%, Xal = 5.8% and Xen = 88.9%. Multiplying the amount of material on each sieve by the
309
concentration of a given component, and summing these, allows the cumulative
310
compositional distributions, Ype(x), Yal(x), Yen(x) and YInlay(x) (the proportion by mass of the 311
total botanical component that is in particles smaller than x) to be calculated.
312
The total is reported as the average for each component in Table 1, for each wheat type under
313
each milling disposition. Ideally, these averages would be the same under both dispositions,
314
and identical with the predicted compositions of the whole grains. Inspection of Table 1
315
shows that there are some significant discrepancies, which underline again the inherent errors
316
in the prediction method and in its application to UK wheats. Nevertheless, the data allow
317
the compositional breakage function approach to be demonstrated, with appropriate caution,
318
and using the averages rather than the data for whole wheat in order to ensure internal
319
consistency in the analysis. The justification for this is that the average values are averaged
320
from eight measurements, compared with just one for the whole wheat samples, and that in
321
any case the PLS models were developed for milled stocks rather than for whole wheats
Version postprint
M
AN
US
CR
IP
T
AC
CE
PT
ED
(Barron, 2011), so the results for the milled fractions might be expected to be more accurate
323
than those for the whole wheats.
324
Figure 3 shows the cumulative distributions for the particle size distribution and for the four
325
component distributions, for the Mallacca wheat milled under a Sharp-to-Sharp disposition.
326
Figure 4 presents the experimental data and the fitted size distributions in their
non-327
cumulative forms. Table 2 reports the fitted Double Normalised Kumaraswamy Breakage
328
Function parameters. In order to fit the DNKBF, the x-axis was normalised by dividing
329
particle size by 4000 µm, in order to yield Kumaraswamy shape parameters consistent with
330
previously reported work, although the current work only used 2000 µm for its largest sieve,
331
so the data beyond this size is not available. The DNKBF in its cumulative form is
332 (Campbell et al., 2012) 333
( )
1(
4 24(
4 34)
)
(
144)
(
42(
444)
3)
Breakage 2 Type Breakage 1 Type 2 2 2 1 1 1 1 1 1 1 zm n zm n z P =α − − + −α − − (15) 334where z is the normalized size, P(z) is the percentage smaller than z, α is the proportion of the
335
distribution that can be described as Type 1 breakage, and m1 and n1 are parameters
336
corresponding to Type 1 breakage. The quantity (1– α) gives the proportion of Type 2
337
breakage, while m2 and n2 are the parameters that describe the form of Type 2 breakage.
338
Differentiating Eqn. 14 gives the non-cumulative form of the DNKBF:
339
( )
1(
4442(
444)
3)
(
144)
(
4424(
444)
3)
Breakage 2 Type 1 2 2 Breakage 1 Type 1 1 1 2 2 2 2 1 1 1 1 m n 1 m 1 m n m z z n m z z n m z p =α − − + −α − − (16) 340Considering the particle size distributions in Figure 3(a) and Figure 4(a), the DNKBF
341
describes the data well, yielding values of
α
= 0.36, m1 = 5.54, n1 = 178.10, m2 = 1.08 and n2342
= 3.44; these values are broadly consistent with previous work for a wheat of hardness
343
around 50 milled under S-S (Campbell et al., 2012).
344
Figures 3(a) and 4(a) also show the Type 1 and Type 2 functions that combine to give the
345
DNKBF. The values of m1 and n1 describe a narrow peak of mid-range particles, while those
346
for m2 and n2 describe a broad distribution of mostly small particles but extending to include
347
the very large particles. Galindez-Najera and Campbell (2014) described a mechanism for
348
Type 2 breakage that explains the co-production of the very large bran particles and the small
349
Endosperm particles, and hence why they are described by the same Type 2 breakage
350
function.
Version postprint
M
AN
US
CR
IP
T
AC
CE
PT
ED
Considering now the cumulative distribution shown for the Outer Pericarp material in Figure
352
3(b) and the non-cumulative form in Figure 4(b), again the DNKBF describes the data well.
353
Comparing Figures 4(a) and 4(b), it appears that the Outer Pericarp is noticeably concentrated
354
in the mid-range particles. The DNKBF shape parameters are m1 = 4.05, n1 = 53.9, m2 = 0.38
355
and n2 = 0.91, with the proportion of Type 1 breakage,
α
= 0.733. The decrease in the Type 1356
parameters has tended to make the Type 1 component of the distribution more narrow, while
357
the proportion of Type 1,
α
, has increased to 0.733. Thus, Outer Pericarp is predominantly358
found in the mid-range Type 1 particles resulting from breakage. This is a new insight into
359
wheat breakage.
360
The Type 2 parameters have both decreased to well below 1, giving a very steep peak for the
361
very small particles, matching the experimental data at that point. This suggests that there is
362
a significant amount of Outer Pericarp in the very small particles. This can be understood as
363
Pericarp “dust” that is produced during breakage. Although bran material (Pericarp and
364
Aleurone) tends to stay as large particles during roller milling, inevitably some small particles
365
of bran (Outer Pericarp or beeswing) are produced, and this is evident here in the
366
experimental data and in the modelling of it. Again, this is a new insight that is consistent
367
with the accepted physical understanding of the nature of wheat breakage, but here has for the
368
first time been identified and described quantitatively. It is proposed cautiously at this point,
369
recognising that this work is for a single wheat and so far we have considered only a single
370
component and only the S-S data. But it serves at this point to illustrate the nature of the
371
compositional breakage function interpretation and the insights that can result.
372
Moving to consider the results for the Aleurone layer, Figures 3(d) and 4(d) show very
373
similar results to those for Outer Pericarp; this makes sense, as the Pericarp and Aleurone
374
tend to fuse during conditioning and break together (Hemery et al., 2007). The fit is not quite
375
as good as for the Outer Pericarp, despite the spectroscopic model being in general more
376
accurate for Aleurone than for Outer Pericarp (Barron, 2011). Nevertheless, the same
377
features are evident: a greater concentration of Aleurone material in mid-range Type 1
378
particles, and a similar spike of very small particles of Aleurone-containing “dust”. The
379
proportion of Type 1 in this case is lower at 0.557, while m1 = 5.20, n1 = 100, m2 = 0.63 and
380
n2 = 2.13, all larger than the corresponding values for Outer Pericarp. Not too much should
381
be read into the fine detail of these changes, beyond noting that in general the increases in the
382
values of the Kumaraswamy shape parameters move the distribution slightly to the right.
383
This may suggest the Aleurone is more prevalent in slightly larger particles following
Version postprint
M
AN
US
CR
IP
T
AC
CE
PT
ED
breakage – possibly Outer Pericarp, being on the outside, is “knocked off” these larger
385
particles more easily than Aleurone, although a physical mechanism is not obvious and the
386
data does not support excessive speculation at this point. However the more general point
387
that the compositional variation of particles is very similar for both the Outer Pericarp and
388
Aleurone, and information from these two different components points to similar conclusions
389
regarding the nature of mid-range particles and the production of bran dust.
390
Figures 3(c) and 4(c) show the results for the Intermediate Layer. This data is predicted by
391
the spectroscopic model least accurately, such that there is significant scatter in the data, but
392
the results show a similar pattern to those for Outer Pericarp and Aleurone, adding
393
confidence that the features apparent in the graphs for these two components are genuine.
394
Moving to Figures 3(e) and 4(e), the Starchy Endosperm shows contrasting behaviour to the
395
Outer Pericarp and Aleurone, being more predominant in the smaller particles, but with the
396
fitted curves featuring a dip at the very smallest particles, consistent with these particles
397
containing significant amounts of bran dust and hence less endosperm. The proportion of
398
Type 1 is 0.293, with m1 = 6.30, n1 = 343, m2 = 1.18 and n2 = 3.98. The increase of m2 to >1
399
introduces the hump at the lower end of the Type 2 curve. There is still a significant Type 1
400
bump in the middle of the distribution, indicating that there is a lot of Endosperm material in
401
these mid-range Type 1 particles. This is for the simple reason that there are a lot of these
402
Type 1 particles. We must remember that these distributions combine the particle size
403
distribution and the composition of those particles, such that the shapes of these curves is
404
dominated by the shape of the overall particle size distribution. The fit to the data is good,
405
but this data does not show clearly the concentrations of components in these particles. We
406
will focus on the concentrations in a moment, once we have considered results for the
407
Intermediate Layer.
408
As noted above, the concentration functions can be found by inserting the Double
409
Kumaraswamy Functions fitted to the particle size distribution and to the compositional
410
distributions into Eqn. 12. Once again this is illustrated in relation to Outer Pericarp:
411
(
)
(
)
(
)
(
(
)
)
[
]
(
)
(
)
(
)
(
(
)
)
[
]
particlesizedistributionn m m n m m on distributi i n m m n m m i i i i z z n m z z n m z z n m z z n m X x x X x y 2 2 2 1 1 1 2 2 2 1 1 1 1 1 ) ( 1 1 1 1 ) ( 1 1 ) ( ) ( ) ( 1 2 2 1 1 1 1 2 2 1 1 1 2 − − − + − − − − + − = = − − − −
α
α
α
α
ρ
ρ
(17) 412Version postprint
M
AN
US
CR
IP
T
AC
CE
PT
ED
Figure 5 shows the concentration functions resulting from dividing the fitted DNKBF
413
functions using Eqn. 17, for all four components, compared with the original experimental
414
data for each component’s concentration. The agreement is good, as one would hope as it is
415
a circular relationship – the experimental data was used to generate the compositional
416
breakage functions, so the reverse analysis (which is what the ratio of the composition and
417
particle size DNKBFs is) would be expected more or less to recreate the experimental data.
418
Figure 5 simply reassures that the analysis does indeed reveal genuine features, while
419
allowing continuous functions to be formulated that could not readily be formulated from the
420
raw compositional data.
421
A number of further observations can be drawn. Firstly, although dividing one wiggly
422
function by another wiggly function gives an even more wiggly function for which not every
423
wiggle is meaningful, the curves obtained do seem to agree with the trends in the
424
experimental data. The curves and data beyond 2000 µm (z = 0.5) should be largely ignored,
425
as there was only one data point covering this entire range. But below 2000 µm (z = 0.5), the
426
concentration of Outer Pericarp as shown by the curve is high initially and drops suddenly,
427
indicating fine Outer Pericarp dust present as very small particles; the experimental data also
428
shows this. The concentration then increases to a peak for the mid-range particles and begins
429
to decrease again, features that are again reflected in the experimental data.
430
The curves and experimental data for Aleurone show the same general pattern, albeit with
431
more scatter. The curves and data for the Starchy Endosperm show an inverse trend with
432
lower concentrations in the finest and the mid-range particles. The trend is less pronounced
433
because the Endosperm necessarily dominates the composition of all the particles.
434
Meanwhile the overall trend is downwards, consistent with the expectation that larger
435
particles are less concentrated in Endosperm than smaller particles. The Intermediate Layer
436
seems to show a slightly increasing trend of concentration with particle size.
437
A further observation is that the concentration functions are clearly very complex; it would be
438
not be possible to define a simple function likely to be capable of describing variations in
439
component concentration for a range of wheats milled under a range of conditions. The
440
approach presented here, allowing the particle size distribution and the component
441
distributions to be described by Double Kumaraswamy Functions, the ratios of which give
442
the concentration functions, is a practical way to describe, quantify and interpret the effects of
443
breakage on component distributions.
Version postprint
M
AN
US
CR
IP
T
AC
CE
PT
ED
Figures 6 and 7 show the equivalent results for the samples milled under a Dull-to-Dull
445
disposition. The fitted DNKBF parameters are again reported in Table 2. Although this is
446
the same wheat, in other respects these results are independent of those discussed above; the
447
size fractions were generated and analysed independently of those produced from milling
448
under S-S. It is encouraging that many of the features seen in the S-S data also appear here:
449
the higher concentrations of Outer Pericarp and Aleurone in mid-range Type 1 particles, and
450
higher concentration of Endosperm in smaller particles. A notable difference is the absence
451
of evidence of Outer Pericarp in the very fine dust, although there is still evidence of
452
Aleurone material in this fine dust, and also of Intermediate Layer, while there is a high
453
concentration of Outer Pericarp in the slightly larger small particles. This probably reflects
454
limitations in this small set of experimental data, but could conceivably reflect differences in
455
the nature of breakage under Dull-to-Dull compared with Sharp-to-Sharp milling.
Galindez-456
Najera and Campbell (2014) describe differences in the scraping of bran particles formed
457
from Dull-to-Dull milling compared with Sharp-to-Sharp. Based on this description, it is
458
plausible that D-D gives less creation of bran dust in the first place, but yields more effective
459
scraping of Endosperm from the inside of the large bran particles, this scraping generating
460
Aleurone and Intermediate Layer material in the finest particles, but not getting as far as
461
Outer Pericarp. More extensive work would be needed to identify conclusively patterns of
462
breakage under different conditions, but the results from D-D milling support those from S-S
463
in demonstrating the quantitative interpretation that the compositional breakage function
464
approach can deliver.
465
Figure 8 presents the experimental data and the fitted size distributions in their
non-466
cumulative forms for Consort wheat. The fitted DNKBF parameters are again reported in
467
Table 2.
468
Considering the particle size distribution in Figure 8(a), the DNKBF describes the data well,
469
yielding values of α = 0.143, m1 = 8.21, n1 = 1527, m2 = 0.99 and n2 = 2.24; these values are
470
broadly consistent with previous work for a wheat of hardness around 30, milled under S-S
471
(Campbell et al., 2012).
472
Figure 8(a) also show the Type 1 and Type 2 functions that combine to give the DNKBF. As
473
a reminder, the values of m1 and n1 describe a narrow peak of mid-range particles, while
474
those for m2 and n2 describe a broad distribution of mostly small particles but extending to
475
include the very large particles.
Version postprint
M
AN
US
CR
IP
T
AC
CE
PT
ED
Considering now the cumulative distribution shown for the Outer Pericarp in Figure 8(b),
477
again the DNKBF describes the data well. Comparing Figures 8(a) and 8(b), it appears that
478
the Outer Pericarp material is clearly concentrated in the mid-range particles. The DNKBF
479
shape parameters are m1 = 4.02, n1 = 53.9, m2 = 0.75 and n2 = 0.63, with the proportion of 480
Type 1 breakage, α = 0.790. The decrease in the Type 1 parameters, in general, makes the
481
Type 1 component of the distribution narrower, while the proportion of Type 1 has increased.
482
Thus, Outer Pericarp is predominantly found in the mid-range Type 1 particles resulting from
483
breakage. These results are similar to the findings for Mallacca wheat.
484
Similar to Mallacca wheat, the Type 2 parameters for Consort wheat have both decreased to
485
below 1, but unlike Mallacca, a very small steep spike for the very small particles is observed
486
for Consort, matching the experimental data at that point. This suggests a little amount of
487
Outer Pericarp “dust” in the very small particles that is produced during breakage. Although
488
bran material tends to stay as large particles during roller milling, inevitably some small
489
particles of bran are produced. Although this new insight is not as evident as it is for
490
Mallacca, there is still evident in both the experimental data and in the modelling for Consort.
491
It is proposed cautiously at this point, recognising that this work is only for two wheat types
492
and so far only a single Consort component and only the S-S data have been considered. But
493
it serves at this point to illustrate the nature of the compositional breakage function
494
interpretation and the insights that can result.
495
Regarding the results for the Aleurone layer, Figure 8(d) show a similar pattern to those for
496
Outer Pericarp, although unlike Outer Pericarp for Mallacca wheat, there is not a steep peak
497
for the very small particles (less dust production). The fit is once again not quite as good as
498
for the Outer Pericarp, despite the spectroscopic model being in general more accurate for
499
Aleurone than for Outer Pericarp (Barron, 2011). This may indicate that Aleurone breakage
500
during milling is less well defined than Outer Pericarp breakage. Similar to Outer Pericarp, a
501
greater concentration of Aleurone material in mid-range Type 1 particles is evident, along
502
with very small particles of Aleurone-containing “dust”, although not showing a spike. The
503
proportion of Type 1 in this case is lower at 0.36, while m1 = 5.65, n1 = 100, m2 = 1.24 and n2
504
= 2.25, all larger than the corresponding values for Outer Pericarp. In general the increase in
505
the values of the Kumaraswamy shape parameters moves the distribution slightly to the right.
506
This may suggest once again the Aleurone is more prevalent in slightly larger particles
507
following breakage; possibly Outer Pericarp, being on the outside, is eliminated from these
508
larger particles more easily than Aleurone, or, perhaps the production of Aleurone is coming
Version postprint
M
AN
US
CR
IP
T
AC
CE
PT
ED
from inside, in other words, the Starchy Endosperm has been scraped off, allowing the action
510
of the rolls to reach the Aleurone.
511
Figure 8(c) show the results for the Intermediate Layer. As noted earlier, this data is predicted
512
by the spectroscopic model least accurately, such that there is significant scatter in the data.
513
However, the Intermediate Layer shows an opposite behaviour with respect to Outer Pericarp
514
and Aleurone; the presence of Intermediate Layer material is considerable higher in the dust
515
but lower in the mid-range particles are pushed towards the larger mid-range particles. This
516
insight is interesting because, while the Intermediate Layer might be expected to behave
517
similarly to Aleurone and Outer Pericarp as part of the bran layers, the data suggest that the
518
shearing effect applied to this soft wheat causes the Intermediate Layer to crumble quite
519
easily into small particles, while the Outer Pericarp and Aleurone on either side remain
520
relatively intact. If true, this is a remarkable new insight into the nature of soft wheat
521
breakage.
522
Figure 8(e) show for the Starchy Endosperm contrasting behaviour to the Outer Pericarp and
523
Aleurone, being more predominant in the smaller particles. The proportion of Type 1 is
524
0.124, with m1 = 6.74, n1 = 343, m2 = 0.951 and n2 = 2.29. Similar to Mallacca wheat, there is
525
a significant Type 1 bump in the middle of the distribution, indicating that there is a lot of
526
endosperm material in these mid-range Type 1 particles. Again, this is for the simple reason
527
that there are a lot of these Type 1 particles.
528
Figure 9 shows the concentration functions resulting from dividing the fitted DNKB
529
functions using Equation 17, for all four components, compared with the original
530
experimental data for each component’s concentration. Similar to Mallacca data, the
531
experimental Consort data was used to generate the compositional breakage functions, so the
532
reverse analysis more or less recreates the experimental data. Similar to Mallacca wheat
533
results, Figure 9 reassures that the analysis does indeed reveal genuine features, while
534
allowing continuous functions to be formulated that could not readily be formulated from the
535
raw compositional data.
536
Figures 10 and 11 show the equivalent results for the Consort samples milled under a D-D
537
disposition. The fitted DNKBF parameters are again reported in Table 2.
538
It is well established that milling a soft wheat under a D-D disposition gives a much broader
539
particle size distribution than milling a hard wheat under S-S (Campbell et al., 2007, 2012),
540
and the results in Figure 10 reflect this. In terms of the compositional data, once again these
Version postprint
M
AN
US
CR
IP
T
AC
CE
PT
ED
data are independent from those considered above, and it is again encouraging that many of
542
the features seen in the S-S data also appear here: the higher concentrations of Outer Pericarp
543
and Aleurone in mid-range Type 1 particles, and higher concentration of Endosperm in
544
smaller particles. A notable difference is the absence of Outer Pericarp in the very fine dust,
545
although there is still evidence of Aleurone material in this fine dust. The Intermediate Layer
546
shows a high concentration of dust in the very small particles, while in the slightly larger
547
small particles there is higher concentration of the Intermediate Layer which then decreases
548
in the mid-range and larger particles. It is observed that Aleurone and Intermediate layer are
549
generating more dust than Outer Pericarp, which seems to show very little or no dust
550
production under D-D milling. Under S-S milling, the production of Aleurone dust is less
551
compared with D-D milling, although Outer Pericarp dust is higher and Intermediate Layer
552
seems to be even more. All these features are in contrast to the harder Mallacca wheat, in
553
which overall, the bran dust production is considerable higher under both dispositions
554
compared with the soft Consort wheat, and particularly higher under D-D disposition.
555
Consistent with the description presented by Galindez-Najera and Campbell (2014), the
556
breakage mechanism observed here seems to suggest a more effective scraping of endosperm
557
from the inside of the large bran particles, this scraping generating Aleurone and Intermediate
558
Layer material in the finest particles, but not getting as far as Outer Pericarp.
559
Figure 12 collects the Outer Pericarp, Intermediate Layer and Aleurone distributions together
560
on the same graph, for both wheats under both dispositions. Gathering together the data from
561
all four conditions highlights certain consistent patterns and some distinctive differences that
562
together give a degree of confidence that the apparent effects are genuine. Most striking is
563
the contrast between the hard Mallacca wheat and the soft Consort wheat, which is more
564
striking than the difference between the S-S and D-D dispositions. There are some intriguing
565
and tantalising patterns within the compositional data for Mallacca, most notably the aleurone
566
peak being shifted to the right compared with the Outer Pericarp peak (which is also evident
567
for Consort under S-S), and the apparent production of Outer Pericarp/Intermediate
568
Layer/Aleurone “dust” under S-S, but only Intermediate Layer/Aleurone dust, without Outer
569
Pericarp, under D-D, which may point to subtleties in the mechanisms of breakage. But more
570
striking than these small differences is the relative uniformity of the Mallacca compositions
571
in relation to Outer Pericarp, Intermediate Layer and Aleurone, which vary in broadly
572
consistent ways with particle size. This is in marked contrast to Consort, in which the
573
relative proportions of these three components appear to vary substantially in particles of
Version postprint
M
AN
US
CR
IP
T
AC
CE
PT
ED
different size, pointing to very different breakage origins. It appears that in the hard wheat,
575
essentially the bran layers break “together”, with subsequent minor variations in composition
576
as bits are knocked off. This is consistent with the general understanding that in hard wheats,
577
the bran “breaks together with the endosperm” (Fang and Campbell, 2002a,b, 2003a), with
578
the breakage patterns being dominated by the endosperm physical properties. By contrast, in
579
the soft wheat, which naturally produces much larger bran particles (Campbell et al., 2007;
580
Greffeuille et al., 2007) these large flat particles are then scraped by the rollers in ways that
581
alter their composition profoundly, and more so under D-D than under S-S. The behaviour of
582
these large bran particles is therefore dictated much more by the properties and structure of
583
the bran layers than by the hardness of the endosperm.
584
Perhaps most interesting is the evidence that when a large flat bran particle produced from a
585
soft wheat is scraped by the differential action of the rollers, the Intermediate Layer appears
586
to crumble into smallish particles, while the Outer Pericarp, and to a lesser extent the
587
Aleurone, manage to stay predominantly in large particles. This is evident under S-S, while
588
under D-D, the contrast between the Outer Pericarp and Intermediate Layer is even more
589
evident, with Aleurone tending more towards smaller particles in this case. This idea that the
590
Intermediate Layer, which is physically located between the Outer Pericarp and Aleurone
591
layers, appears to crumble into small particles whilst the layers either side remain more intact,
592
has profound consequences for understanding the nature of wheat breakage and differences
593
between the milling performances of different wheats. It may be that this crumbly
594
Intermediate Layer is specific to this particular Consort sample, and not a general feature of
595
soft wheats, in which case the implications are even more profound, particularly for Second
596
Break milling which is devoted to scraping of large flat bran particles (Mateos-Salvador et
597
al., 2013). Variations in the breakage patterns of the Intermediate Layer could be exploited
598
for developing wheats, or conditioning regimes, or First Break/Second Break roll gap
599
combinations that lead to noticeably enhanced separation during Second Break milling.
600
Greffeuille et al. (2007) investigated the mechanical properties of the outer layers, Outer
601
Pericarp, Aleurone and Intermediate layer, together and separately, for wheats of different
602
hardness from near-isogenic lines. They confirmed that when these outer layers were intact
603
as unseparated bran, they were more extensible in the soft wheats, consistent with the larger
604
bran particles obtained from milling soft wheats. For the individual layers, they found that
605
isolated Outer Pericarp was the least extensible layer, in agreement with earlier work by
606
Antoine et al. (2003), and that Outer Pericarp from hard wheat was more extensible and less