For Peer Review Only
The role of hydrogeological setting in two Canadian peatlands investigated through 2D steady-state
groundwater flow modeling
Journal: Hydrological Sciences Journal Manuscript ID HSJ-2016-0044.R1
Manuscript Type: Original Article Date Submitted by the Author: 02-Dec-2016
Complete List of Authors: Quillet, Anne; Université du Québec à Montréal, Sciences de la Terre et de l\'atmosphère
Larocque, Marie; Université du Québec à Montréal, Sciences de la Terre et de l'atmosphère
Pellerin, Stéphanie; Institut de recherche en biologie vegetale, Jardin botanique de Montréal
Cloutier, Vincent; Université du Québec en Abitibi-Témiscamingue, campus d'Amos, Groundwater Research Group, Research Institute on Mines and the Environment
Ferlatte, Miryane; Université du Québec à Montréal, Sciences de la Terre et de l\'atmosphère
Paniconi, Claudio; Institut national de la recherche scientifique, Centre Eau Terre Environnement
Bourgault, Marc-André; Université du Québec à Montréal, Sciences de la Terre et de l\'atmosphère
Keywords: Peatland, Aquifer, Hydrogeologic setting, 2D model, Steady-state, Modflow
For Peer Review Only
The role of hydrogeological setting in two Canadian peatlands
1
investigated through 2D steady-state groundwater flow modeling
2 3 4
Anne Quillet1, Marie Larocque1*, Stéphanie Pellerin2, Vincent Cloutier3, Miryane
5
Ferlatte1, Claudio Paniconi4, Marc-André Bourgault1
6 7
1 GEOTOP Research Center, Université du Québec à Montréal, C.P. 8888, succ. Centre-Ville,
8
Montréal (QC), Canada, H3C 3P8 ; tel : 514-987-3000 ext. 1515 ; fax : 514-987-7749 9
2 Institut de recherche en biologie végétale, Université de Montréal (IRBV), Jardin botanique de
10
Montréal, 4101 rue Sherbrooke est, Montréal (Qc), Canada, H1X 2B2 11
3 Groundwater Research Group, Research Institute on Mines and the Environment, – Université du
12
Québec en Abitibi-Témiscamingue, Campus d’Amos, 341, rue Principale Nord, suite 5004, Amos 13
(Qc), Canada, J9T 2L8 14
4 Institut national de la recherche scientifique, Centre Eau Terre Environnement (INRS-ETE),
15
Université du Québec, 490 rue de la Couronne, Québec (Qc), Canada, G1K 9A9 16
* Corresponding author : [email protected] 17 18 3 4 5 6 7 8 9 10 11 12 13 14 15 16 17 18 19 20 21 22 23 24 25 26 27 28 29 30 31 32 33 34 35 36 37 38 39 40 41 42 43 44 45 46 47 48 49 50 51 52 53 54 55 56 57 58
For Peer Review Only
Abstract
19
This study investigated how hydrogeological setting influences aquifer–peatland
20
connections in slope and basin Sphagnum-dominated peatlands. Steady-state groundwater
21
flow was simulated using Modflow on 2D transects for an esker slope peatland and for a
22
basin peatland in southern Quebec (Canada). Simulations investigated how hydraulic heads
23
and groundwater flow exported toward runoff from the peatland can be influenced by
24
recharge, hydraulic properties and heterogeneity. The slope peatland model was strongly
25
dominated by horizontal flow from the esker. This suggests that slope peatlands are
26
dependent on the hydrogeological conditions of the adjacent aquifer reservoir, but are
27
resilient to hydrological changes. The basin peatland produced groundwater outflow to the
28
surface aquifer. Lateral and vertical peat heterogeneity due to peat decomposition or
29
compaction were identified as having a significant influence on fluxes. These results
30
suggest that basin peatlands are more dependent on recharge conditions, and could be more
31
susceptible to land use and climate changes.
32
Keywords
33
Peatland, aquifer, hydrogeological setting, 2D model, steady-state, Modflow
34 35
Résumé
36
L’objectif de cette étude était d’identifier de quelle façon le contexte hydrogéologique
37
influence les connexions aquifère-tourbière dans les tourbières de pente et de dépression
38
dominées par les sphaignes (Sphagnum). Les flux d’eau souterraine ont été simulés en 2D
39 3 4 5 6 7 8 9 10 11 12 13 14 15 16 17 18 19 20 21 22 23 24 25 26 27 28 29 30 31 32 33 34 35 36 37 38 39 40 41 42 43 44 45 46 47 48 49 50 51 52 53 54 55 56 57 58
For Peer Review Only
sur des transects représentant une tourbière de pente en flanc d’esker et une tourbière de
40
dépression, toutes les deux situées dans le sud du Québec (Canada). Les simulations ont
41
été réalisées en régime permanent et en 2D avec le modèle Modflow. Les simulations ont
42
permis d’étudier comment les charges hydrauliques et les flux d’eau souterraine exportés
43
vers le ruissellement peuvent être influencés par la recharge, les propriétés des matériaux
44
et leur épaisseur. Le modèle de tourbière de pente est fortement dominé par les flux
45
horizontaux provenant de l’esker. Ceci indique que les tourbières de pente sont
46
dépendantes des conditions hydro-géologiques du réservoir aquifère voisin mais sont
47
résilientes aux changements hydrologiques. Le modèle de tourbière de dépression a généré
48
des écoulements d’eau souterraine vers l’aquifère superficiel. L’hétérogénéité latérale et
49
verticale de la tourbe liée à son degré de décomposition ou de compaction ont une
50
importance significative sur les flux. Ces résultats suggèrent que les tourbières de
51
dépression sont davantage dépendantes des conditions de recharge et pourraient être plus
52
vulnérables aux changements d’occupation du sol ou aux changements climatiques.
53
Mots-clés
54
Tourbière, aquifère, contexte hydrogéologique, modèle 2D, régime permanent, Modflow
55 56 3 4 5 6 7 8 9 10 11 12 13 14 15 16 17 18 19 20 21 22 23 24 25 26 27 28 29 30 31 32 33 34 35 36 37 38 39 40 41 42 43 44 45 46 47 48 49 50 51 52 53 54 55 56 57 58
For Peer Review Only
1 INTRODUCTION
57
Peatlands are wetlands formed through the accumulation of partially decayed organic
58
matter. They can be fed by groundwater, surface water, precipitation, or by a combination
59
of these. They are often categorized by their main water source as fens
(groundwater-60
sourced) or bogs (precipitation-sourced) (Mitsch and Gosselink 2007). Despite this
61
classification scheme, Sphagnum-dominated peatlands (poor fen to bog) can receive
62
groundwater both laterally or vertically (Drexler et al. 1999, Fraser et al. 2001). The
63
groundwater inflow volumes can be significant for the peatland water budget and for the
64
entire ecosystem (Glaser et al. 1997). Landscape position and local hydrogeological setting
65
influence whether and how a given peatland is connected to a hydrological system (Mitsch
66
and Gosselink 2007, Gilvear and Bradley 2009, Acreman and Holden 2013).
67
There has been a great deal of recent research on peatland development and hydrology. For
68
example, a number of studies have examined the role of geomorphological and
69
hydrogeological setting on peatland development (e.g., Glaser et al. 2004, Loisel et al.
70
2013), on peatland runoff generation (Richardson et al. 2012), and on hydraulic gradients
71
within a peatland (Reeve et al. 2009). Others have focused on simulating flow patterns
72
within peatlands using 2D or 3D groundwater models developed in Modflow (Reeve et al.
73
2000, Fraser et al. 2001, Reeve et al. 2001, Reeve et al. 2006), or using
unsaturated-74
saturated flow models (e.g., Camporese et al. 2006 using the CATHY model). Field-based
75
studies also report flow connections between peatlands and the surrounding mineral
76
deposits (e.g., Devito et al. 1997, Ferone and Devito 2004, Ferlatte et al. 2015), as well as
77
the specific hydrological functions of the peripheral portion of a bog peatland (lagg) (e.g.,
78
Howie and van Meerveld 2013). However, relatively few studies have focused on
79 3 4 5 6 7 8 9 10 11 12 13 14 15 16 17 18 19 20 21 22 23 24 25 26 27 28 29 30 31 32 33 34 35 36 37 38 39 40 41 42 43 44 45 46 47 48 49 50 51 52 53 54 55 56 57 58
For Peer Review Only
understanding how the vertical heterogeneity of peat deposits (demonstrated for example
80
by Holden and Burt (2003) and by Rosa and Larocque (2008)) or the hydrogeological
81
setting, including aquifer properties and stratigraphy, influence aquifer-peatland flow
82
connections. This lack of knowledge weakens the capacity to adequately protect peatlands
83
against external anthropogenic pressures.
84
This study follows those of Larocque et al. (2016), Ferlatte et al. (2015), and Munger et al.
85
(2014), in which the stratigraphy, hydraulic properties, vegetation, chemistry, and
86
hydrogeology of twelve peatlands (six slope and six basin) in two regions of southern
87
Quebec (Abitibi and Centre-du-Quebec) were characterized. These previous studies
88
showed that connections between peatlands and aquifers differred greatly as a function of
89
the hydrogeological settings of the sites. However, for these sites, as well as for other
90
peatlands for which hydrology has been studied and reported in the scientific literature, it
91
is not clear what the geological and hydrological conditions that drive aquifer – peatland
92
connections are. The objective of this study was therefore to elucidate this through the
93
comparison of two peatlands located in constrasting hydrogeological settings, i.e., slope
94
and basin peatlands, assessing how the differing settings influence lateral aquifer–peatland
95
connections.
96
The flow exchanges between peatlands and a surface aquifer, the peatland water budget,
97
and the potential for runoff generation were assessed using 2D steady-state groundwater
98
flow models developed in Modflow (Harbaugh 2005) for one slope and one basin
99
Sphagnum–dominated peatland located in southern Quebec (Canada), in the Abitibi and
100
Centre-du-Quebec regions respectively; these were selected as representative of typical
101
conditions of each setting. Ferlatte et al. (2015) have observed that the selected slope
102 3 4 5 6 7 8 9 10 11 12 13 14 15 16 17 18 19 20 21 22 23 24 25 26 27 28 29 30 31 32 33 34 35 36 37 38 39 40 41 42 43 44 45 46 47 48 49 50 51 52 53 54 55 56 57 58
For Peer Review Only
peatland is fed by the adjacent esker, and that the selected basin peatland feeds the
103
superficial aquifer. With this a priori knowledge, and using the peatland models as
104
benchmarks for comparison purposes, scenarios were developed to study the influence of
105
hydrogeological conditions (recharge, hydraulic conductivity, and material thickness) on
106 aquifer–peatland connections. 107 2 STUDY SITES 108 2.1 Abitibi region 109
The Abitibi region is located 600 km northwest of Montreal, in the province of Quebec,
110
Canada (Figure 1). It is characterized by a relatively low topography and glacial landforms,
111
such as moraines and eskers. Approximately 19% of the region comprises wetlands, most
112
of which are slope peatlands that have developed on esker or moraine slopes (Ducks
113
Unlimited Canada 2009). In addition to the till and glacio-fluvial deposits (eskers and
114
moraines) successively deposited in the region, the plain is covered by a layer of
glacio-115
lacustrine clay resulting from the proglacial Lake Barlow-Ojibway (Nadeau 2011). Clay
116
thickness varies between 1 and 20 m (Cloutier et al. 2013).
117
The site chosen to represent this region is the Saint-Mathieu-Berry peatland (SMB;
118
78o11’W, 48o28’N). Ferlatte et al. (2015) studied six slope peatlands in Abitibi. The head
119
patterns oberved at SMB were representative of the other slope peatlands of the region. Its
120
hydrogeological context has already been well described (Riverin, 2006, Cloutier et al.
121
2013), and the available data are sufficiently complete to build a conceptual model of the
122 site. 123 3 4 5 6 7 8 9 10 11 12 13 14 15 16 17 18 19 20 21 22 23 24 25 26 27 28 29 30 31 32 33 34 35 36 37 38 39 40 41 42 43 44 45 46 47 48 49 50 51 52 53 54 55 56 57 58
For Peer Review Only
SMB is located on the slope of the Saint-Mathieu-Berry esker, which is 120 km long
124
(Riverin, 2006). The esker reaches an elevation of 350 m at the boundary of SMB, and the
125
thickness of the granular esker material (sand and gravel) in the vicinity of the peatland is
126
approximately 55 m (Cloutier et al. 2013). The esker flank is topped with a 7 m-thick clay
127
layer on the eastern half of the profile (Riverin 2006). The peatland is in pristine condition.
128
It is located at the base of the esker slope, and slopes gently (approximately 0.5 %). At its
129
border, SMB is connected to the surface aquifer from which it receives lateral inflow
130
(Ferlatte et al. 2015). Approximately 100 m closer to the centre of the peatland, it lies
131
directly on clay.
132
SMB is characterized by low-shrub heath communities dominated by Chamaedaphne
133
calyculata, Kalmia angustifolia, K. polifolia, and Rhododendron groenlandicum, with a
134
flat, continuous ground cover of Sphagnum mosses (mainly S. angustifolium and S.
135
magellanicum). The herb layer is dominated by Maianthmum trifolium and Carex
136
oligosperma. A sparse cover of Picea mariana is also present, mainly at the margins of the
137
site where the peat deposit is thin (lagg). The vegetation follows a fen-bog gradient from
138
the peatland margin to its center. In 2011, the mean surface water pH along the profile was
139
4.3 ± 0.6 (S. Pellerin, unpubl. data).
140
2.2 Centre-du-Quebec region
141
The Centre-du-Quebec region is located in the southeastern part of the province of Quebec
142
(Figure 1). The Villeroy peatland (71o50’W, 46o24’N) chosen for this stydy is located in
143
the St. Lawrence Lowlands geological region, which is characterized by relatively flat
144
topography. Ice retreat occurred around 12,000 BP in this region, and allowed the marine
145
incursion of the Champlain Sea (Lamarche 2011). There is no clay at the Villeroy peatland,
146 3 4 5 6 7 8 9 10 11 12 13 14 15 16 17 18 19 20 21 22 23 24 25 26 27 28 29 30 31 32 33 34 35 36 37 38 39 40 41 42 43 44 45 46 47 48 49 50 51 52 53 54 55 56 57 58
For Peer Review Only
where the marine sands lie directly on a 1 to 2 m thick till layer. Peatlands occupy
147
approximately 6% of the area (Avard 2013). Between 10,000 and 8,000 BP, high aeolian
148
activity led to the formation of parabolic dunes in the region (Filion 1987), between which
149
the Villeroy peatland developed in a depression to form a basin peatland surrounded by
150
local sand dunes. The site is characterized by water flow from the peatland to the surface
151
aquifer, as is also the case for similar basin peatlands studied in the region (Ferlatte et al.
152
2015). Fine- to medium-grained sand layers above the till reach 10 m thickness in the
153
dunes, but can be as thin as 1 m below the peatland. Similar to the SMB site, the
154
hydrogeological data available for the Villeroy site (Larocque et al. 2013a) are sufficient
155
to build a conceptual model of this peatland.
156
The Villeroy peatland is relatively pristine, with the exception of some artificial drainage
157
in some locations on its periphery. The vegetation of the peatland is similar to that of SMB,
158
and is characterized by shrub heath communities dominated by Chamaedaphne calyculata,
159
Kalmia angustifolia, and Rhododendron groenlandicum, with a Sphagnum mosses blanket
160
(mainly S. angustifolium, S. rubellum, S. magellanicum, S. capillifolium, and S. fuscum) of
161
well-developped hummocks and hollows. The herb layer is dominated by Eriophorum
162
vaginatum subsp. spissum. The margins of the site are dominated by mature Picea mariana,
163
Larix laricina, and Acer rubrum trees, and by decideous shrubs, such as Alnus incana
164
subsp. rugosa and Ilex mucronata. As in SMB, the vegetation follows a fen-bog gradient
165
from the peatland margin to its center. In 2011, the mean surface water pH along the
166
transect was 4.2 ± 0.5 (S. Pellerin, unpubl. data).
167
2.3 Climate and recharge characteristics
168 3 4 5 6 7 8 9 10 11 12 13 14 15 16 17 18 19 20 21 22 23 24 25 26 27 28 29 30 31 32 33 34 35 36 37 38 39 40 41 42 43 44 45 46 47 48 49 50 51 52 53 54 55 56 57 58
For Peer Review Only
Long-term average air temperatures are 1 and 5°C in the Abitibi and Centre-du-Quebec
169
regions respectively (Environment Canada 2014). The long-term average annual
170
precipitation is lower in Abitibi (918 mm) than in Centre-du-Quebec (1193 mm). The
171
proportion of snow precipitation (between November and April) is similar for the two
172
regions; 27% for Abitibi and 24% for Centre-du-Quebec. At the two sites, recharge was
173
estimated using a spatially discretized water budget approach. For SMB, recharge of the
174
esker aquifer is estimated to be 350-400 mm.y-1 (Cloutier et al. 2013), while at Villeroy,
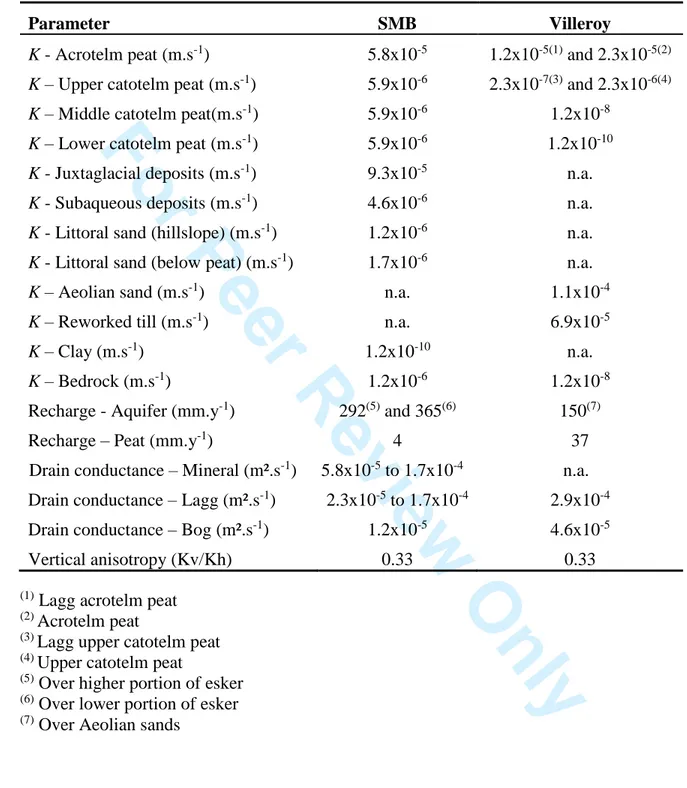
175
recharge of the surface aquifer was estimated to be 240 mm.y-1 (Larocque et al. 2013b).
176
3 METHODS
177
3.1 Available data
178
Between May and November 2011, hydraulic heads were measured monthly in the SMB
179
and Villeroy peatlands (cf. Ferlatte et al. 2015). At both sites, a transect which connects
180
the hillslope with the ombrotrophic section of the peatland, and thus crosses the lagg or the
181
wet minerotrophic zone, was chosen (Figure 2). In each transect, a piezometer was installed
182
in the surface aquifer, within 10 m of the peatland margin (station no. 1), and four to five
183
piezometer nests (stations no. 2 to 6) were installed in the peatland. Whereas only one
184
piezometer was installed in the surface aquifer, nests of two piezometers were installed in
185
the peatland whenever possible. The nests were comprised of a surface piezometer, at a
186
maximum depth of 1.1 m in the peat, and a deep piezometer located at 40 cm below the
187
mineral–peat interface (slotted section in the underlying mineral deposit). No mineral
188
piezometers were installed at stations where peat lies directly on clay in the SMB transect
189
(stations no. 3, 4, and 5). Site topography was available from Riverin (2006) for SMB and
190
Larocque et al. (2013a) for Villeroy. Additional topographical data was acquired using a
191 3 4 5 6 7 8 9 10 11 12 13 14 15 16 17 18 19 20 21 22 23 24 25 26 27 28 29 30 31 32 33 34 35 36 37 38 39 40 41 42 43 44 45 46 47 48 49 50 51 52 53 54 55 56 57 58
For Peer Review Only
differential GPS and LiDAR data by Ferlatte et al. (2015). All the hydraulic heads were
192
referenced to a fixed datum on each transect.
193
At SMB, groundwater flows from the esker to the peatland, and within the peat deposits,
194
toward the peatland outlet and perpendicular to the peatland limit. Head measurements
195
confirm groundwater inflow to the peatland, and no water table mound was observed
196
within the peatland at this site (Figure 4d in Ferlatte et al. 2015). At the Villeroy peatland,
197
a water table mound is observed further inside the peatland, where the thickest peat is
198
located (Larocque et al. 2013a). The water table within the adjacent sand dune is lower
199
than that in the peatland, and groundwater flows out of the peatland (Figure 4k in Ferlatte
200
et al. 2015), perpendicular to the peatland limit. The absence of a groundwater mound in
201
the sand dune is explained by the limited width of this landform and by its highly permeable
202
sand. At SMB, vertical groundwater inflow was observed close to the peatland border, and
203
no vertical groundwater inflow or outflow was observed elsewhere due to the presence of
204
clay below the peatland. Vertical groundwater flow from the peat to the underlying mineral
205
deposits was observed all along the transect at the Villeroy peatland, except for temporarily
206
at station no. 2. Water levels showed small variation and only limited flow reversals during
207
the May-November 2011 monitoring period, implying almost steady-state flow conditions.
208
For the two peatlands, the groundwater inflows to the peatland (lateral or vertical) were
209
confirmed by vegetation and geochemical indicators (Larocque et al. 2016).
210
Site geology was available from existing maps and models (Riverin 2006, Larocque et al.
211
2013b, Cloutier et al. 2013), and was validated by Ferlatte et al. (2015) with on-site
212
identification at each piezometric station. Maximum peat thickness was 2 m on the SMB
213
transect and 5 m on the Villeroy transect. Saturated hydraulic conductivity (K) of inorganic
214 3 4 5 6 7 8 9 10 11 12 13 14 15 16 17 18 19 20 21 22 23 24 25 26 27 28 29 30 31 32 33 34 35 36 37 38 39 40 41 42 43 44 45 46 47 48 49 50 51 52 53 54 55 56 57 58
For Peer Review Only
material was available from field work. For SMB, Riverin (2006) and Cloutier et al. (2013)
215
estimated K values to vary between 4.3x10⁻⁷ to 1.4x10⁻⁴ m.s-1 for littoral sands, from
216
1.6x10⁻⁵ to 1.7x10⁻³ m.s-1 for juxtaglacial deposits, and from 2.3x10⁻⁷ to 5.2x10⁻⁴ m.s-1 for
217
subaquaeous deposits. Larocque et al. (2013b) estimated aeolian sand hydraulic
218
conductivity at Villeroy to vary between 2.9x10⁻⁵ and 2.7x10⁻³ m.s-1. Peat hydraulic
219
properties were obtained from slug tests performed on the piezometric stations (Ferlatte et
220
al. 2015): saturated hydraulic conductivities at SMB reach 5.5x10⁻⁶, 1.1x10⁻⁶, and 6.9x10
-221
7 m.s-1 at depths of 0.5-0.75, 0.75-1, and 1-1.25 m respectively. At Villeroy, hydraulic
222
conductivity in the peat reaches 3.1x10⁻⁵ m.s-1 at 0.5-0.75 m depth. No peat K was
223
measured in the upper 0.5 m (acrotelm). Other studies have reported acrotelm peat K
224
reaching 1x10⁻³ m.s-1 (Rosa and Larocque 2008; southern Quebec). Hydraulic
225
conductivities for the fibric peat generally found in the acrotelm can vary significantly,
226
between 1x10⁻³ and 1x10⁻⁷ m.s-1 (Letts et al. 2000). In this work, it was assumed that
227
acrotelm hydraulic conductivities should be slightly greater than those of the catotelm.
228
3.2 Groundwater flow model
229
Although field measurements were performed on 500 to 600 m long transects, the
230
conceptual model transects were approximately 2000 m for both sites. This length ensures
231
that the profiles include a buffer zone around the measured piezometers, in order to
232
minimize boundary effects. The two-dimensional (2D) vertical transect groundwater flow
233
models were developed in Modflow (Harbaugh 2005), and run in steady-state. The 2D
234
models are simplified representations of the real studied aquifer-peatland interactions, but
235
are considered to be acceptable, given that the flow directions are perpendicular to the
236
peatland boundaries in the two transects. Considering the quasi-constant heads measured
237 3 4 5 6 7 8 9 10 11 12 13 14 15 16 17 18 19 20 21 22 23 24 25 26 27 28 29 30 31 32 33 34 35 36 37 38 39 40 41 42 43 44 45 46 47 48 49 50 51 52 53 54 55 56 57 58
For Peer Review Only
by Ferlatte et al. (2015), steady-state modelling is sufficient to assess the hydrogeological
238
conditions that drive groundwater flow through the peatland boundary. Although this does
239
not exclude flow reversals outside the May to November period during which heads were
240
monitored, it justifies the assumption of summer steady-state flow conditions. The lack of
241
unsaturated peat parameters or water content data with which to represent the flow
242
dynamics above the peat water table also restricted the current work to use of a model in
243
which only the saturated porous media is represented. Using Modflow thus appeared to be
244
the best option for building the two benchmak models to investigate model sensitivity to
245
hydrogeological conditions.
246
At both sites, the transects were discretized with 3.4 m wide cells. For the two models, the
247
top cells follow the known topography. The 2D models are set perpendicular to the
248
hillslopes. At SMB, the esker slope is a dominant topographical feature. The modelled
249
transect therefore adequately represents the flow paths running through the esker and the
250
peatland. The piezometric map of Villeroy confirms that the chosen transect is not affected
251
by other groundwater flow paths (Larocque et al. 2013a), and it is assumed that there is
252
negligible flow perpendicular to the cross sections. In both cases, a 3D representation of
253
the system is thus not considered to be necessary at the transect locations. Since the
254
simulations are performed in steady-state, the results reflect average flow conditions.
255
The SMB model starts from the esker crest (watershed divide, left boundary) and ends in
256
the ombrotrophic peatland (right boundary; Figure 2a). Vertically, each column was
257
divided into 50 layers where the bottom 46 layers are of equal thickness and the top four
258
layers have half the thickness to provide flexibility to test the vertical heterogeneity of
259
hydraulic properties within the peatland. The top layer represents acrotelm peat, while the
260 3 4 5 6 7 8 9 10 11 12 13 14 15 16 17 18 19 20 21 22 23 24 25 26 27 28 29 30 31 32 33 34 35 36 37 38 39 40 41 42 43 44 45 46 47 48 49 50 51 52 53 54 55 56 57 58
For Peer Review Only
following layers represent catotelm peat (maximum of four acrotelm layers where the peat
261
deposit is thickest). Along the profile, the upper layer cells vary between 0.35 and 0.41 m
262
thickness, while cells in deeper layers vary between 0.7 m at the right boundary (where the
263
profile thickness equals 33.3 m) and 1.3 m under the top of the esker (where the profile
264
thickness equals 62.8 m). This vertical distribution provides an adequate representation of
265
all materials, including the thin layer of littoral sand.
266
The Villeroy model starts on a sand dune (watershed divide, left boundary) and, similar to
267
SMB, ends in the ombrotrophic peatland (right boundary; Figure 2b). It includes a small
268
internal sand dune, to the left of which shallow organic deposits are found (approximately
269
0.50 m thickness; Larocque et al. 2013a). The instrumented Villeroy peatland is located to
270
the right of this sand dune. Each column of the Villeroy model is devided into 34 layers of
271
equal thickness. The cell thickness varies between 0.4 m at the right boundary (where the
272
profile thickness equals 13.4 m) and 0.5 m at the internal sand dune (where the profile
273
thickness equals 18.4 m). This cell size was chosen to represent the thin layer of aoelian
274
sand underlying the peat. The top layer represents acrotelm peat, and the catotelm can reach
275
nine layers where the peat is thickest.
276
Constant heads were set at the outflow limit of the two transects (right boundary). This
277
choice is justified by the stability of measured heads during the 2011 monitoring period.
278
At SMB, constant heads represents the peatland outlet, while at the Villeroy site they
279
represent the water table mound observed further inside the peatland. The large distance
280
between this boundary and the aquifer – peatland interface is considered sufficient for the
281
boundary condition to have limited influence on the results. The bottom and hillslope
282
boundaries are set as no-flow limits (see Figure 2). Features called ‘drains’ were added at
283 3 4 5 6 7 8 9 10 11 12 13 14 15 16 17 18 19 20 21 22 23 24 25 26 27 28 29 30 31 32 33 34 35 36 37 38 39 40 41 42 43 44 45 46 47 48 49 50 51 52 53 54 55 56 57 58
For Peer Review Only
the top of the upper peatland cells (in the acrotelm) to export excess water out of the
284
transect. These drains are considered to be analogous to water flowing toward surface
285
outlets that are not represented in the 2D transects. For this reason, they are considered to
286
be a surrogate for subsurface flow perpendicular to the peatland transect that becomes
287
surface flow (or runoff). Drains are also used on the top of a limited number of mineral
288
cells located immediately to the left of the peatland, to represent springs that are frequently
289
observed at the break of the esker slope in the region (Veillette et al. 2007).
290
Average hydaulic heads measured at each piezometer from May to November 2011 by
291
Ferlatte et al. (2015) were used to calibrate the models. It is acknowledged that using heads
292
as the only calibration target (compared to also using fluxes and geochemical variables)
293
increases the non-uniqueness of the manual calibration process. However, this approach is
294
considered sufficient here, since the peatland models are used as benchmarks to understand
295
the influence of hydrogeological settings.
296
Hydraulic conductivities and recharge values were calibrated manually to reproduce
297
measured hydraulic heads. Intervals for recharge values on the inorganic deposits were
298
estimated using a water budget approach (Larocque et al. 2013b, Cloutier et al. 2013), i.e.,
299
recharge is calculated as a moisture surplus and evapotranspiration is not directly included
300
in the models. Intervals for possible peatland recharge are not available from the literature,
301
but values were calibrated to be lower than aquifer recharge due to the limited storage
302
capacity of the unsaturated zone (shallow water table depth at the two sites, see Ferlatte et
303
al. 2015). Recharge was set on the highest active cell. Since no information on the vertical
304
anisotropy ratio (i.e., Kv/Kh) was available at the study sites, a single value of 0.33 was
305
used for all materials (vertical anisotropy was not calibrated). This value was a compromise
306 3 4 5 6 7 8 9 10 11 12 13 14 15 16 17 18 19 20 21 22 23 24 25 26 27 28 29 30 31 32 33 34 35 36 37 38 39 40 41 42 43 44 45 46 47 48 49 50 51 52 53 54 55 56 57 58
For Peer Review Only
between the commonly used 0.1 ratio for inorganic materials and a somewhat higher ratio
307
reported for organic deposits (e.g., Rosa and Larocque 2008). Drain conductance was
308
calibrated to be higher in the lagg area than in the rest of the peatland in order to represent
309
the shallower water table depths in this portion of the peatlands.
310
3.3 Sensitivity analysis
311
For each model, several simulations were performed to assess the sensitivity of the
312
simulated hydraulic heads to variations in recharge (50 to 150% of the calibrated value),
313
sand hydraulic conductivity (1-1000% of the calibrated value), peat hydraulic conductivity
314
(25-400% of the calibrated value), as well as peat and inorganic material vertical anisotropy
315
(0.1-1).
316
To quantify the sensitivity of runoff (drain) fluxes to changes in recharge, sand hydraulic
317
conductivity (i.e., subaqueous deposits at SMB and aeolian deposits at Villeroy), peat
318
hydraulic conductivity, peat anisotropy, and anisotropy of all the mineral deposits, a
319
relative sensitivity coefficient Sr was calculated:
320
𝑠𝑟= (𝑂−𝑂𝑐𝑎𝑙)(𝐼−𝐼𝑐𝑎𝑙)𝑂𝑐𝑎𝑙 𝐼𝑐𝑎𝑙
(2)
321
where O is the value of the output (proportion of water flowing as runoff in the drains)
322
after modification of a parameter, Ocal is the value of the output in the calibrated simulation,
323
I is the parameter value taken for the sensitivity analysis, and Ical is the parameter value in
324
the calibrated simulation.
325
Additionally, tests were performed to assess the effect of an increased sand thickness below
326
the organic deposits on hydraulic heads, and therefore on aquifer–peatland connections.
327 3 4 5 6 7 8 9 10 11 12 13 14 15 16 17 18 19 20 21 22 23 24 25 26 27 28 29 30 31 32 33 34 35 36 37 38 39 40 41 42 43 44 45 46 47 48 49 50 51 52 53 54 55 56 57 58
For Peer Review Only
The sand thickness was increased by 0.8, 1.6, and 2.4 m at SMB and by 0.9, 1.8, and 2.7 m
328
at Villeroy, to reflect the uncertainty on the actual stratigraphy at the two sites.
329
The effect of the vertical variation of hydraulic conductivity of the catotelm peat layers
330
was also assessed. Some simulations were run with a constant K throughout the catotelm
331
layers (homegenous profile), using different K values, while others used different,
332
decreasing K profiles with depth for the three catotelm zones. The influence of the
333
hydraulic conductivity distribution in the catotelm zones on the runoff fluxes is quantified
334
using a heterogeneity index, HET:
335 𝐻𝐸𝑇 = log ( ∑ ( 𝐾𝑖 𝐾𝑖+1) 𝑛−1 𝑖=1 𝑛−1 ) (1) 336
where Ki is the hydraulic conductivity of the catotelm layers, and n is the number of
337
catotelm layers. A null value represents a homogeneous catotelm with only one K, and high
338
values indicate drastic decreases in K with depth.
339
4 RESULTS
340
4.1 Current flow conditions
341
4.1.1 SMB peatland
342
In order to adequately represent the measured heads, hydraulic conductivities were
343
calibrated to 9.3x10⁻⁵ m.s-1 for the juxtaglacial deposits, 4.6x10⁻⁶ m.s-1 for subaquaeous
344
deposits, 1.2x10⁻⁶ to 1.7.10-6 m.s-1 for littoral sand, and 1.2x10⁻¹⁰ m.s-1 for clay (Table 1).
345
The acrotelm and catotelm peat K were calibrated to 5.8x10⁻⁵ and 5.9x10⁻⁶m.s-1
346
respectively. These values are slightly higher than those measured by Ferlatte et al. (2015),
347 3 4 5 6 7 8 9 10 11 12 13 14 15 16 17 18 19 20 21 22 23 24 25 26 27 28 29 30 31 32 33 34 35 36 37 38 39 40 41 42 43 44 45 46 47 48 49 50 51 52 53 54 55 56 57 58
For Peer Review Only
but are within literature values (e.g., Rosa and Larocque 2008). The bedrock hydraulic
348
conductivity was calibrated to 1.2x10⁻⁶ m.s-1, which is similar to the median value of
349
2.1x10⁻⁶ m.s-1 from Cloutier et al. (2013).
350
The recharge rates on the upper and lower sections of the SMB esker were calibrated to be
351
365 and 292 mm.y-1, i.e. values representative of an esker environment (Cloutier et al.
352
2013). The calibrated recharge over the organic deposits was 4 mm.y-1. This small flux of
353
water reaching the saturated peat reflects the fact that the water table depth is close to the
354
surface (on average 0.11 m below the surface; Ferlatte et al. 2015), a situation which
355
provides limited storage for water input from the surface. To represent runoff, drain
356
conductance was calibrated between 2.3x10⁻⁵ to 1.7x10⁻⁴ m².s-1 in the mineral and in the
357
lagg portions of the peatland, and reaches 1.2x10⁻⁵ m².s-1 within the peatland. These
358
decreasing values from the lagg to the bog reflect decreasing lateral runoff conditions
359
toward the interior of the peatland.
360
Simulated hydraulic heads at the piezometers were in good agreement with average
361
measured values (Figure 3a). The mean absolute error (MAE) on heads was 0.08 m, and
362
the maximum error was 0.23 m, at station no. 5. The simulated hydraulic head at the
363
western limit of the profile is 332 m, a value similar to that estimated by Riverin (2006),
364
of 330 m. The general flow pattern showed that the surface aquifer feeds the peatland and
365
flows in the subaquaeous and juxtaglacial deposits below the clay (Figure 4a). Clay
366
constrains the vertical circulation of water from the aquifer, and leads groundwater flow
367
toward the surface between stations no. 1 and 2.
368 3 4 5 6 7 8 9 10 11 12 13 14 15 16 17 18 19 20 21 22 23 24 25 26 27 28 29 30 31 32 33 34 35 36 37 38 39 40 41 42 43 44 45 46 47 48 49 50 51 52 53 54 55 56 57 58
For Peer Review Only
The SMB peatland water budget (Table 2) indicated that most of the water input to the
369
peatland transect flows in as lateral groundwater inflow through the peatland-littoral sand
370
connection. This reflects the geomorphic position of this slope peatland, which is strongly
371
connected to the surface esker aquifer at the slope break. The vertical groundwater inflow
372
to the peatland was very limited, except near the peatland edge, where clay is absent. This
373
is similar to obsevations made in the same area by Ferlatte et al. (2015) with heads and by
374
Larocque et al. (2016) with vegetation and total dissolved solids indicators. This flow
375
pattern is also analogous to what is observed in esker slope peatlands in Finland (Laitinen
376
et al. 2007). Water percolates out of the peatland where the underlying mineral deposits
377
become permeable, starting at station no. 6. Monthly measurements of hydraulic gradients
378
at this station have shown vertical groundwater outflow at six out of seven sampling dates
379
during the May-November 2011 field season (Ferlatte 2013). Almost all of the peatland
380
outflow occured through the drains that represent subsurface flow perpendicular to the
381
peatland transect, which later becomes runoff toward the peatland outlet. There is a small
382
flow out of the peatland through the constant heads located at the right boundary.
383
4.1.2 Villeroy peatland
384
For the Villeroy peatland, it was necessary to include lateral and vertical heterogeneity in
385
peat hydraulic conductivity to reproduce the measured hydraulic heads. Between stations
386
no. 1 and 2 (i.e., in the lagg), peat hydraulic conductivities were divided into two vertical
387
zones, and K values were calibrated to 1.2x10⁻⁵ and 2.3x10⁻⁷ m.s-1 for the acrotelm and
388
catotelm respectively. From stations no. 2 to 3, four peat zones were defined (one for the
389
acrotelm and three for the catotelm), and hydraulic conductivities were calibrated to
390
2.3x10⁻⁵ m.s-1 in the acrotelm and to between 2.3x10⁻⁶ and 1.2x10⁻¹⁰ m.s-1 in the catotelm.
391 3 4 5 6 7 8 9 10 11 12 13 14 15 16 17 18 19 20 21 22 23 24 25 26 27 28 29 30 31 32 33 34 35 36 37 38 39 40 41 42 43 44 45 46 47 48 49 50 51 52 53 54 55 56 57 58
For Peer Review Only
Although they compared relatively well, calibrated hydraulic conductivities were higher in
392
the acrotelm and lower in the catotelm than those measured by Ferlatte et al. (2015). The
393
calibrated values nevertheless correspond those reported in the literature. In order to
394
capture the hydraulic head pattern observed in the underlying mineral deposits, the till K
395
was calibrated to 6.9x10⁻⁵ m.s-1, a value typical for reworked till. The bedrock hydraulic
396
conductivity was very low, 1.2x10⁻⁸ m.s-1, and similar to regional values from (Larocque
397
et al. 2013b).
398
Recharge over the aeolian sand was calibrated to be 150 mm.y-1, a value somewhat lower
399
than the regional recharge estimated by Larocque et al. (2013b). Recharge over the
400
peatland was 37 mm.y-1. This value was larger than the one estimated at SMB, possibly
401
due to the deeper water table, which provides more storage in the unsaturated zone (on
402
average 0.20 m below the surface at Villeroy; Ferlatte et al. 2015). Drain conductance was
403
calibrated to 2.9x10⁻⁴ m².s-1 in the lagg portion and 4.6x10⁻⁵ m².s-1 within the peatland, i.e.
404
similar to the values calibrated at SMB.
405
The calibrated model provides simulated hydraulic heads in good agreement with observed
406
heads, with a MAE of 0.05 m and a maximum error of 0.12 m for the surface piezometer
407
at station no. 5 (Figure 3b). From the water divide located near station no. 4, water flows
408
toward the shallow peat layers located between the dunes (Figure 4b). In the lagg portion,
409
water flows from the peatland toward the aquifer, and reaches the shallow peat layers
410
located between the dunes before finally leaving the system through the drains, which
411
represent lateral outflow to runoff. Left of the water divide, water flowed through the peat
412
layers laterally toward the center of the peatland.
413 3 4 5 6 7 8 9 10 11 12 13 14 15 16 17 18 19 20 21 22 23 24 25 26 27 28 29 30 31 32 33 34 35 36 37 38 39 40 41 42 43 44 45 46 47 48 49 50 51 52 53 54 55 56 57 58
For Peer Review Only
The Villeroy peatland water budget showed that all the water input to the peatland reaches
414
the peat deposits through recharge, while lateral and vertical groundwater inflows to the
415
peatland were nonexistent. Outflow from the peatland occurs principally through runoff
416
(drains). Because of the presence of permeable deposits below the peatland, approximately
417
one third of the outflow moved vertically from the peat deposits, and only limited lateral
418
outflow was simulated through the left side limit toward the sand, or through the constant
419
head boundary. These flow directions are similar to those reported by Ferlatte et al. (2015)
420
and by Larocque et al. (2016). They are also in agreement with the water budget assessment
421
performed in the Clara Bog (Ireland), where 95% of the outflow occurred via surface water
422
(Rydin and Jeglum 2013).
423
4.2 Sensitivity of hydraulic heads and of lateral flows
424
The sensitivity analysis showed that hydraulic heads, and therefore lateral groundwater
425
inflows, reacted very little when changing flow parameters in the SMB slope peatland
426
(Figure 5). The presence of lateral groundwater inflow was unchanged for all tested
427
scenarios. When subjected to a change in recharge or K of the subaqueous sand (Figures 5a
428
and 5b), hydraulic heads at SMB were most sensitive at station no. 1, which is located in
429
the surface aquifer. Heads were almost completely insensitive to changes in recharge or
430
sand K at stations no. 2 to 6, indicating that these parameters are not the major drivers of
431
head patterns in this slope peatland. All the hydraulic heads (and lateral flows) showed
432
very limited sensitivity to peat hydraulic conductivity (Figure 5c), including hydraulic
433
heads at station no. 1 in the esker. Similar results were observed for the anisotropy of peat
434
deposits (Figure 5e). Decreasing the vertical anisotropy of the mineral deposits increased
435 3 4 5 6 7 8 9 10 11 12 13 14 15 16 17 18 19 20 21 22 23 24 25 26 27 28 29 30 31 32 33 34 35 36 37 38 39 40 41 42 43 44 45 46 47 48 49 50 51 52 53 54 55 56 57 58
For Peer Review Only
hydraulic heads in the surface aquifer deposits, and thus increased lateral inflows
436
(Figure 5d).
437
The Villeroy peatland was more sensitive to variations in all of the tested parameters
438
(Figure 6). At Villeroy, a 50% increase in recharge led to higher heads, with a maximum
439
at station no. 4, creating a water divide within the peatland (Figure 6a). This means that
440
when sufficient recharge is available, peatland groundwater flows toward the aquifer and
441
toward the rest of the peatland. Decreasing recharge caused a lowering of peatland
442
hydraulic heads and reduced peatland outflow to the surface aquifer. Variations in
443
hydraulic conductivity of the aeolian sand deposits showed similar results within the
444
peatland (Figure 6b). A decrease in sand hydraulic conductivity led to significantly higher
445
heads in the deep piezometers, particularly in the lagg portion of the transect. Peatland
446
outflow was therefore sensitive to the hydraulic properties of the adjacent surface aquifer.
447
Villeroy head patterns were also sensitive to changes in peat hydraulic conductivity
448
(Figure 6c), with the greatest effect on heads coinciding with peat K between 50 and 200%
449
of the calibrated values. Hydraulic heads at station no. 1 were only slightly affected by
450
decreased peat hydraulic conductivities, suggesting that the presence of peat has only a
451
limited effect on the surface aquifer heads. Changes in peat anisotropy at Villeroy
452
(Figure 6d) showed that the head pattern responds similarly to changes in peat hydraulic
453
conductivity, whereas changes in vertical anisotropy of the underlying material layers had
454
a very limited influence on the hydraulic heads and lateral fluxes (Figure 6e).
455
4.3 Sensitivity of exported fluxes from the peat surface
456
Consideration of the model sensitivity to runoff (drained) fluxes was useful to understand
457
which parameters drive peatland outflow through lateral subsurface flow. The two sites
458 3 4 5 6 7 8 9 10 11 12 13 14 15 16 17 18 19 20 21 22 23 24 25 26 27 28 29 30 31 32 33 34 35 36 37 38 39 40 41 42 43 44 45 46 47 48 49 50 51 52 53 54 55 56 57 58
For Peer Review Only
had highly contrasted sensitivities for all tested parameters, with Sr values significantly
459
lower at SMB than at Villeroy (Figure 7). In all cases, the average Sr values were less than
460
one, meaning that a 1% change in a given parameter generated a change smaller than 1%
461
in runoff fluxes (note that the average is calculated from absolute values of Sr, which means
462
that the increase/decrease effect is not considered). This suggests that the two models are
463
not overly sensitive to any given parameter.
464
A change in recharge had the largest effect on runoff fluxes at SMB, but this effect was
465
much smaller than at Villeroy. This can be explained by the small portion of the total water
466
inflow (2%) represented by recharge at SMB, while recharge was the only water inflow at
467
Villeroy. At Villeroy, changes in sand hydraulic conductivity had a relatively small impact
468
on the runoff fluxes when sand K is high (i.e., one to two orders of magnitude higher than
469
the calibration value). However, low sand K led to a higher proportion of runoff fluxes. At
470
the two sites, when peat K decreases, runoff fluxes increased and vice-versa. Peat K had
471
the largest effect on the proportion of runoff fluxes at Villeroy. Anisotropy of the organic
472
deposits had almost no effect on runoff fluxes at SMB. This parameter had a larger impact
473
at Villeroy; however, the impact was the smallest of all tested parameters. The anisotropy
474
of the mineral deposits had a very small effect on the proportion of runoff fluxes at the two
475
sites.
476
4.4 Response of lateral flows to hydrogeological conditions
477
Results show that increasing the thickness of the sand layer located below the peat (littoral
478
sand in SMB, Figure 8a; aeolian sand in Villeroy, Figure 8b) decreased hydraulic heads in
479
the peatland at the two sites, and decreased hydraulic heads in the underlying mineral
480 3 4 5 6 7 8 9 10 11 12 13 14 15 16 17 18 19 20 21 22 23 24 25 26 27 28 29 30 31 32 33 34 35 36 37 38 39 40 41 42 43 44 45 46 47 48 49 50 51 52 53 54 55 56 57 58
For Peer Review Only
deposits at Villeroy. At SMB, this lowering of heads was perceptible in the first 100 m of
481
the transect, where it reduced hydraulic gradients and induced smaller groundwater inflow
482
from the aquifer. The effect was perceptible throughout the transect at Villeroy (except at
483
station no. 5), where it reduced peatland outflows to the aquifer, while vertical gradients
484
remained relatively unchanged. An additional experiment performed for SMB showed that
485
replacing the clay layers with sand generated a similar model response (results not shown),
486
suggesting that the clay contributed little to maintaining or increasing water inflow to the
487
peatland at this site.
488
At SMB, the scenarios with decreasing catotelm K had no effect on the proportion of water
489
leaving the peatland through runoff. The results were therefore not included in Figure 9. In
490
the Villeroy peatland, when the HET index increased, the proportion of water exported
491
through runoff increased substantially (Figure 9). The runoff fluxes also increased when
492
the mean log K decreased. Interestingly, when the catotelm K was constant (HET = 0), a
493
decrease in hydraulic conductivity did not significantly influence the proportion of runoff
494
fluxes via the drains, which remained low, at between 0 and 3%.
495
5 DISCUSSION
496
5.1 Implications for peatland inflows and outflows
497
At SMB, the head pattern was highly resilient to changes in hydrogeological conditions at
498
all stations between no. 2 and 6. In particular, the sand layer thickness and the presence of
499
clay showed only limited effects on the hydraulic heads and on the lateral groundwater
500
inflow to the peatland. This suggests that the geomorphic position of this peatland imposes
501
a major control on the head patterns. The water budget of the SMB slope peatland thus
502
depends on the esker hydrogeology. Nevertheless, results have shown that a reduction in
503 3 4 5 6 7 8 9 10 11 12 13 14 15 16 17 18 19 20 21 22 23 24 25 26 27 28 29 30 31 32 33 34 35 36 37 38 39 40 41 42 43 44 45 46 47 48 49 50 51 52 53 54 55 56 57 58
For Peer Review Only
recharge or the presence of highly permeable material in the esker aquifer could reduce
504
lateral groundwater inflows. Although they might not significantly affect the entire
505
peatland, such changes could modify the lagg portion of the peatland ecosystem.
506
At Villeroy, peatland hydraulic heads and hydraulic heads in the underlying mineral
507
deposits varied substantially at all stations except station no. 5. This suggests that the lateral
508
aquifer-peatland connections mainly occur within the first hundreds of meters from the
509
peatland border (for Villeroy, between stations no. 1 to 4). This is in agreement with the
510
work of Howie and van Meerveld (2013) who highlighted the variety of hydrological and
511
hydrochemical gradients in such so-called transition zones.
512
In contrast with the SMB slope peatland, the Villeroy peatland provided water to the
513
surface aquifer. The peatland lateral outflow toward the surface aquifer was relatively
514
small, but peatland hydraulic heads probably contributed to maintaining water levels in the
515
adjacent sand. The impact was likely small locally, but could be important in an area with
516
substantial peatland coverage. The low sensitivity coefficients of runoff (drain) fluxes to
517
recharge in the SMB slope peatland suggests a strong dominance of horizontal flow in this
518
type of peatland. In the Villeroy basin peatland, increased recharge was redirected toward
519
the runoff fluxes, and thus out of the peatland. In real world conditions, this could be linked
520
to increased flood events at the peatland outlet. However, the runoff (drain) fluxes probably
521
include a component of evapotranspiration drainage. In this case, the actual flux out of the
522
transects through the drains would be lower than the values obtained with the model. It is
523
important to underline that changes in recharge, and the resulting increase or decrease of
524
the peat water table, can have important short- or long-term effects on peatland vegetation,
525
which could in turn contribute to modifying the exchanged fluxes and the flow directions
526 3 4 5 6 7 8 9 10 11 12 13 14 15 16 17 18 19 20 21 22 23 24 25 26 27 28 29 30 31 32 33 34 35 36 37 38 39 40 41 42 43 44 45 46 47 48 49 50 51 52 53 54 55 56 57 58
For Peer Review Only
between a peatland a neighboring surface aquifer (e.g. Siegel 1988, Glaser et al. 1997,
527
Laitinen et al. 2005).
528
5.2 Effect of peat heterogeneity
529
To adequately calibrate the Villeroy model, it was necessary to introduce lateral peat K
530
heterogeneity in the lagg portion of the transect. This suggests that this portion of the basin
531
peatland helps to maintain the water table in the organic deposits, as well as in the aquifer.
532
Lower hydraulic conductivities in peatland margins are reported in the literature in
533
connection with the fact that the lagg peat is more decomposed, similar to the catotelm peat
534
found elsewhere in the peatland (Howie and Tromp-van Meerveld 2011). According to
535
Baird et al. (2008), this could contribute to maintaining wetter conditions in the central
536
area of a bog by restricting lateral subsurface water flow. Interestingly, lateral
537
heterogeneity in peat K was not necessary to correctly simulate the hydraulic heads of the
538
SMB slope peatland, possibly due to the large head gradient and resulting lateral
539
groundwater inflow between stations no. 1 and 2.
540
Results indicated that the lower K peat layer at the base of the Villeroy basin peatland was
541
a key parameter controlling fluxes at the site and toward its margins, acting similarly to
542
clay layers and isolating the organic deposits from groundwater fluxes. This suggests that
543
the nature and level of decomposition or compaction of the deep peat layers should be
544
taken into account when studying the connections between basin peatlands and aquifers.
545
This also suggests that peatlands with different levels of vertical decomposition could have
546
contrasting connections with the aquifer and runoff potential.
547 3 4 5 6 7 8 9 10 11 12 13 14 15 16 17 18 19 20 21 22 23 24 25 26 27 28 29 30 31 32 33 34 35 36 37 38 39 40 41 42 43 44 45 46 47 48 49 50 51 52 53 54 55 56 57 58
For Peer Review Only
Surprisingly, vertical K heterogeneity had no observable effect in the SMB slope peatland,
548
where a decreasing catotelm K did not usually reduce infiltration within the peatland, and
549
provided no additional water to runoff fluxes (drains). These results reinforce the
550
observation that this type of peatland is characterized by dominant horizontal flow. It is
551
likely that the presence of the clay layer below the peatland already fully constrains surface
552
flow export, and that no additional effect is added by increasing vertical K heterogeneity.
553
5.3 Limitations to the approach
554
The modelling choices (2D, steady-state, no representation of unsaturated flow) made in
555
this study were based on the available data and on the project objectives. Using a 2D
556
representation of groundwater flow on the simulated transects necessarily implied that all
557
flow is in the direction of the transect (perpendicular to the peatland limit). This assumption
558
is reasonable in the benchmark peatlands, and is adapted to the purpose of the study, which
559
required simple benchmark models. However, this representation inherently simplifies the
560
real 3D flows that occur within peatland complexes (e.g., Reeve et al. 2001) by assuming
561
that all flow is in the same direction, regardless of the location within the peat column. This
562
assumption probably does not have much impact for the deep peat layers, where peat
563
hydraulic conductivity is low. The “drained” flows simulated on the two transects indicate
564
that the top high-K peat layers can redirect flow in other directions. The 2D models were
565
built on the assumption that these flows immediately become surface runoff. However, it
566
remains to be demonstrated what the proportion of ET in these fluxes is, how long the
567
“true” runoff water can migrate laterally as surface flow, and whether or not it can
re-568
infiltrate further in the peatland.
569 3 4 5 6 7 8 9 10 11 12 13 14 15 16 17 18 19 20 21 22 23 24 25 26 27 28 29 30 31 32 33 34 35 36 37 38 39 40 41 42 43 44 45 46 47 48 49 50 51 52 53 54 55 56 57 58
For Peer Review Only
Using a steady-state model, assuming that all flow conditions are stable throughout the
570
year, overrides water table variations that can occur during the year in the superficial
571
aquifer and within the peatland. These variations probably induce flows of changing
572
intensity between the aquifer and the peatland. Ferlatte et al. (2015) have shown that these
573
variations were small enough to conclude that lateral flow reversals were not observed
574
during the summer 2011 measurement period. These authors observed only limited
575
reversals of vertical flow connections between the underlying mineral deposits and the peat
576
deposits. Because of a lack of evidence of varying flow directions throughout the year, it
577
was considered unnecessary to investigate transient-state conditions in the two benchmark
578
models. However, it is acknowledged, as reported in other studies, that head variations can
579
be large enough to induce flow reversals (Reeve et al. 2006), and thus necessitate a
580
transient-state model. It is expected that flow reversals would be more frequent in basin
581
peatlands than in slope peatlands, where groundwater flows are much less sensitive to
582
hydrogeological conditions.
583
Chosing a saturated flow model, such as Modflow, was based on the hypothesis that the
584
response of peat deposits to rainfall and evapotranspiration is instantaneous and
585
unidirectional (no hysterisis). Although the unsaturated peat layer can be relatively thin,
586
flows in this top portion of the peatland can play an important role in peat swelling and
587
shrinking (e.g. Camporese et al. 2006). The simplified approach for two benchmark
588
peatlands used in this study, and the absence of unsaturated peat water contents or hydraulic
589
parameters, did not justify using a model combining unsaturated and saturated flows.
590
However, it is acknowledged that the hydrology of the unsaturated peat can have a
591
significant impact on plant growth and peat decomposition during short- or long-term dry
592 3 4 5 6 7 8 9 10 11 12 13 14 15 16 17 18 19 20 21 22 23 24 25 26 27 28 29 30 31 32 33 34 35 36 37 38 39 40 41 42 43 44 45 46 47 48 49 50 51 52 53 54 55 56 57 58
For Peer Review Only
periods, or in conditions where the organic deposits are artificially drained to lower the
593
water table (e.g. Clymo 1984, Price et al. 2003, Waddington et al. 2015).
594
5.4 Significance for other peatlands
595
The SMB slope peatland is considered to be representative of the Abitibi esker slope areas,
596
and of other nordic countries where eskers and clay plains are found. The results of the
597
sensitivity analysis, and specifically of the sand layer thickness experiment, showed that
598
lateral groundwater inflow from the esker can be present even when the mineral deposits
599
underlying the peat are permable. Although the absence of clay could induce vertical
600
outflow from the peatland to the underlying permeable deposits, this confirmed that the
601
clay layer was not necessary for the formation or maintenance of slope peatlands. Results
602
from this study could therefore be extended to other esker and moraine slope peatlands in
603
the Abitibi region, where no clay is present (Ferlatte et al. 2015), and in other regions where
604
peatlands have developed on eskers, such as in Ireland (e.g. Pellicer and Gibson 2011),
605
Finland (e.g. Rossi et al. 2014) or Russia (e.g. Demidov et al. 2006). Because of this strong
606
aquifer–peatland connection, the long-term resilience of esker slope peatlands therefore
607
depends on the management and protection of the esker aquifer.
608
The geomorphic position of the Villeroy peatland is characteristic of other basin peatlands
609
in the St. Lawrence region, and is representative of some basin peatlands in glaciated
610
geological environments (i.e., having developed in sandy depressions underlain by low
611
permeability till or clay). The basin peatlands similar to the Villeroy site which have lateral
612
groundwater outflow influence aquifer recharge and groundwater levels in their vicinity.
613
Results from this study showed that, in this case, aquifer–peatland connections with a
614
surface aquifer and their runoff potential can be highly sensitive to local hydrogeological
615 3 4 5 6 7 8 9 10 11 12 13 14 15 16 17 18 19 20 21 22 23 24 25 26 27 28 29 30 31 32 33 34 35 36 37 38 39 40 41 42 43 44 45 46 47 48 49 50 51 52 53 54 55 56 57 58
For Peer Review Only
conditions, and could vary significantly between otherwise similar sites. These connections
616
are more susceptible to changes in land use (e.g. drainage) and climate (e.g. recharge) than
617
those of a slope peatland. It is important to note that Ferlatte et al. (2015) have also shown
618
that basin peatlands can also receive lateral groundwater inflow, and that a combination of
619
inflow and outflow zones within a given basin peatland have also been observed (Avard
620
2013).
621
6 CONCLUSION
622
The objective of this research was to better understand how hydrogeological conditions
623
influence aquifer–peatland connections in slope and basin Sphagnum-dominated peatlands.
624
Groundwater flow models were used to reproduce typical aquifer–peatland flow
625
connections in a slope peatland and a basin peatland located in Quebec (Canada). The two
626
models adequately simulated measured heads within the peatland and in the underlying
627
mineral deposits, as well as observed groundwater flow directions identifed in previous
628
studies using heads, total dissolved solids, and vegetation indicators. The models served as
629
benchmarks to assess the influence of hydrogeological setting (recharge, hydraulic
630
conductivity, material thickness) on aquifer-peatland connections.
631
Sensitivity analysis of the steady-state 2D flow models showed that the slope peatland
632
model was very robust to variations in all of the tested parameters, with constant laterally
633
inflowing groundwater. This suggests the strong dominance of horizontal flow in this type
634
of peatland, and a water budget highly dependent on that of the adjacent surface aquifer.
635
Nevertheless, a reduction in recharge or the presence of highly permeable material in this
636
aquifer could induce ecosystem changes, especially in the lagg portion of the peatland.
637 3 4 5 6 7 8 9 10 11 12 13 14 15 16 17 18 19 20 21 22 23 24 25 26 27 28 29 30 31 32 33 34 35 36 37 38 39 40 41 42 43 44 45 46 47 48 49 50 51 52 53 54 55 56 57 58