Agro-industrial residues as a unique support in a sand filter to enhance the bioactivity to remove microcystin-leucine aRginine and organics
Pratik Kumar, Heidi Dayana Pascagaza Rubio, Krishnamoorthy Hegde, Satinder Kaur Brar, Maximiliano Cledon, Azadeh Kermanshahi-pour, Sébastien Sauvé, Audrey Roy-Lachapelle, Rosa Galvez-Cloutier
PII: S0048-9697(19)31253-7
DOI: https://doi.org/10.1016/j.scitotenv.2019.03.260
Reference: STOTEN 31470
To appear in: Science of the Total Environment
Received date: 8 January 2019
Revised date: 12 March 2019
Accepted date: 17 March 2019
Please cite this article as: P. Kumar, H.D.P. Rubio, K. Hegde, et al., Agro-industrial residues as a unique support in a sand filter to enhance the bioactivity to remove microcystin-leucine aRginine and organics, Science of the Total Environment,
https://doi.org/10.1016/j.scitotenv.2019.03.260
This is a PDF file of an unedited manuscript that has been accepted for publication. As a service to our customers we are providing this early version of the manuscript. The manuscript will undergo copyediting, typesetting, and review of the resulting proof before it is published in its final form. Please note that during the production process errors may be discovered which could affect the content, and all legal disclaimers that apply to the journal pertain.
ACCEPTED MANUSCRIPT
1
Agro-industrial Residues as a Unique Support in a Sand Filter to Enhance the Bioactivity
to Remove Microcystin-Leucine aRginine and Organics
Pratik Kumara, Heidi Dayana Pascagaza Rubiob, Krishnamoorthy Hegdea, Satinder Kaur Brara,c*, Maximiliano Cledond, Azadeh Kermanshahi-poure, Sébastien Sauvéf, Audrey Roy-Lachapellef,g,
Rosa Galvez-Cloutierh
a
- INRS-ETE, Université du Québec, 490, Rue de la Couronne, Québec, Canada G1K 9A9
b
- Facultad de Ingeniería Departamento de Ingeniería Civil y Agrícola Universidad Nacional de Colombia Bogotá - Colombia
c
-Department of Civil Engineering, Lassonde School of Engineering, York University, North York, Toronto, Ontario, Canada, M3J 1P3
d
- CIMAS (CONICET, UnComa, Rio Negro), Güemes 1030, San Antonio Oeste, Rio Negro, Argentina
Biorefining and Remediation Laboratory, Department of Process Engineering and Applied Science, Dalhousie University, 1360 Barrington Street, Halifax, Nova Scotia B3J 1Z1, Canada
f
- Department of Chemistry, Université de Montréal, Montréal, QC, Canada
g
- Environment and Climate Change Canada, 105 rue McGill, H2Y 2E7, Montréal, QC, Canada
h-
Faculté des Sciences et Génie, Département de génie civil et génie des Eaux, Université Laval, Québec (Québec), Canada.
*
- Corresponding author, E-mail: Satinder.Brar@lassonde.yorku.ca; satinder.brar@ete.inrs.ca
ACCEPTED MANUSCRIPT
2
Abstract
In the past, the versatility of a biosand filter has been successfully checked to counter suspended solids, metals, dissolved organic carbon (DOC), coliforms and other water quality parameters (WQPs) from the drinking water sources. In this study, cyanotoxin in the form of microcystin-LR (MC-microcystin-LR) along with above-mentioned WQPs including nitrate, nitrite, and ammonia are analyzed for their removal using agro-residue based biosand filters (ARSFs) for 49 days (7 cycles). Three different agro-residue materials (ARMs) viz. deinking sludge (DSF), hemp fiber (HFF) and paper-pulp dry sludge (PPF) were used as the support material (top 5 cm) along with sand (49 cm) as the primary filter media to enhance the overall bioactivity. This enhancement in bioactivity is hypothesized to remove more MC-LR, DOC, coliform along with efficient nitrification/denitrification. Native bacterial community isolated from the filtration unit of a drinking water treatment plant (Chryseobacterium sp. and Pseudomonas fragi = X) along with the MC-LR-degrader: Arthrobacter ramosus (which was screened as the best biofilm-former among two other MC-LR-degraders tested) were used to inoculate the filters (all three ARSFs). Overall, DSF performed the best among all the ARSFs when compared to the sand filter (SFI) inoculated with the same bacterial strains (A+X). An increase in the bioactivity for ARSFs, particularly DSF was evident from the DOC removal (44 ± 11 %, 15 % more than SFI), coliform removal (92.7 ± 12.8 %, 24 % more than SFI), MC-LR removal (87 ± 14 %, 13 % more than SFI) and an effective nitrification/denitrification, reducing ammonia, nitrate and nitrite level to below guideline values. Toxic assessment using bioindicator (Rhizobium meliloti) revealed safe filter water only in case of DSF.
Keywords: Microcystin, agro-residues, sand filter, water quality, bioaugmentation
ACCEPTED MANUSCRIPT
3
Toxin-producing cyanobacterial harmful algal blooms (CHABs) are increasing annually and creating havoc in the drinking water system. The most common cyano(toxin) released by these CHABs is microcystins (MCs), where MC-Leucine aRginine is its most prominent variant. Drinking water treatment plant (DWTP) deriving raw water from such sources, if left untreated, can cause liver and nerve disorders in humans, if consumed for a longer period (Falconer et al. 1999). WHO recommends a critical safe concentration of MC to be < 1 μg/L in the drinking water for adults and < 0.3 μg/L for the children (US EPA, 2018).
Various conventional treatment processes have been practiced till date for the MCs-LR removal including ozonation, chlorination, flocculation, etc. with most of the time found effective as well (Nicholson et al. 1994, Pelaez et al. 2011). However, the presence of various environmental components in source water such as natural organic matter (NOMs), metals ions and other recalcitrant compounds makes the overall treatment of MCs ineffective. At different stages of the water treatment process, MCs becomes competitive (with other byproducts) mainly because of the different kinds of bacteria present in the respective units (Kumar et al. 2018 a). Especially the (pre-)ozonation and chlorination byproducts in the form of bromide, formaldehyde and microcystin-chlorinated compounds renders treated water toxic (He et al., 2014). Amidst these, filtration unit holds a great responsibility in MCs removal as it is preceded by pre-ozonation and succeeded by chlorination.
Some studies have shown promise in the MCs removal through a sand filter system (Grützmacher et al. 2002). With the involvement of the biological factor (biofilter), the removal efficiency significantly improved (up to 38 %) for some cyanobacterial metabolites such as geosmin (Mcdowall et al. 2009). Biodegradation process (biosand filter) over adsorption studies (sand filter) has the advantage to produce toxic free MCs degradation too. However, it may be
ACCEPTED MANUSCRIPT
4
considered that the presence of NOMs and the presence of other recalcitrant carbon compounds in the influent water, may hinder the bioactivity in a sand filter responsible for the biodegradation of MCs. Several studies on MC removal involving a suspended growth mechanism of bacterial cells found a negative correlation with the presence of NOMs as well as other carbon sources (Kelley et al. 2017). Thus, there is a need to enhance the bioactivity of the sand material to prolong the activism of the bacterial cells residing in the sand (filtration) media to cope up with the MCs removal along with the presence of other competitive compounds. An increase in the bioactivity will counter for the excess effect posed by different contaminants other than MCs. To the best of author`s knowledge, there is no study carried out involving any support/hybrid material with any common or primary media (sand) that assisted in enhancing the bioactivity, thereby promoting more MC-LR biodegradation (regarding rate, efficiency or breakthrough).
In this study, the use of agricultural waste residue in the form of deinking sludge, hemp fibers1, and pulp and paper waste (microwave treated) (Laadila et al. 2017) have been used as the “top-over” support material in a sand filter. The idea is to utilize these agricultural waste and provide a platform for the bacterial cells to captivate and offer fast biofilm growth that will be prolonged and be more effective than the biofilm formed over sand media in degrading MC-LR and
organics. The global idea is to enhance the bioactivity of the existing filtration unit of the DWTP at Ste-Foy, Quebec City, Canada. To achieve this, the native bacterial strains already existing over the sand media of plant filter along with the MC-degraders were co-cultured and inoculated (discussed in section 2.2 in detail) to check the possibility of an enhanced MC-LR removal than
ACCEPTED MANUSCRIPT
5
the normal process. The idea of using agro-residue materials (as discussed above) is to enhance and prolong the bioactivity of the existing sand filter model.
2. Material and methods
2.1 Chemicals and microorganisms
Microcystin-LR was purchased from Cayman chemicals, (Ann Arbor, Michigan, USA). For measuring the cell viability, 3-(4,5-dimethylthiazol-2-yl)-2,5-diphenyltetrazolium bromide (MTT) was brought from Sigma Aldrich, (Ontario, Canada). All the analytical reagents and chemicals used in preparing the culture media and other nutrient solutions were brought from Fisher Scientific, (Ontario, Canada).
Three known MC-LR degraders: Arthrobacter ramosus (NRRL 3159), Bacillus sp. (NRRL B-14393) and Sphingomonas sp. (NRRL B-59555), positive control for the biofilm forming microorganism: Staphylococcus epidermidis (NRRL: B-14901) and bioindicator used for the toxicity assessment: Rhizobium meliloti (NRRL L-84), were brought from the NRRL Agricultural Research Service (ARS) culture collection.
2.2 Screening of the bacterial strains
Bacterial strains with a potential of MC-LR degradation (experimental details shown in Kumar et al. 2018) were isolated from the native bacterial strains of the filtration unit of the drinking water treatment plant (Chemin-Ste-Foy, Quebec City, Quebec). They were identified as Pseudomonas fragi and Chryseobacterium sp. (combination represented as X) using NCBI BLAST service in
our previous study (Kumar et al. 2018 (a)) and deposited in NCBI GenBank with Acc No. MH150822 and MH150821, respectively. They were also identified as a potent MC-LR degrading microorganism (> 80 % degradation within ten days).
ACCEPTED MANUSCRIPT
6
These native bacterial strains (X) were combined individually with the bacterial strains of genera Arthrobacter (A+X), Bacillus (B+X) and Sphingomonas (S+X) and subjected to screening test in
understanding their ability to form biofilm over the agro-residues (as discussed above). Figure 1(A) shows the schematic representation of the unique set-up that was installed for the same. Sand media was obtained from the filtration unit of the DWTP (Chemin Ste-Foy, Quebec City, Quebec, Canada), finely grinded to obtain an overall effective diameter (D10) of 181 μm and
coefficient of uniformity (Cu) as 2.18 (to minimize any risk of clogging, Cu < 4) (Achak et al.
2009). Around 10 gm of sterile-sand material was filled inside the model column and was supported (not mixed) with respective agro-residues (~ 1 gm) viz. dry deinking sludge (DS), Hemp fiber (HF) and Paper and pulp dried-sludge (PPS) (Figure 1 (A) shows arrangement for DSF only, for others same arrangement was made). 25 mL of inoculum with initial cell concentration of 6 x 10⁷ cells/mL2 in the nutrient media, adjusted to final chemical oxygen demand (COD) concentration of 800 mg/L (nutrient solution recipe mentioned in supplementary file, Table S1 and Table S2) was passed through each model reactor every 6 hours using an auto-dosage pump. The inoculum of three different MC-degraders was passed individually through respective agro-residue supported sand material as described above (total 9 combinations). A replica model column for each of the hybrid material was installed too, as can be seen from Figure 1 (A).
To quantify the cell biomass and cell viability that has grown over the support material3, crystal violet (CV) assay and MTT assay was performed, respectively. In brief, after every 2 days, 4 days and 7 days, the agro-residue material was carefully taken out from each model column and
2 X= MC-degrader, Chryseobacterium sp. and Pseudomonas fragi was taken as 2 x 10⁶ cells/mL (total 6 x 10⁶
cells/mL).
3 Sampling calculations was done according to the weighted method as discussed in the supplementary section with
ACCEPTED MANUSCRIPT
7
mixed well in an aluminum dish to finally draw out 0.1 gram of sample (for experimental pictures, refer supplementary file, Figure S1). The drawn sample is suspended in 1.5 mL of tap water and vortexed for 1-2 minutes to detach the biofilm from the material. The supernatant of 200 μL (containing biocells) was placed inside the well of a 96-well plate in octuplicates (4 each from replica). For CV and MTT assay (4 wells each), 0.1 % w/v CV and 7 mg/10 mL MTT was put inside the designated wells. After an overnight incubation, the stained cells (post-phosphate buffer wash to remove loose cells in case of CV assay) and the formed precipitate (formazan: in case of MTT assay-wells) was dissolved using 300 μL dimethyl sulphoxide (DMSO) to produce a uniform color (blue for CV assay and brown for MTT). Finally, the spectrophotometric reading was obtained at 5504 nm and 5905 nm for MTT and CV assay wells to quantify the cell viability and cell biomass, respectively.
2.3 Optimization of input parameters using central composite design
Overall, A+X was found to be the most compatible bacterial strains, as it achieved better biofilm quantification level (both regarding cell biomass and cell viability, for details, refer to section: 3.1) for all the three agro- residues. Optimization step was further carried to understand the behavior of the column filter under the best possible input physical parameters viz. pH, a critical standby time interval (CSTI)6 and the initial turbidity. Three levels for each input parameters were chosen, pH7: 6,7 and 8; initial turbidity: 10 NTU, 20 NTU and 30 NTU (± 0.5 -1.0 NTU); and CSTI: 1-hour, 2-hour, 4-hour. The desirability for the above experimental design was obtained by simulating several output parameters viz. turbidity removal, total coliform removal,
4 Maximum absorbance was found at 550.9 nm for MTT assay 5 Maximum absorbance was found at 590.3 nm for CV assay 6
CSTI is defined as the maximum time interval of the filter run where different output parameters studied, deliver the best desirability through design of experiment (Design-Expert 7.0). In simple words, it may be considered equivalent to the residence time of filter operation (for more significance of CSTI: refer supplementary section).
ACCEPTED MANUSCRIPT
8
pH change, total organic carbon (TOC), flow rate, dissolved oxygen (DO), MC-LR assay,
electrical conductivity. Design-Expert 7.0 was used for deriving the model equation based on the output results obtained. All the derived model equations have been shown in the supplementary section: Figure S2).
2.4 Sand column experiment
After optimizing the physical input parameters, five different column filters (diameter: 25 mm, thickness: 2 mm and height: 650 mm) were installed in a top-down flow arrangement. Figure 1 (B) shows the schematic representation of the set-up. The filters were named according to the support material that was put at the top of the sterile-sand media (sterile 4-gram dry weight covering 2 cm height). From here on, dry deinking sludge, hemp fiber, and pulp and paper sludge supported over the sand media will be named as DSS filter, HFS filter and PPS filter, respectively. The other two filter column consists only of sand media (no agro-residue as support material inoculated with and without the screened bacterial strains, SFI and SF, respectively). SFI filter can be assumed as a model filter representing the modified8 filtration unit in a drinking water treatment plant (Chemin Ste-Foy, Quebec City, Canada). About 120 mm height was kept for the influent water to stand over the filter media and 40 mm was used for the drainage system at the bottom of the filter column, comprising bigger sand particle size in the range: 2 mm- 4 mm. Rest 480-500 mm height (including 20 mm for agro-residue material) was used as the filter media. A detailed grain size distribution analysis and related calculations for preparing the sand media is mentioned in the supplementary section (Figure S3).
8 Sand as obtained from the filtration unit was further grinded to bring down D
10 value close to 180 μm from 875
μm. Also, two bacterial: Chryseobacterium sp. and Pseudomonas fragi (X) were isolated from the filtration unit have been used as an inoculum.
ACCEPTED MANUSCRIPT
9
For a rapid biofilm development over the top layer of the filter material, high COD nutrient media of 800 mg/L suspended with high inoculum (6 x 10⁸ cells/mL) was recirculated for about 12 days (30 mL every CSTI and adjusted accordingly based on biofilm growth9) where after 5 days, COD of the nutrient solution was readjusted to 800 mg/L. For tracking the biofilm development, TOC removal, protein concentration, flow rate and cell viability (MTT assay) was determined after 2 days, 6 days, 9 days and 12 days.
Before and after the biofilm development (day zero and day 12), Morrill dispersion index10 (MDI) was determined as well (apparatus set-up and calculation are shown in the supplementary section: Figure S4) to understand the behavior of influent passage (degree of plug-flow condition) through the filter media and was found to be in the range of 2.25-2.52 for all the reactors. Generally, biofilm growth affects the flow passage and thus to ensure filter media void of air entrapment, this test was required.
Post-matured biofilm formation, all filters were run for 7 cycles (7 days each) using Lake Sainte-Anne (47.262879N, -71.665158W) as influent water. Approx. volume of 30 mL was fed into the filters after optimized CSTI (1 hour). Table 1 shows the characteristics of the lake water used along with other filter properties (more properties shown in Table S3, Supplementary section). According to lake history, there were no presence of cyanobacteria and cyanotoxin reported so far and the MC-LR analysis too shows no presence of it (< 0.03 μg/L, reports shown in Table S4: supplementary section for other microcystin variants). The filter was run continuously during the daytime (10 AM- 8 PM) and was appropriately auto-programmed (during night hours, based on
9 Biofilm growth hinders the flow rate and thus readjustment of CSTI is performed from time to time using an
auto-dosage pump
ACCEPTED MANUSCRIPT
10
average empty bed contact time, EBCT of each filter) to discharge water into the filter such that CSTI is appropriately maintained.
All the filters during the operation were backwashed with sterile tap water (bed expansion of around 10 % - 15 %) at the end of the 4th cycle. The airline tubing, check valves, and other accessories were washed at the end of every cycle to remove any deposited/built-up particles.
2.5 Sample analysis
The effluent collected from the filters were periodically analyzed for various water quality parameters comprising total coliform removal, turbidity removal, DOC removal, nitrate, nitrite, ammonia removal, dissolved oxygen content, flow rate, electrical conductivity, change in pH.
2.5.1 Total coliform removal, DOC removal, nitrate, nitrite, ammonia, and turbidity
removal
Total coliform removal was determined by the membrane filtration technique as discussed in the standard methods (APHA, 1998). The total coliform removal was reported as CFU/100 mL and determined at the end of every cycle. The initial coliform concentration reported in the influent-fed water (Lake Sainte-Anne, Quebec, Canada) was 451 ± 32 CFU/ 100 mL (averaging five tests). Based on this initial CFU value, total coliform removal was calculated (in %).
DOC of the influent and the effluent was determined using a Shimadzu 5000A analyzer (Shimadzu, Japan). Initial DOC was found to be 5 mg/L and its removal was reported in %. The optimized value for the initial turbidity was found to be 13 ± 1.1 NTU11. Effluent turbidity was
11 Initial turbidity of the lake water was 6 NTU and was increased using hydrated kaolin solution to mimic the
ACCEPTED MANUSCRIPT
11
measured after every two days of the cycle (twice/cycle) using HACH instrument 2100 model and the total turbidity removal was calculated in %.
At the end of each cycle, initial concentration of 50 mg/L for nitrate (sodium nitrate), 10 mg/L nitrite (sodium nitrite) and 10 mg/L solution of ammonia (ammonium sulphate) was passed through the filter column and their final concentration in the effluent was determined using the method described in Naghdi et al. (2017) and reported in mg/L.
2.5.2 pH, dissolved oxygen and flow rate
The pH of the effluent filtered sample was analyzed at the end of every cycle. Also, the dissolved oxygen of the effluent was measured using a portable F4-Standard probe (Mettler Toledo Inc) to check for any anoxic condition build-up and the biological activity (more activity more DO consumption and vice-versa). Initial DO of the lake water (aerated 30 minutes before each feed) was found to be 6.77 O2-mg/L.
The flow rate was measured for each filter at a constant (stand-by water) head of 7.5 cm from the top layer of the filter bed material every day at 17:00 PM. The value was reported in m/h(m3/m2/h).
2.5.3 MC-LR assay and MC-LR degradation
MC-LR assay was performed to understand the relative toxicity of the effluent water based on the survival rate of the bioindicator cells (Rhizobium meliloti). A similar protocol as described in Kumar et al. (2018 a) was followed for this assay where MTT was used as a reagent at the concentration of 7 mg/10 mL. For this test, a surrogate and known toxic compound: dimethyl
ACCEPTED MANUSCRIPT
12
sulfoxide (DMSO) was used and the absorbance of the formazan12 solution was
spectrophotometrically analyzed at λmax= 550nm to indirectly quantify the survived bacterial
cells (rest killed by the degree of toxicity in the tested sample). The absorbance of the formazan solution at different concentration (0 % - 100 % v/v) of DMSO was related to the absorbance value of the formed formazan solution due to MC-LR (up to 900 μg/L) denoting the same degree of bioindicator mortality. The graphical plots are presented for the same in the supplementary section (Figure S5).
At day 3 and day 6 of each cycle, the column was passed with 50 μg/L of MC-LR (same matrix: lake water, pulse concentration). The effluent sample was collected and measured via ultra-high-pressure liquid chromatography (uHPLC) as described by Fayad et al. (2015). The MC-LR removal was reported as percent (%) removal (Table 2) discriminated into four different sections viz. removal due to 1.) Sand media only (physical removal by SF)); 2.) Bacterial activity in the sand (represented as Bio 1, removal difference between SFI and SF); 3.) Support material (Agro residues) and bioactivity in only that region where agro-residual material is placed (indicated by Agro-material + Bio 2); 4.) Remained undegraded.
2.5.4 Extra polymeric substance (EPS) and protein analysis
The EPS quantification in the biofilm formed over the agro-residue was performed (after cycle 7, before filter column dismantling) by ethanol precipitation method as previously described by Boon et al. (2008). In brief, top 10 mm or around 2-gram of the agro material (sand in case of SFI) was carefully removed from the column filter and suspended in 10 mL of tap water to initiate cell lysis (cell-shock). A cell-lysis buffer solution was spiked (5 mL) to further lyse the cells (buffer recipe provided in the supplementary section). Afterward, the solution was vortexed
ACCEPTED MANUSCRIPT
13
for 2-3 minutes and centrifuged at 7000 x g at room temperature for 20 minutes. The derived supernatant was mixed with twice the volume of ethanol (around 25 mL) and kept at -20 °C overnight. The precipitated EPS was reported in µg/mg of the dry mass of the agro residue taken initially.
For the protein analysis, approx. 0.1 gm of agro-residue from the top of each column filter (DSF, HFF, PPF) was carefully taken and suspended in 1.5 mL of distilled water (microcentrifuge tube). After 2 minutes of vortex and centrifugation (8000 x g) at room temperature for 3 minutes, the supernatant was analyzed for the total protein analysis by Bradford assay and reported as µg/mL (Bradford, 1976).
2.6 Bio-profiling of column filters and SEM imaging
To understand the distribution profile of the bacterial cells (cell proliferation) in each biosand filters, samples were carefully isolated for every 2 inches (approx. 50 mm) of the glass column (cut-section represented in Figure S6). Each sample was appropriately mixed and around 0.5 gram was dipped in 1.5 mL of tap water to carry the CV assay (biomass distribution profile) and MTT assay (viable cell distribution profile) as described in section 2.2. Since higher bioactivity was expected in the top layer of the filter media (agro-residue + some sand material), the contribution of the top 5 cm of the filter material in terms of cell biomass and cell viability was calculated as per the Equation 1 below:
% change in biomass/cell viability =
–
– (1)
SEM images for the agro-residues (support material used in the biosand filters) were obtained both before and after the biofilm formation. The structure of the agro-residual fiber after the
ACCEPTED MANUSCRIPT
14
biofilm formation was observed closely for its integration with biocells (EPS). Such integration where these fibers can play the role of an architectural element is necessary for the long-term adhesion of the bacterial cells and hence the biofilms (Serra et al., 2013). The micrographs were captured between 12-15 kV accelerating voltage (Zeiss EVO ® 50 Smart SEM system). Before obtaining the images, the materials were gold plated (15 nm thickness) using a sputter coater.
2.7 Statistical analysis
All statistical analyses comprising standard deviation, average, student t-test, p-value comparison, and all graphical presentations were performed in ORIGIN software (Version 8.5; OriginLab).
3. Results and discussion
3.1 Screening of the bacterial strains
Figure 2 (A) and (B) shows the absorbance values results for CV assay and MTT assay used for the quantification of cell biomass and cell viability, respectively for all three bacterial strains inoculated (A+X, B+X, and S+X) and different materials (DS, HF, PP, Sand). Among the three tested bacterial strains, Bacillus sp. (with X) showed the least affinity towards all the three agro-residue support materials (least absorbance by CV and MTT assay as compared to A+X and S+X (Figure 2 (A, B). However, there was a close competition for screening between Arthrobacter ramosus and Sphingomonas sp., with both showing a similar affinity towards the tested
materials. To further resolve this deadlock, an MC-LR assay (initial MC-LR concentration: 50 μg/L) was performed at the end of day 7, to quantify the degree of toxicity in the filtered sample from each filter (detailed results shown in Table S5).
ACCEPTED MANUSCRIPT
15
The biomass formed by A+X on DS, HF, and PP was comparatively 1 %, 9.4 %, 22 % higher than S+X case (calculated by taking mean absorbance values for day 2, day 4 and day 7). On the other hand, the viability of bacterial cells over DS, HF, and PP was 1.1 %, 8.3 % and 4.5 % higher for A+X as compared to S+X13. Also, the relative toxicity of the filtered sample at the end of day 7 was found to be 8.4 % less toxic for A+X case as compared to S+X (for all three agro-residue material14). Thus, Arthrobacter ramosus (with the native bacterial strains: A+X) was finally screened for all the three agro-residue as it was found to be the most desirable biofilm forming MC-degrader as well as producing relatively less toxic filtered sample than others.
3.2 Optimization of input parameters using CCD technique
Physical parameters viz. initial turbidity, pH and CSTI were evaluated using the central composite design of an experiment, analyzing output desirability via response surface methodology (RSM). Various RSM plots were obtained for each of the output parameters as discussed in section 2.3 (all plots are shown in the supplementary section: Figure S7). A desirability index of 0.685 was obtained based on the goal set-up for an input-output relation. The optimized pH, initial turbidity and CSTI obtained were 6.8, 13 NTU and 3 hours, respectively. The detailed result table is shown in the supplementary section, Table S6). Except for two models (pH change: prob> F; 0.96, and turbidity removal: prob > F; 0.32), rest all five output models were found to be significant to the three inputs (at three different levels, as discussed in section 2.3). Coliform removal was found to be significantly dependent upon all the three input parameters (pH (A): p-value= 0.002 (A2); CSTI (B): p-value= <0.0001 (B2); Turbidity (C), p-value= 0.006 (C2)). It is obvious that with an increase in the value of parameter
13 B+X was not compared as the assay results show that the quantification for biomass and cell viability has always
remained lower when compared with A+X and S+X.
ACCEPTED MANUSCRIPT
16
B, shows a positive impact on the total coliform removal (+ 17.44 B2). For the effective DOC removal, RSM model shows an obvious negative correlation with turbidity (-3.9 C2) and positive relation with CSTI (+14.4 B), indicating low influent turbidity and high retention time increases filter performance in terms of DOC removal.
Model equation for MC-LR assay depicted a necessary inference that when pH decreases, the toxicity of the filtered sample decreases too (-0.23 A2, p-value: 0.006), which agrees to the fact
that MC-LR adsorbs to the surface better at low pH (Teixeirra et al. 2012). In a DWTP, where disinfection is next to the filtration system, a low pH can favor both treatment units delivering MC-LR maximum adsorption followed by effective disinfection (Ward et al. 1984). The flow rate is an important parameter too providing quick and effective filtration at the same time without compromising the water quality parameters (Mallongi et al. 2016). Model equation showed sensitive and significant (p-value < 0.0001 for a C2 variable, -0.64C2) relation with the initial turbidity resulting in to be operated at 13 NTU for an optimum filter run. It may be noted that the present system working at 13 NTU (initial turbidity), needed backwash after an active filter run of 28 days (from mid-cycle 2- cycle 6) agrees in good agreement with Gottinger et al. (2011) for the effective treatment of Canadian rural prairie water using SSF15 where backwashing needed after 40 days.
3.3 Biofilm formation
To verify the development of a mature biofilm, various parameters such as flow rate, DOC, protein content and cell viability were analyzed. Figure 3 (A, B, C, D) shows the analysis for the above parameters in the same order. Filter DSF, HFF, and PPF start off with a reduced flow rate
15
SSF= slow sand filter (Filter DSF, HFF and PPF is a kind of slow sand filter as flow rate range: 0.1 m/h – 0.4 m/h)
ACCEPTED MANUSCRIPT
17
of 0.78 m/h, 0.82 m/h, 0.67 m/h as compared to 1.45 m/h for SF because of the less density and fineness property of the agro-residues being used as the support material. On day 9, backwashing (at a slow flow rate) was performed because the hydraulic conductivity shall in no case reduce to 1/4th the initial value (around 2.4 m/h). Users/researchers are directed to maintain the filters (backwashing/harrowing) when flow rate becomes too slow; thus, our designation of ¾th reduction in flow rate is a subjective minimum.
The increase in the protein concentration and the DOC removal might be attributed to the colonization of the inoculated bacterial strains (A+X). After day 12, both the above parameter showed a constant behavior till day 18 (not shown in Figure 3 (A) and (B)), highlighting the mature growth inside the pores of the filter media (sand). More confirmatory evidence of the same was derived from the MTT assay, performed for the top layer of the filter media (around 0.4 g mass, process details in section 2.2) showing the constant amount of viable cells even after the backwashing event at 0.06 m/h and 15 % bed expansion.
3.4 Routine sample analysis after biofilm formation
Post-biofilm formation, all filters were primed for about 80-bed volume for 3 days every hour to remove excess turbidity in the effluent due to loosely attached biomass within the column. Table 2 shows various water quality and other filtration parameters that were analyzed after the priming event. Maximum coliform removal of 92.7 ± 12.8 was achieved by DSF followed by HFF and PPF (around 83 % each, Table 2) and were > 30 % higher than SF. This observation reveals that agro-residue as the support material enhanced the pathogenic bacteria entrapment due to their less pore volume behavior as compared to sand particle (not mentioned) where further colonization of bacterial strains enhanced the bacterial activity in ARSFs to allow a substantial degree of predation (bioactivity quantification: MTT assay section 3.3 and section
ACCEPTED MANUSCRIPT
18
3.6). Predation mechanism, top-down trophic interaction, and adsorption to biomass could be the reason for high coliform removal as mentioned above (Haig et al 2014). Wand et al. (2007) too revealed enhanced coliform removal (3-4 log removal) in a sand filter due to the predation mechanism which can be linked to the effective microbial colonization.
Effluent turbidity for the agro-residue sand filters showed similar (range: 1-1.4 NTU) response to each other. However, the turbidity of the effluent for ARSFs was better than SFI (2.53 ± 1.4 NTU) and SF (4.0 ± 0.7 NTU). Relative low turbidity in ARSFs as compared to SF or SFI can be attributed to the enhanced particle staining due to biolayer formation and change in the media particle/surface. Like the current study, Napotnik et al. (2017) too found a positive correlation between turbidity and coliform (E.coli) removal in the long term operated biosand filter. WHO recommends turbidity of < 1 NTU for efficient chlorination (WHO, 2004).
Inoculated sand filter (SFI) without agro-residue achieved an average DOC removal of 29 ± 5 %, very similar to what Campos et al. (2002) achieved (23 % – 25 %). On the other hand, DOC removal in ARSFs: DSF, HFF, and PPF were 15 %, 6 %, 2 % and 18 %, 9 %, 5 % higher than SFI and SF, respectively. This indicates higher bioactivity in the agro-residue filters (especially DSF) as compared to the inoculated sand filter (SFI) possibly because of the higher surface area of the support material (low void ratio) and higher biomass growth within the filter column. Collins et al (1994) too observed an increase in organic carbon removal with an increase in the biomass concentration in the sand.
This phenomenon can also be backed up by the reduction of pH and DO in the filtered effluent of the inoculated filters (SFI, PPF, DSF, HFF) when compared to SF (Table 2). Agro-residue supported sand filters (ARSFs) were also able in removing ammonia from the influent feed water
ACCEPTED MANUSCRIPT
19
to close to the guideline values (0.121 mg/L), which indicated a healthy behavior of a mature filter (Ellis et al. 2009). Also, the denitrification property of ARSFs filters (especially DSF) was found to be significantly higher than SFI (> 55 % for NO3- as well as NO2- removal), achieving
below guideline values of 3.25 mg-NO3-/L and 2.5 mg- NO2-/L. Sun et al. (2018) too observed
the enhanced performance in denitrification (NO3- to N2) using agro-residues in the form of
corncob and wheat straw. In general, SSF shows an increase in the nitrate removal once the bacterial colonization captivates as also studied by Adeniran and Akanmu (2013) which showed an increase in the nitrate removal from 25 % (day 1) to 74 % (day 27). In the current study, SF achieved nitrate removal of 21 % which increased to 48 % due to bacterial inoculation (SFI) and further to 64 % each for HFF and PPF and 93 % for DSF.
It must also be noted that the agro-residues usually has a high C/N ratio which can cause NO3-
limitation for the denitrifiers (lower depth of the material), thereby promoting N2 conversion
(Her et al. 1995). Hence, the denitrifiers present at the lower region of the filter will face lower concetration of nitrates to be broken effectively into nitrogen. However, if the amount of liable carbon is more (due to the high C/N ratio), it may further enhance the rate of denitrification as inferred from Miller et al. (2008). Thus, deinking sludge may consist more liable carbon as compared to HF and PP agro-residues raising the C/N ratio (not determined) and making their surface more available for the denitrifiers. However, no particular study was performed to know the stability of the DS material as they are more prone to biodegradation which might need periodical replacement as a support material to the sand filter. Moreover, higher DOC removal of 44 ± 11 % achieved in DSF as compared to 35 ± 3 % and 31 ± 7 % in HFF and PPF may be linked to the high liable carbon present within the filter (HFF and PPF) which might be responsible for hindering the denitrification (ineffective nitrite and nitrate removal for HFF and
ACCEPTED MANUSCRIPT
20
PPF as compared to DSF, Table 2). These discussions also led to an interesting conclusion that a large portion of denitrification might have happened within the ARMs in the ARSFs.
3.5 MC-LR removal and MC-LR assay (toxicity) analysis
Figure 5 shows the bar graph representation of the MC-LR removal, discriminated into four categories as discussed in section 2.5.3. Maximum MC-LR removal of 87 ± 14 % was achieved by DSF comprising all seven cycles of the filter run. Other ARSFs viz. HFF and PPF achieved MC-LR removal of 82 ± 7 % and 78 ± 4 %, respectively. As compared to the inoculated sand filter (SFI), ARSFs enhanced the overall MC-LR removal by 13 % (DSF), 8 % (HFF) and 4 % (PPF). The contribution of the agro-materials (and bioactivity they possess: Bio 2) for MC-LR removal can be observed from the graph (black16 bar coverage), being more prominent for DSF. The consistency of their share in degrading MC-LR became more sound towards the latter part of the cycles (cycle 4-cycle 7) especially for DSF which achieved almost complete MC-LR removal (Figure 5). Mcdowall et al. (2009) too showed that biodegradation plays a key role in the filter system where cyanobacterial metabolites: geosmin got removed by an extra 38 %.
The mutual property of bacterial cells and their interaction with the surface (to be attached) plays a key role too. If the bacterial strains are not properly acclimatized (immature and weak) and attached to the surface (agro-residue material here), it may lead to low degradation of the contaminants. Likewise, as can be observed from Figure 5, degradation of MC-LR during initial few cycles was low for DSF and HFF. However, once the acclimatization of bacteria with MC-LR have occurred, the overall percentage degradation increased too (Figure 5). Even the breakthrough period prolongs for the filter if proper acclimation has occurred. However, for PPF, as can be seen from the SEM images, that the bacterial attachment is not too dense and
16
ACCEPTED MANUSCRIPT
21
captivating over the surface. This might be the reason for less enhancement in the bioactivity for PP material which eventually leads to similar MC-LR removal as that of SFI (74 % -78 %). Holst et al. (2003) and Christoffersen et al (2002) too studied acclimation activity of bacterial community with MC-LR and found to be an impactful event in its removal.
Backwashing was performed after cycle 1 for DSF and HFF and after cycle 2 for PPF. The phenomenon had a negative effect on HFF and PPF while a positive effect on DSF in terms of MC-LR removal. It might be due to the persistent, more stable and potential biofilm that colonized the DS material. Figure 4 (A to I) shows the SEM images for the three agro-residues, before and after the biofilm formation. It can be observed that the fibers present in the DS became more attached like a ‘cloth’ structure (Figure 4 (B)) after the biofilm formation which PP material lacked (Figure 4 (H)). HF material too exhibited binding of fibers (Figure 4 (E)). The effective binding might be due to the extra polymeric substance (EPS) which is an integral part of the biofilm development. To confirm this, EPS was quantified at the end of cycle 7. The reported EPS was found to be in order: DSF (170 ± 13 μg/mg) > HFF (142 ± 32 μg/mg) > SFI (83 ± 21 μg/mg) > PPF (67 ± 29 μg/mg). Thus, it may be possible that the production of EPS during biofilm maturation helped in an effective binding of the fibers in DS and HF material which was around 2.5 and 2.1 times higher than PP material. However, it is very interesting to observe that the EPS production in SFI was more than PP material which can be related to the less bioactivity (less EPS) that might be the cause for just 4 % increase in MC-LR removal (Table 2). In two cycles (cycle 3 and cycle 4), DSF even showed potential in achieving below detection level concentration of MC-LR in the effluent filtered water.
Due to the difficulty in culturing bioindicator (Rhizobium meliloti) for the initial few cycles of the filter operation, toxicity assessment of the filtered samples for each filter was performed only
ACCEPTED MANUSCRIPT
22
for the last three cycles. Equivalent DMSO concentration of the filtered sample from DSF, HFF, PPF, SFI and SF was reported as 1.19 ± 0.18 %, 3.16 ± 1.38 %, 7.49 ± 1.62 %, 8.36 ± 1.8 % and 17.1 ± 0.81 %, respectively. In some literature, > 1 % - 2% DMSO (v/v) has been reported to affect the human cells such as epithelial cells, vascular endothelial and platelet cells, suppressing the expression of inflammatory cytokines, etc. (Proost et al. 2016, Yi et al. 2017, Cao et al. 2007). According to the mentioned facts, only filter DSF qualifies based on the toxicity assessment. As mentioned by Koechler et al. (2015), attached growth system with high protein, EPS (diffusion barrier reduces the toxic concentration) and nutrient around bio cells helps them to survive under the toxic environment (toxic compound resisting mechanism). With this context, in the present study, maximum protein estimated in the supernatant solution during biofilm development for DSF was around 1.50 μg/mL as compared to < 0.80 μg/mL for SFI (Figure 3 (C)). Also, the EPS quantified (as discussed above) in case of DSF was significantly higher than SFI.
3.6 Bio-profiling of column filters
Bio-profiling of the filter revealed that most of the biomass and viable cells resided in top 10-15 cm of the filter. Figure 6 (A) and (B) show the quantification (indirect) of cell biomass and cell viability (based on the absorbance values) for DSF and followed in the order: DSF > HFF > PPF > SFI > SF. Biomass and viable cell activity in the top 5 cm of the filter material were calculated according to the equation mentioned in section 2.6. A decline of around 39 % and 35 % in the activity of the cell biomass and cell viability was found for DSF (comparing to the absorbance at 0.75 cm sampling point), highlighting a major portion of the bioactivity lying within the DS
ACCEPTED MANUSCRIPT
23
material. Similarly, for HFF and PPF, these values were: 25 %, 27 % and 16 %, 15 %, respectively and in the range 8 % - 11 % for SFI and SF17, respectively.
High bacterial activity at the top part of the filter may be responsible for the effective ammonia removal (nitrification) in case of DSF (reducing NH3- concentration to below guideline value,
Table 2) as compared to HFF and PPF. No special experiment was done for the quantification of the adsorbed MC-LR within the support material and thus physical adsorption of the same was not analyzed. Campos et al. (2002) and Duncan et al (1988) too observed the same trend (decrease in biomass as depth increase) in the biomass growth over the sand media and highlighted the importance of major microbial growth over the top layer of the filter media contributing significantly to the water purification. In this study, the influence of higher microbial community growth (both in terms of cell biomass and viability) observed at the top 10 cm of filter media rightly suggests the versatility of ARSFs, especially DSF, which showed 13 % more MC-LR and 15 % more DOC removal than SFI.
3.7. Bioaugmentation of sand filters with microcystin degraders: an asset
Bioaugmentation of sand filters in a DWTP using MC-degraders can be an asset for an effective removal of microcystins. However, care must be taken during inoculation that it should be enough to compete with the native or indigenous bacterial community residing over the sand media. In this work, the purpose of high inoculation of the specific bacterial strains, i.e., A+X, was to maximally counter the growth of any opportunistic bacterial strains present in the lake water (used as a feed) that might have grown over the agro-residue and the sand media present inside the filter column. The plate count method reported the heterogenous bacterial cell count
17 Bioactivity in the uninoculated filter (SF) had come from the bacterial community present in lake water (influent
ACCEPTED MANUSCRIPT
24
present in the lake water to be around 2.8 x 10⁵ cells/mL (averaged for 4 media plates used for the experiments). This value is around 2000 times less as compared to the inoculated strains (A+X). It has been mentioned by Bourne et al. 2006, that the high cell inoculation (as high as 107 or 108 cells/mL) not only helped in forming quick biofilm but also ensured that the level of microcystin degrading strains always exceeded the level of indigenous bacteria which resulted in an increased chance of survival of the former in the biological filtration systems.
The optical density value (OD λ600 nm) was derived from the growth-curve at 25 °C for A+X (2
colonies each of Arhtrobacter, Chryseobacterium and Pseudomonas fragi to start with) and heterogeneous bacterial species (picked 6 different individual colonies from the growth plate). The maximum OD value of former (A+X) has always remained on the higher (2.7-3 times) side as compared to the latter case till stationary phase of the growth was reached.
To further confirm the dominance of A+X bacterial strains for a longer period of time over the top layer of the sand filter, MC-LR removal was analyzed after 32 days from the completion of the last cycle (cycle 7). The removal percentage of MC-LR was reported as 75 %, 67 % and 64 % for DSF, PPF and HF as compared to < 45 % for SF. Here, it must be understood that the filter after 7 cycles was kept under minimum maintenance condition and hence the reported MC-LR removal values are almost 5-10 % lesser than the average of 7 cycles (Table 2). But, still, the trend of MC-LR removal was similar as it was during the filter operation from cycle 1 to cycle 7 (DSF > HF > PPF > SFI).
Also, a very interesting finding in the same research paper was that the microcosm experiment demonstrated the enhanced microcystin removal when the MC-degrading bacteria (MJ-PV) were inoculated with just 100 cells/mL (Bourne et al., 2006). This suggested that the inoculated bacteria, i.e., MJ-PV which contains the mlrA genes, is quite powerful when it comes to tackling
ACCEPTED MANUSCRIPT
25
the indigenous bacterial community that might have tried to overpower the microcystin degraders. In our work too, the inoculated strains in the filter were of the genus: Arthrobacter ramosus (which expresses mlrA gene, Manage et al., 2009) and X which is a combination of
Pseudomonas fragi and Chryseobacterium sp. which has been proven to be a good MC-degrader
in our previous study (Kumar et al., 2018). Thus, considering a high inoculation (6 x 10⁸ cells/mL) of the potential strains capable of MC degradation in the current study is significantly higher than the critical cell concentration (102 cells/mL) needed for the enhanced microcystin degradation (from above discussion). Likewise, the performance of filter followed the same trend even after 32 days of major filter operation (cycle 7), which indicated the prolonged, proactive behavior of the inoculated strains (A+X). However, a taxonomical study is still required to confirm the presence of inoculated bacteria for a longer duration.
4. Conclusion
Agro-residue material (ARMs) in the form of deinking sludge (DS), hemp fiber (HF) and paper and pulp dried-sludge (PP) was utilized as a support material to enhance the bioactivity of the sand filter (DSF, HFF and PPF). Overall, as compared to the normal inoculated sand filter (no agro-residue as a support material: SFI), DSF performed better among other agro-residue supported sand filters (ARSFs). DSF showed enhanced dissolved organic carbon removal (15 % more than SFI, and 9 %, 13 % more than HFF and PP, respectively), microcystin-LR removal (13 % more than SFI and > 5-10 % when compared to HFF and PPF), nitrification (to below guideline level), and maintaining pH and dissolved oxygen well within the guideline values (pH: 7- 10.5 and dissolved oxygen: 2-4 mg/L). Water quality parameters were improved using the ARSFs. DSF, HFF, and PPF removed > 83 % of total coliform on an average as compared to 69 % in SFI. Also, the turbidity of the filtered water remained in the range: 0.8 – 1.0 NTU for
ACCEPTED MANUSCRIPT
26
ARSFs while it remained 2.5 ± 1.4 NTU and 4.1 ± 0.7 NTU for SFI and sand filter (SF) filter, respectively. Scanning electron microscope images showed high extra polymerase substance (EPS) with DSF: 170 ± 13 μg/mg > HFF 142 ± 32 μg/mg > SFI 83 ± 21 μg/mg, that might have been responsible for effectively binding the fibers of DS and HF material forming stable biofilm surface. Bio-profile of the ARSFs showed most bioactivity present within the top 10 cm of the filter media which included 5 cm of ARMs. Morrill dispersion index for ARSFs, even after 7 cycles of filter operation remained in the range 2.4-2.9 as compared to 2.12 for SF providing evidence of persistence plug flow condition. However, the stability of these agro-residue needs further study as they can be degraded over time. Following are some research gaps/ research implications:
a) More in-depth analysis for the nitrification/denitrification needs to be studied by increasing the ARMs depth in a column filter. Such filters will be effective and essential for the surface water polluted with fertilizers (high ammonia).
b) Long-term stability of the ARMs is crucial for the plant operators to understand the frequency of material change-over.
c) Breakthrough period of the filter should be determined for the MC-LR compound or otherwise, the formation of toxic microcystin-chloride compound (resulting from the disinfection step) will be received at the tap source by the consumers.
Acknowledgment
The authors are sincerely thankful to the Natural Sciences and Engineering Research (Discovery Grant 23451), Genome Québec, Genome Canada (Grant 6116548-2015) and ATRAPP (Algal blooms, treatment, risk assessment, prediction, and prevention) for financial support. Special
ACCEPTED MANUSCRIPT
27
thanks to Dana Simon for coordinating the sample receipt and analysis. Authors would also like to thank the team for constant support and timely suggestions. We want to thank Genome Quebec for timely sequencing for the bacterial identification. The views or opinions expressed in this article is exclusively those of the authors.
Conflict of interest
None
References
Achak, M., Mandi, L., & Ouazzani, N. (2009). Removal of organic pollutants and nutrients from olive mill wastewater by a sand filter. J Environ Manage, 90(8), 2771-2779.
doi:10.1016/j.jenvman.2009.03.012
Adeniran, A. E., and Akanmu, J. O. (2013). The Efficiency of Slow Sand Filters in the Treatment of Secondary Effluent from a Water Hyacinth Domestic Sewage Plan. NSE Technical Transactions, 47(2).
APHA, AWWA, WPCF. 1998. Standard methods for the examination of water and wastewater, 19th Ed., Washington, D.C.
Boon, C., Deng, Y., Wang, L.-H., He, Y., Xu, J.-L., Fan, Y., Zhang, L.-H. (2007). A novel DSF-like signal from Burkholderia cenocepacia interferes with Candida albicans
morphological transition. The ISME Journal, 2(1), 27-36. doi:10.1038/ismej.2007.76
Bradford, M. M. (1976). A rapid and sensitive method for the quantitation of microgram quantities of protein utilizing the principle of protein-dye binding. Analytical Biochemistry, 72(1-2), 248-254. doi:10.1016/0003-2697(76)90527-3
Bourne, D. G., Blakeley, R. L., Riddles, P., & Jones, G. J. (2006). Biodegradation of the cyanobacterial toxin microcystin LR in natural water and biologically active slow sand filters. Water Research, 40(6), 1294-1302. doi:10.1016/j.watres.2006.01.022
Cao, X.-G., Li, X.-X., Bao, Y.-Z., Xing, N.-Z., & Chen, Y. (2007). Responses of Human Lens Epithelial Cells to Quercetin and DMSO. Investigative Opthalmology & Visual Science, 48(8), 3714. doi:10.1167/iovs.06-1304
Campos, L. C., Su, M. F. J., Graham, N. J. D., & Smith, S. R. (2002). Biomass development in slow sand filters. Water Research, 36(18), 4543-4551.
ACCEPTED MANUSCRIPT
28
Christoffersen, K., Lyck, S., & Winding, A. (2002). Microbial activity and bacterial community structure during degradation of microcystins. Aquatic Microbial Ecology, 27, 125-136. doi:10.3354/ame027125
Collins MR, Eighmy TT, Fenstermacher JM, Spanos SK, Malley JP, Morgan DF, Royce J.Removal of natural organic material by slow sand filtration.In: Collins MR, Graham NDJ, editors.Slow sand filtration.Denver, CO: AWWA, 1994.p.190–216
Duncan A.The ecology of slow sand filters.In: Graham NJD, editor.Slow sand filtration: recent development in water treatment technology.Chichester, UK: Ellis Horwood,
1988.p.163–80
Ellis, K. V., & Wood, W. E. (2009). Slow sand filtration. Critical Reviews in Environmental Control, 15(4), 315-354. doi:10.1080/10643388509381736
Falconer, I. R. (1999). An Overview of problems caused by toxic blue-green algae (cyanobacteria) in drinking and recreational water. Environ Toxicol, 14(1), 5-12 doi:10.1002/(sici)1522-7278(199902)14:1<5::Aid-tox3>3.0.Co;2-0
Fayad, P. B., Roy-Lachapelle, A., Duy, S. V., Prévost, M., & Sauvé, S. (2015). On-line solid-phase extraction coupled to liquid chromatography tandem mass spectrometry for the analysis of cyanotoxins in algal blooms. Toxicon, 108, 167-175.
doi:10.1016/j.toxicon.2015.10.010
Gottinger, A. M., McMartin, D. W., Price, D., & Hanson, B. (2011). The effectiveness of slow sand filters to treat Canadian rural prairie water. Canadian Journal of Civil Engineering, 38(4), 455-463. doi:10.1139/l11-018
Grützmacher, G., Böttcher, G., Chorus, I., & Bartel, H. (2002). Removal of microcystins by slow sand filtration. Environ Toxicol, 17(4), 386-394. doi:10.1002/tox.10062
Guidelines for drinking-water quality; World Health Organization: Geneva, 2004.
Haig, S.-J., Schirmer, M., D'Amore, R., Gibbs, J., Davies, R. L., Collins, G., & Quince, C. (2014). Stable-isotope probing and metagenomics reveal predation by protozoa drives E. coli removal in slow sand filters. The ISME Journal, 9, 797. doi:10.1038/ismej.2014.175 Her, J.-J., & Huang, J.-S. (1995). Influences of carbon source and C/N ratio on nitrate/nitrite
denitrification and carbon breakthrough. Bioresour Technol, 54(1), 45-51. doi:10.1016/0960-8524(95)00113-1
He, X., Zhang, G., de la Cruz, A. A., O’Shea, K. E., & Dionysiou, D. D. (2014). Degradation Mechanism of Cyanobacterial Toxin Cylindrospermopsin by Hydroxyl Radicals in Homogeneous UV/H2O2 Process. Environ Sci Technol, 48(8), 4495-4504.
ACCEPTED MANUSCRIPT
29
Holst, T., Jørgensen, N. O. G., Jørgensen, C., & Johansen, A. (2003). Degradation of microcystin in sediments at oxic and anoxic, denitrifying conditions. Water Research, 37(19), 4748-4760. doi:10.1016/s0043-1354(03)00413-5
Kelley, T., G. Abulikemu, D. Dionysiou, and J. Pressman (2017). Evaluating removal of microcystin-LR from drinking water using Granular Activated Carbon with various amounts of NOM Preloading. American Water Works Association Water Quality Technology Conference, Portland, OR, November 12 - 16, 2017
Koechler, S., Farasin, J., Cleiss-Arnold, J., & Arsène-Ploetze, F. (2015). Toxic metal resistance in biofilms: diversity of microbial responses and their evolution. Res Microbiol, 166(10), 764-773. doi:10.1016/j.resmic.2015.03.008
Kumar, P., Hegde, K., Brar, S. K., Cledon, M., Kermanshahi-pour, A., Roy-Lachapelle, A., & Galvez-Cloutier, R. (2018 a). Biodegradation of microcystin-LR using acclimatized bacteria isolated from different units of the drinking water treatment plant. Environmental Pollution, 242, 407-416. doi:10.1016/j.envpol.2018.07.008
Kumar, P., Hegde, K., Brar, S. K., Cledon, M., & Kermanshahi pour, A. (2018 b). Physico-chemical treatment for the degradation of cyanotoxins with emphasis on drinking water treatment—How far have we come? Journal of Environmental Chemical Engineering, 6(4), 5369-5388. doi:10.1016/j.jece.2018.08.032
Laadila, M. A., Hegde, K., Rouissi, T., Brar, S. K., Galvez, R., Sorelli, L., Abokitse, K. (2017). Green synthesis of novel biocomposites from treated cellulosic fibers and recycled bio-plastic polylactic acid. Journal of Cleaner Production, 164, 575-586.
doi:10.1016/j.jclepro.2017.06.235
Mallongi, A., Daud, A., Ishak, H., Ane, R. L., Birawida, A. B., Ibrahim, E., . Rahman, S. A. (2016). Clean Water Treatment Technology with an Up-flow Slow Sand Filtration System from a Well Water Source in the Tallo District
of Makassar. Journal of Environmental Science and Technology, 10(1), 44-48. doi:10.3923/jest.2017.44.48
Manage, P. M., Edwards, C., Singh, B. K., & Lawton, L. A. (2009). Isolation and Identification of Novel Microcystin-Degrading Bacteria. Appl Environ Microbiol, 75(21), 6924-6928. doi:10.1128/aem.01928-09
McDowall, B., Hoefel, D., Newcombe, G., Saint, C. P., & Ho, L. (2009). Enhancing the biofiltration of geosmin by seeding sand filter columns with a consortium of geosmin-degrading bacteria. Water Research, 43(2), 433-440. doi:10.1016/j.watres.2008.10.044 Miller, M. N., Zebarth, B. J., Dandie, C. E., Burton, D. L., Goyer, C., & Trevors, J. T. (2008).
ACCEPTED MANUSCRIPT
30
abundance in soil. Soil Biology and Biochemistry, 40(10), 2553-2562. doi:10.1016/j.soilbio.2008.06.024
Naghdi, M., Cledon, M., Brar, S. K., & Ramirez, A. A. (2018). Nitrification of vegetable waste using nitrifying bacteria. Ecological Engineering, 121, 83-88.
doi:10.1016/j.ecoleng.2017.07.003
Napotnik, J. A., Baker, D., & Jellison, K. L. (2017). Effect of Sand Bed Depth and Medium Age on Escherichia coli and Turbidity Removal in Biosand Filters. Environ Sci Technol, 51(6), 3402-3409. doi:10.1021/acs.est.6b05113
Nicholson, B. C., Rositano, J., & Burch, M. D. (1994). Destruction of cyanobacterial peptide hepatotoxins by chlorine and chloramine. Water Research, 28(6), 1297-1303.
doi:10.1016/0043-1354(94)90294-1
Pelaez, M., de la Cruz, A. A., O’Shea, K., Falaras, P., & Dionysiou, D. D. (2011). Effects of water parameters on the degradation of microcystin-LR under visible light-activated TiO2 photocatalyst. Water Research, 45(12), 3787-3796.
doi:10.1016/j.watres.2011.04.036
Proost, P., Elisia, I., Nakamura, H., Lam, V., Hofs, E., Cederberg, R., Krystal, G. (2016). DMSO Represses Inflammatory Cytokine Production from Human Blood Cells and Reduces Autoimmune Arthritis. PLoS One, 11(3), e0152538.
doi:10.1371/journal.pone.0152538
Serra, D. O., Richter, A. M., & Hengge, R. (2013). Cellulose as an Architectural Element in Spatially Structured Escherichia coli Biofilms. J Bacteriol, 195(24), 5540-5554. doi:10.1128/jb.00946-13
Sun, Z., Zheng, T., Xin, J., Zheng, X., Hu, R., Subhan, F., & Shao, H. (2018). Effects of alkali-treated agricultural residues on nitrate removal and N 2 O reduction of denitrification in unsaturated soil. J Environ Manage, 214, 276-282. doi:10.1016/j.jenvman.2018.02.078
Teixeira, M. R., & Rosa, M. J. (2012). How does the adsorption of microcystins and anatoxin-a on nanofiltration membranes depend on their co-existence and on the water background matrix. Water Science and Technology, 66(5), 976-982. doi:10.2166/wst.2012.265
USEPA, Nutrient policy and data (2018), Guidelines and Recommendations, https://www.epa.gov/nutrient-policy-data/guidelines-and-recommendations, Date Accessed: 11th November, 2018.
Wand, H., Vacca, G., Kuschk, P., Krüger, M., & Kästner, M. (2007). Removal of bacteria by filtration in planted and non-planted sand columns. Water Research, 41(1), 159-167. doi:10.1016/j.watres.2006.08.024
ACCEPTED MANUSCRIPT
31
Ward, N. R., Wolfe, R. L., & Olson, B. H. (1984). Effect of pH, application technique, and chlorine-to-nitrogen ratio on disinfectant activity of inorganic chloramines with pure culture bacteria. Appl Environ Microbiol, 48(3), 508-514.
Yi, X., Liu, M., Luo, Q., Zhuo, H., Cao, H., Wang, J., & Han, Y. (2017). Toxic effects of dimethyl sulfoxide on red blood cells, platelets, and vascular endothelial cells in vitro. FEBS Open Bio, 7(4), 485-494. doi:10.1002/2211-5463.12193
ACCEPTED MANUSCRIPT
32
Tables:
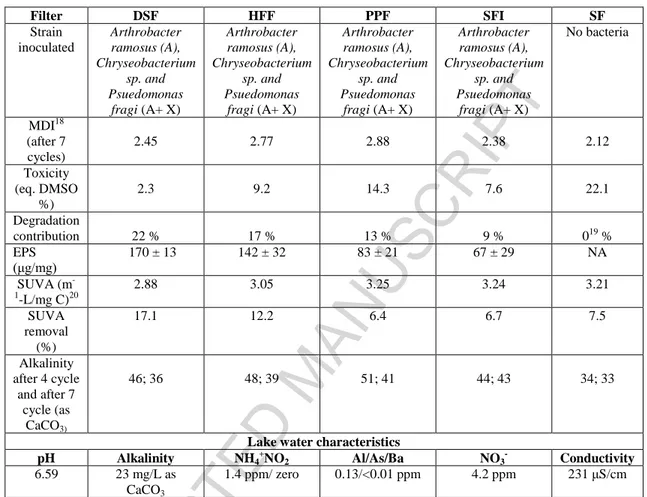
Table 1: Filter details and lake water characteristics
Filter DSF HFF PPF SFI SF Strain inoculated Arthrobacter ramosus (A), Chryseobacterium sp. and Psuedomonas fragi (A+ X) Arthrobacter ramosus (A), Chryseobacterium sp. and Psuedomonas fragi (A+ X) Arthrobacter ramosus (A), Chryseobacterium sp. and Psuedomonas fragi (A+ X) Arthrobacter ramosus (A), Chryseobacterium sp. and Psuedomonas fragi (A+ X) No bacteria MDI18 (after 7 cycles) 2.45 2.77 2.88 2.38 2.12 Toxicity (eq. DMSO %) 2.3 9.2 14.3 7.6 22.1 Degradation contribution 22 % 17 % 13 % 9 % 019 % EPS (μg/mg) 170 ± 13 142 ± 32 83 ± 21 67 ± 29 NA SUVA (m -1 -L/mg C)20 2.88 3.05 3.25 3.24 3.21 SUVA removal (%) 17.1 12.2 6.4 6.7 7.5 Alkalinity after 4 cycle and after 7 cycle (as CaCO3) 46; 36 48; 39 51; 41 44; 43 34; 33
Lake water characteristics
pH Alkalinity NH4 + NO2 Al/As/Ba NO3 -Conductivity 6.59 23 mg/L as CaCO3 1.4 ppm/ zero 0.13/<0.01 ppm 4.2 ppm 231 μS/cm DSF: Deinking sludge filter, HFF: Hemp fiber filter, PPF: Pulp and paper sludge filter, SFI: sand filter without above state agro material as a support but with inoculation, SF: sand filter without agro materials.
18 MDI= Morill Dispersion Index (MDI=1 for ideal plug flow condition, MDI= 23 for the completely stirred reactor) 19
Normalizing value of control (65 %), therefore assigned the value of MC-LR removal contribution set to zero.
20 Initial SUVA of the raw lake water is 3.47
ACCEPTED MANUSCRIPT
33
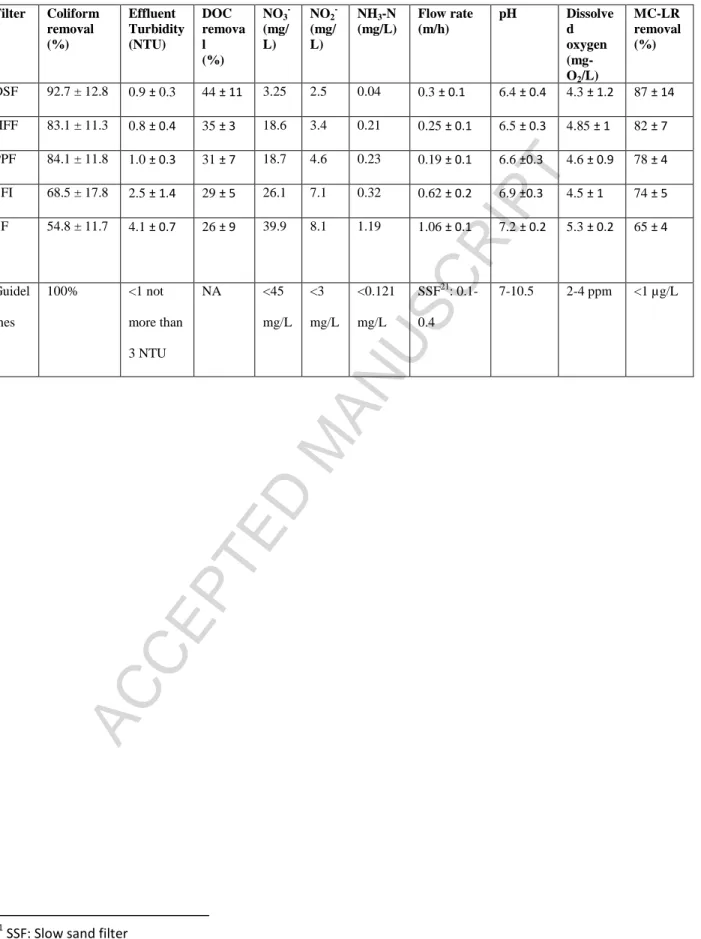
Table 2: Filter performance for water quality parameters
Filter Coliform removal (%) Effluent Turbidity (NTU) DOC remova l (%) NO3 -(mg/ L) NO2 -(mg/ L) NH3-N (mg/L) Flow rate (m/h) pH Dissolve d oxygen (mg-O2/L) MC-LR removal (%) DSF 92.7 ± 12.8 0.9 ± 0.3 44 ± 11 3.25 2.5 0.04 0.3 ± 0.1 6.4 ± 0.4 4.3 ± 1.2 87 ± 14 HFF 83.1 ± 11.3 0.8 ± 0.4 35 ± 3 18.6 3.4 0.21 0.25 ± 0.1 6.5 ± 0.3 4.85 ± 1 82 ± 7 PPF 84.1 ± 11.8 1.0 ± 0.3 31 ± 7 18.7 4.6 0.23 0.19 ± 0.1 6.6 ±0.3 4.6 ± 0.9 78 ± 4 SFI 68.5 ± 17.8 2.5 ± 1.4 29 ± 5 26.1 7.1 0.32 0.62 ± 0.2 6.9 ±0.3 4.5 ± 1 74 ± 5 SF 54.8 ± 11.7 4.1 ± 0.7 26 ± 9 39.9 8.1 1.19 1.06 ± 0.1 7.2 ± 0.2 5.3 ± 0.2 65 ± 4 Guidel ines 100% <1 not more than 3 NTU NA <45 mg/L <3 mg/L <0.121 mg/L SSF21: 0.1-0.4 7-10.5 2-4 ppm <1 µg/L 21
ACCEPTED MANUSCRIPT
34
Figure 1: Schematic representation of: A) Model sand filter (10 mm diameter, 120 mm length, 1
mm thickness) used for biofilm screening test using three co-culture bacteria with native
bacterial community isolated from filtration unit of a drinking water plant (Chryseobacterium sp. and Pseudomonas fragi = X): A: Arthrobacter ramosus, B = Bacillus sp., S = Sphingomonas sp. (This figure represents only the set-up for deinking sludge filter in replica, similar set-up for other tested filters. B) Agro-residue sand filters (as a support material for sand filter) and sand filter with A+X (SFI) and sand filter without any inoculum (SF) [Lake water refilled every time source tank gets over]
Figure 2: A) Crystal violet assay and B) MTT assay for agro-residue model sand filters and sand
filter (SFI) (all for screening purpose), tested with bacterial strains isolated from filtration unit of a drinking water plant (Chryseobacterium sp. and Pseudomonas fragi = X): in combination with three microcystin-degraders viz. A: Arthrobacter ramosus, B = Bacillus sp., S = Sphingomonas sp. (individually).
Figure 3: A) Flow rate; B) Dissolved organic carbon; C) Protein content and; D) cell
proliferation of biofilm sample obtained for all the filters tested during the biofilm development phase
Figure 4: Scanning electron microscopy images of agro-residue materials viz deinking sludge,
hemp fiber and paper-pulp sludge both before (A, D, G) and after (B, E, H) biofilm formation. A closer look (indicated by yellow color (length of 1 μm)) is also provided (C, F, I).
Figure 5: Microcystin-LR removal contribution due to: a) sand only (orange bar); b) bioactivity
(bio 1) within sand media (green bar); c) Agro-material and bioactivity within it (black bar) and d) undegraded portion (red bar)
Figure 6: Bio-profile of all five sand filters based on the quantification of A) cell biomass
ACCEPTED MANUSCRIPT
35 Highlights
Agro-residue materials in sand filter enhanced MC-LR removal mimicked in lake water Arthrobacter ramosus inoculated sand filter shown best MC-LR removal
Deinking sludge showed best organics removal in form of DOC, nitrate and ammonia Long-term performance needs improvement in terms of breakthrough period