Supporting Information for:
Temperature-induced molecular reorganization on Au(111) driven
by oligomeric defects
F. De Marchi,1,# G. Galeotti,1,2,# M. Simenas,3 M.C. Gallagher,4,* E. Hamzehpoor,5 O. MacLean,1 R. M. Rao,5 Y. Chen,5 D. Dettmann,2 G. Contini,2,6 E. E. Tornau,7 M. Ebrahimi,1,&* D.F. Perepichka,5,* F. Rosei1,*
1. Centre Energie, Matériaux et Télécommunications, Institut National de la Recherche Scientifique, 1650 Boulevard
Lionel-Boulet, Varennes, Québec, Canada J3X 1S2
2. Istituto di Struttura della Materia, CNR, Via Fosso del Cavaliere 100, 00133 Roma, Italy 3. Faculty of Physics, Vilnius University, Saulėtekio 9, LT-10222 Vilnius, Lithuania
4. Department of Physics, Lakehead University, 955 Oliver Rd, Thunder Bay, Ontario, Canada P7B 5E1
5. Department of Chemistry, McGill University, 801 Sherbrooke Street West, Montreal, Québec, Canada H3A 0B8 6. Department of Physics, University of Rome Tor Vergata, Via della Ricerca Scientifica 1, 00133 Roma, Italy 7. Semiconductor Physics Institute, Center for Physical Sciences and Technology, Saulėtekio 3, LT-10222 Vilnius,
Lithuania
# These authors contributed equally
* Corresponding author e-mail: [email protected]; [email protected]; [email protected];
& Present address: Department of Chemistry, Lakehead University, 955 Oliver Road Thunder Bay, Ontario, Canada P7B 5E1
Electronic Supplementary Material (ESI) for Nanoscale. This journal is © The Royal Society of Chemistry 2019
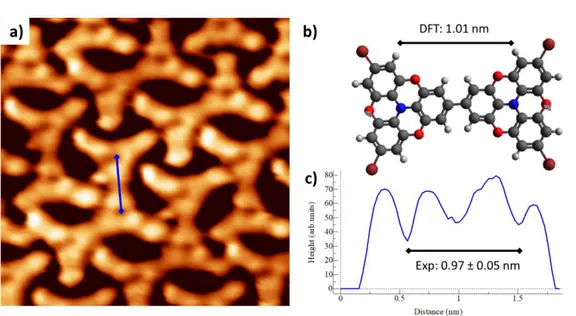
1. STM vs DFT distances
Figure S 1. 2.5×2.5 nm2 STM image of TBTANG on Au(111) at RT. b) gas phase DFT model of the intact model, with the
calculated Br-Br distance, compared with the experimental one obtained from STM line profile (c).
Figure S 2. 3×3 nm2 STM image of TBTANG on Au(111) at 100 °C. b) gas phase DFT model of a dimer, with the calculated N-N
2. Additional XPS data
Figure S 3. C1s, Br3p, O1s and N1s XPS spectra of TBTANG at different temperatures.
3. Additional DFT data
Figure S 4. Electrostatic potential (ESP) maps showing the interactions within a pair of molecules in the (a) Br∙∙∙Br phase, showing Br–Br and Br–H halogen bonding and (b) the Br∙∙∙O phase, showing primarily a Br–O interaction. The double polarization of the C–Br bond is reflected in the positive charge (blue) in the bond direction (σ-hole) and negative charge (red) around the Br atom (belt). The ESPs are expressed in atomic units (a.u., Rydberg/e) on 0.006 e/Bohr3 isodensity surfaces with a
color scale range of ±0.02 a.u..
4. Details of Monte Carlo simulations
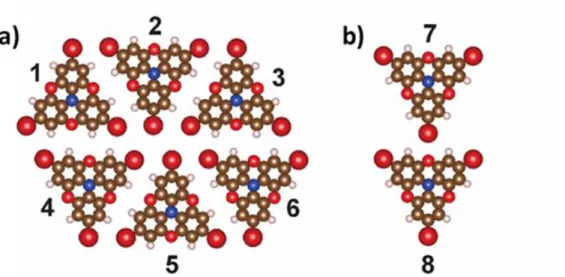
The main intermolecular interactions between the TBTANG molecules used for the MC simulations were determined by using DFT (B3LYP, 6-31G(d,p)). We calculated five different pair
interactions (1-2, 1-5, 2-4, 2-5, 3-4) of the six-molecule hexagon of the Br∙∙∙Br phase (Figure S5a) and also the main nearest neighbor interaction of the Br∙∙∙O phase (Figure S5b). The molecular pairs for the calculations of the intermolecular energy were isolated without further optimization from the extended structures of both phases as obtained by the PBC DFT explained in the main text.
The obtained interaction energies are given in Table S1 demonstrating that the dominant interaction in the Br∙∙∙Br phase is between the molecules “1” and “2”. This interaction corresponds to e1 in our model for the MC simulations (Figure 4a). In the halogen-halogen bonding scheme the 1-2 interaction is classified as combined X-bond and H-bond three-center binding motif (X2H synthon).1 Other calculated interactions are rather weak or weakly repulsive. Interaction 7-8 corresponds to e2 interaction in our model for TBTANG ordering (Figure 4b). Note that e2 ≈ 0.5e1.
Figure S 5. a) Six-molecule hexagon of the Br∙∙∙Br phase and b) fragment of the Br∙∙∙O phase as obtained by the PBC DFT.
Phase Br∙∙∙Br Br∙∙∙O
Interacting molecules 1-2 1-5 2-4 2-5 3-4 7-8 Energy (kcal/mol) -5.692 1.144 -0.284 0.139 0.586 -2.886
Bibliography
1. Gutzler, R.; Fu, C.; Dadvand, A.; Hua, Y.; MacLeod, J. M.; Rosei, F.; Perepichka, D. F., Halogen bonds in 2D supramolecular self-assembly of organic semiconductors. Nanoscale 2012, 4 (19), 5965-5971.
Table S1: Intermolecular interaction energies calculated by DFT (B3LYP, 6-31G(d,p)) using molecular arrangements obtained by the PBC DFT.

![■ SynthesisofPyrrolo[2,3 ‑ c ]isoquinolinesviatheCycloadditionofBenzynewithArylideneaminopyrroles:PhotophysicalandCrystallographicStudy](data:image/gif;base64,R0lGODlhAQABAIAAAP///wAAACH5BAEAAAAALAAAAAABAAEAAAICRAEAOw==)