COMPARISON OF THE STATISTICAL AND INFORMATION THEORY MEASURES:
APPLICATION TO AUTOMATIC MUSICAL GENRE CLASSIFICATION
‡Hassan Ezzaidi and †Jean Rouat
‡†Ermetis, Universit´e du Qu´ebec `a Chicoutimi, Chicoutimi, Qu´ebec, Canada, G7H 2B1
†NECOTIS, IMSI, Universit´e de Sherbrooke, Sherbrooke, Qu´ebec, Canada, J1K 2R1
[email protected], [email protected]
ABSTRACT
Recently considerable research has been conducted to re-trieve pertinent parameters and adequate models for auto-matic music genre classification using different databases. Many of previous works are derived from speech and speaker recognition techniques. In this paper, four measures are in-vestigated for mapping the features space to decision space. The first two measures are derived from second-order sta-tistical models and last measures are based upon informa-tion theory concepts. A Gaussian Mixture Model (GMM) is used as a baseline and reference system. For all exper-iments, the file sections used for testing have never been used during training. With matched conditions all examined measures yield the best and similar scores (almost 100%). With mismatched conditions, the proposed measures yield better scores than the GMM baseline system, especially for the short testing case. It is also observed that the average discrimination information measure is most appropriate for music category classifications and on the other hand the di-vergence measure is more suitable for music subcategory classifications.
1. INTRODUCTION
The considerable advances in audio technologies, the ac-cessibility to information via the Internet and the increasing production of digital music create many new needs to ex-ploit this large musical universe. One of these very popular needs is automatic genre classification.
Musical Genre is widely used to categorize and label the extremely vast world of music. This task can be achieved by human experts for the music industry or by consumers themselves. As a result, many different taxonomies are used to classify the same musical genres. This is related to the fact that many different descriptors and semantic ambigui-ties exist to determine genre classification [6]. For example, names of categories associated to each genre are not always similar or coherent including the hierarchical structure (sub-categories) itself. The manufacturing of new instruments
and the realization of new albums continue to accentuate this tendency. In the future, genre taxonomy will remain in an elastic and dynamical structure. As argued by Au-couturier et Pachet [6], genre may be used in intentional or extensional concept. For each concept, genre taxonomy is related to different interpretations at the descriptor level or at the semantical level. The authors describe three ap-proaches to establish musical genre classification: manual classification (projection of human or expert knowledge),
prescriptive approach that relies on supervised learning
us-ing signal processus-ing techniques (classify genre as they are found) and finally emergent classification approaches that are based on similarity measures to automatically produce the hierarchical genre structure. We propose (for musical genre classification) to investigate new classification tech-niques based on second order and information measures. The prescriptive approach (classify genre as they are found) is adopted in this work. The measures were derived from statistical models and information theoretical concept. They have been already used in the context of speaker identifica-tion systems but never used for musical genre classificaidentifica-tion. Moreover, the interest of the proposed technique resides pri-marily on the simplicity of its mathematical formalism and on its potential to be implemented for real or differed time applications. It requires little memory capacity to store the reference prototypes (2 parameters), not much computing time and remains very flexible over the testing/training du-ration. The parameters can be recursively estimated when the time duration of musical piece is long enough. Exper-iments are carried out according to different strategies as matched and mismatched conditions, long or short testing with either long or short training. All proposed measures are evaluated in their asymmetrical form with two prescrip-tive genre taxonomies. Results are compared to a Gaussian Mixture Model (GMM) recognizer system.
2. RELATED WORK
Several works are proposed to extract genre information features from the musical signal. The majority of them are
inspired from speech/speaker recognition and music/speech discrimination systems. Several features and models pro-posed and experimented for genre classification can be found in [10] [7] [8].
Generally, parameters can be divided into three feature families. The first family represents the timbral texture of audio signal and usually comprises the following features [8] [9] [7]: Spectral Centroid, Spectral Centroid, Spectral Rollof, Zero crossing Rate, Fast Fourier transform, Spectral Flux, Mel Frequency Cepstral and Linear Prediction Coefficients. The second family represents the rhythmic content fea-tures as proposed in [9]. Theses feafea-tures are based on de-tecting the periodicities of the signal. For the extraction of theses features, a discrete wavelet transform, envelope ex-traction, autocorrelation function and finally the peak de-tection are elaborated to built a beat histogram.
The third family is based on pitch content features [9] [10]. The pitch features are based on a pitch histogram ob-tained from multiple pitch detections. The pitch histogram describe the harmonic content of the musical signal. Five features are extracted from the pitch histogram and used for musical genre classification.
Other features have been proposed and experimented
for automatic genre classification such as the audio low-level descriptor in the context of MPEG-7 standard, Root mean square, periodicity rate, various order central moments [3].
The majority of proposed works in automatic musical genre classification, use Gaussian Mixture models (GMM) which we use here as a reference system. The reader is refereed to other alternatives in [10], and [9].
3. PROPOSED CLASSIFICATION MEASURES 3.1. Second-order statistical measures
Recognition based on second-order statistical measures was initially proposed and tested in the context of text indepen-dent speaker iindepen-dentification by Bimbot et al. [1].
Let {mR(i)}1≤i≤M be a sequence of M independent
parameter vectors related to the source information noted as R, extracted from an acoustical signal. All vectors are p-dimensional, assumed to be independent and distributed like a Gaussian function. Therefore, they are characterized in the parametric form only by 2 parameters: a mean vector noted mRand a covariance matrix noted ΣRas:
mR= M1 Pi=M
i=1 mR(i) ΣR=M1
Pi=M
i=1 (mR(i) − mR)T(mR(i) − mR)
where ( )T is the transpose.
Similarly, a sequence of N vectors ({mT(i)}1≤i≤N)
cor-responds to a target information source to be classified and that obeys to the same properties as the reference source.
Hence, the target source can be represented by 2 parame-ters: the mean vector mT and the covariance matrix ΣT.
The asymmetrized similarity measure noted µG(R, T ),
derived from the averaged log-likelihood of N tested obser-vations [1] is defined as:
µG(R, T ) = 1 p[tr(ΣTΣ −1 R )−log( detΣT detΣR )+∆T mΣ−1R ∆m]−1 (1) where:mT−mR= ∆m, p = M (number of Ref erence f eatures)N (number of T est f eatures) ,
tr() is the matrix trace, det() is the matrix determinant.
The arithmetic-geometric sphericity measure is also used and defined as:
µSc(R, T ) = log(tr(ΣTΣ −1 R ) p ) − log(( detΣT detΣR )−1/p) (2)
It was initially proposed and tested in the context of speaker recognition for text-dependent experiments and later used by Bimbot et al. [1] for text-independent speaker identifica-tion.
3.2. Information theory measures
A discrimination information in the Bayes classifier sense, for class ωRversus class ωT, can be measured by the
loga-rithm of likelihood ratio as defined in [4]:
µR,T = ln{
pR(x)
pT(x)}
(3)
where pR(x) and pT(x) correspond to the probability
densities for the reference and target classes, respectively. The averaged information for class ωR versus class ωT is
the expectation of µR,T and is defined as:
IR,T = Z x pR(x)ln{pR(x) pT(x)}dx (4)
If the distribution of each class is assumed to be Gaus-sian and multivariate, IR,Tcan be expressed in another form
according to mean vector and covariance matrix:
IR,T = 0.5(ln(|ΣT| |ΣR| )+tr[ΣR(∆Σ−1T R)]+tr[Σ−1T ∆m∆Tm]) (5) where: ∆m= mR− mT, ∆Σ−1T R= Σ−1T − Σ−1R , ∆Σ−1RT = Σ−1R − Σ−1T and ∆ΣRT = ΣR− ΣT.
A divergence measure or total average information
dis-crimination is defined as the sum of the average information
discrimination IR,T and IT,Rand can be expressed as:
JR,T = tr[∆ΣRT∆Σ−1T R] 2 + tr[∆Σ−1 RT∆m∆Tm] 2 ) (6)
Table 1. Score recognition (%) for matched conditions; long train/test µG µSc Iij Jij Categories µ(T, R) 98 95 98 99 (12) µ(R, T ) 98 95 98 99 Subcategories µ(T, R) 97 93 96 97 (40) µ(R, T ) 96 94 97 97
Table 2. Score recognition (in%) for matched conditions;
long train/test µG µSc Iij Jij Categories µ(T, R) 98 97 98 99 (11) µ(R, T ) 97 95 98 99 Subcategories µ(T, R) 97 90 96 98 (29) µ(R, T ) 96 94 97 98
This divergence provides a dissimilarity measure between the normally distributed classes ωR and ωT. The
informa-tion discriminainforma-tion IR,T and divergence JR,T are tested in
the context of automatic musical genre classification. The development and details for equations 5 and 6 can be found in [4]. The motivation for theses measures is based on the fact that the musical signal is generally characterized by rhythmicity and regularity which cover a long temporal pe-riod1. Also, all proposed measures assume that each group
or class is characterized by multivariate normal distribu-tions.
4. FEATURES EXTRACTION AND THE REFERENCE SYSTEM
4.1. Music database
The RWC Music Database [5] is a copyright-cleared music database and it is the world’s first large-scale music database compiled specifically for research purposes. It is composed of 100 musical pieces: 73 pieces originally composed and arranged and 27 pieces come from the public-domain. Among the many characteristics of the RWC database, this includes the following: 91.6 hours recording, performance of about 150 instrument bodies, variations for each instrument, vari-ations in instrument manufacturers and musicians, different manufacturer/different musician, wide variety of sounds. The music database (RWC) is divided into main categories and subcategories of genres (see [5]). as illustrated in
4.2. Feature vector extraction
Each musical piece is first downsampled from 44.4Khz to 16Khz. Then the musical signal is divided into frames of
1without forgetting periodicity of the rhythmicity
Table 3. Score recognition (in%) for mismatched
condi-tions; long train/test
µG µSc Iij Jij
Categories µ(T, R) 70 58 75 70 (12) µ(R, T ) 75 58 70 70 Subcategories µ(T, R) 60 43 58 62 (40) µ(R, T ) 58 48 60 62
Table 4. Score recognition (in%) for mismatched
condi-tions; long train/test
µG µSc Iij Jij
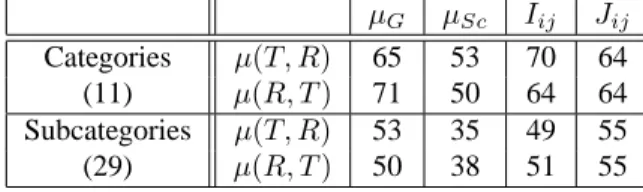
Categories µ(T, R) 65 53 70 64 (11) µ(R, T ) 71 50 64 64 Subcategories µ(T, R) 53 35 49 55 (29) µ(R, T ) 50 38 51 55
1024 samples with 50% overlap. It is assumed that the musical signal is more stable and quasi-stationary than the speech signal where coarticulation is dominant. For each frame, a Hamming window is applied without pre-emphasis. Then, 29 averaged Spectral energies are obtained from a bank of 29 Mel triangular filters followed by a discrete co-sine transform, yielding 12 Mel frequency Cesptrum Coef-ficients. Cepstral mean normalization is not used because it removes important genre attributes that characterize the piece style (see [2]) . Since one uses a classifier based on time averaged measures, we assume that the influence of delta and delta-delta MFCC coefficients is not of major im-portance.
4.3. The reference system
For comparison purposes, Gaussian Mixture Models (GMM) of the MFCC is used and 16 mixtures and diagonal covari-ance matrices are estimated via the Expectation Maximiza-tion (EM) algorithm.
Table 5. Score recognition (in%) for matched conditions;
long train and short test
µG µSc Iij Jij
Categories µ(T, R) 95 92 96 97 (12) µ(R, T ) 96 96 95 97 Subcategories µ(T, R) 94 87 89 93 (40) µ(R, T ) 89 87 93 93
5. EXPERIMENTS 5.1. Prescriptive taxonomies
We found that, in the RWC database, the number of mu-sical pieces corresponding to each subcategory are not the same. This suggests the use of two procedures: i) Keep only the subcategories which number of musical pieces is three. In that case we obtain 9 categories and 29 subcate-gories(see [5]). ii) Use all the existent 12 categories and 40 subcategories.
5.2. Experiments
For each musical piece, the first half of the signal is used for training only, then long or short testing is performed on the remaining half (long) or on one minute from the second half (short). Matched and mismatched conditions are also reported for each strategy. Matched conditions refer to ex-periments where each musical piece is used in training (first half piece) and testing sessions (second half piece). Mis-matched conditions refer to experiments where the musical test piece was never used or presented during the training session. This can be useful to simulate new musical pieces and to evaluate the systems performance for new genre clas-sification.
6. RECOGNITION CRITERION
During the training session, mean vectors and covariance matrices are estimated and stored as prototype reference to characterize each musical genre. The indice R is used to design the reference. Similarly, during the testing session, the measures between the test file and all reference types of musical genre are evaluated. The reference proto-type style with the minimal distance to the test is assigned to the recognized style.
7. RESULTS AND DISCUSSION
All measures presented in section 3 have been used. They are tested in their asymmetrical form U (X, Y ) and U (Y, X), except for the divergence distance that is originally sym-metrical. All results presented here are based on supervised learning techniques.
Two structures were defined for the RWC database, each comprising two levels with a different node number on each level. We are interested in automatically reproduce the pro-posed taxonomy of the RWC musical database. For each category and subcategory, results are reported on tables 1 to 8. Table 9 illustrates the recognition scores of the GMM reference system for each strategy and specific experimen-tal conditions. Tables 1 to 8 report the scores for the two
Table 6. Score recognition (in%) for matched conditions;
long train and short test
µG µSc Iij Jij
Categories µ(T, R) 96 94 96 97 (11) µ(R, T ) 96 96 96 97 Subcategories µ(T, R) 95 89 88 92 (29) µ(R, T ) 88 87 93 92
Table 7. Score recognition (in%) for mismatched
condi-tions; long train and short test
µG µSc Iij Jij
Categories µ(T, R) 65 60 73 68 (12) µ(R, T ) 70 58 65 68 Subcategories µ(T, R) 52 43 53 58 (40) µ(R, T ) 43 43 53 58
second-order statistical and two information theoretical mea-sures for all strategies and experimental conditions. Each measure µG, µSc, Ii,j, Ji,j and GM M models, is tested
and evaluated for the high hierarchical level where the clas-sification is carried out based on the category label, and on a lower level where the classification is carried out based on the subcategory label (see [5]).
7.1. Matched conditions
For all experiments the best performance (for every mea-sures and training/testing conditions) is observed for the matched conditions. Precisely, with the µG measure, we
obtain recognition scores from 94% to 98% for genre clas-sification by categories and from 88% to 97% when genre classification was addressed by subcategories. With the µSc
measure, we obtain recognition scores from 94% to 97% for genre classification by categories and from 87% to 94% when genre classification was addressed by subcategories. With the Ii,j measure, we obtain recognition scores from
95% to 98% for genre classification by categories and from 88% to 97% when genre classification was addressed by subcategories. With the Ji,j measure, we obtain
recogni-tion scores from 97% to 99% for genre classificarecogni-tion by cat-egories and from 92% to 97% when genre classification was
Table 8. Score recognition (in%) for mismatched
condi-tions; long train and short test
µG µSc Iij Jij
Categories µ(T, R) 58 55 67 60 (11) µ(R, T ) 64 58 55 60 Subcategories µ(T, R) 42 36 42 48 (29) µ(R, T ) 43 36 40 48
addressed by subcategories. Scores for these different mea-sures and strategies remain similar with the matched con-ditions. It is also observed that the long and short testing does not have many influence on the scores. The good per-formance obtained with the proposed measures confirm that previous theoretical assumptions are probably verified. We recall that the parameters are assumed to be Gaussian. This assumption would be too restrictive when analyzing speech and better fits the music distribution.
7.2. Mismatched conditions
For mismatched conditions, where tests were never seen during training sessions, the scores drop significantly. The recognition scores varied from 50% to 75% for the genre classification by categories, and from 35% to 62% by sub-categories. The information theoretical measures seems to be more interesting and yield the best scores in comparison to the other measures for all experimental strategies. Partic-ularly, it is observed that the discrimination measure Ii,j
yields a better score when the classification is addressed by category. When the problem is addressed to subcate-gories, the best score is obtained with the divergence mea-sure Ji,j. However, the decrease in performance with
mis-matched conditions can partially be explained by the fact that human experts themselves do not always agree on the category or sub-category for a specific musical. Further-more, the auditory system is able to perceive subtle features (likes tremolo, hangs of rhythm,etc..) that are not encoded in the MFCC parameters.
7.3. Reference system
The reference classification system yields the same recog-nition rates in matched conditions comparatively to the pro-posed measures, except with short testing utterances where the score drops significantly to 30%. With mismatched con-ditions, recognition scores of categories are similar for all measures. But with subcategories, the best performance of the reference system is globally 10% lower than µG, Iijand
Jij.
7.4. Graphical analysis
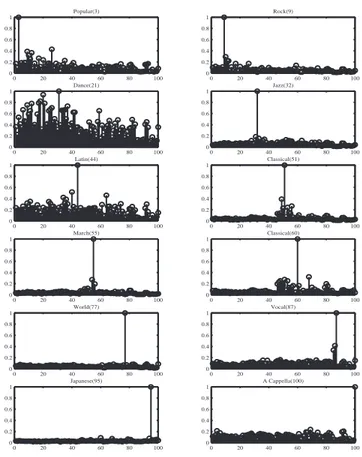
Figure 1 reports results of the divergence measure for the classification of 100 musical pieces into 12 categories for the matched conditions. The same analysis can be carried out for other scenarios as classification into 33 subcategories. It also predicts the performance and behavior of the system against style of musics not presented in training (never seen before). The inverse is used on the figure for an easier inter-pretation even if the minimization of the divergence is the classification criterion. Each subplot corresponds to ones
0 20 40 60 80 100 0 0.2 0.4 0.6 0.8 1 Popular(3) 0 20 40 60 80 100 0 0.2 0.4 0.6 0.8 1 Rock(9) 0 20 40 60 80 100 0 0.2 0.4 0.6 0.8 1 Dance(21) 0 20 40 60 80 100 0 0.2 0.4 0.6 0.8 1 Jazz(32) 0 20 40 60 80 100 0 0.2 0.4 0.6 0.8 1 Latin(44) 0 20 40 60 80 100 0 0.2 0.4 0.6 0.8 1 Classical(51) 0 20 40 60 80 100 0 0.2 0.4 0.6 0.8 1 March(55) 0 20 40 60 80 100 0 0.2 0.4 0.6 0.8 1 Classical(60) 0 20 40 60 80 100 0 0.2 0.4 0.6 0.8 1 World(77) 0 20 40 60 80 100 0 0.2 0.4 0.6 0.8 1 Vocal(87) 0 20 40 60 80 100 0 0.2 0.4 0.6 0.8 1 Japanese(95) 0 20 40 60 80 100 0 0.2 0.4 0.6 0.8 1 A Cappella(100)
Fig. 1. Results of the divergence measure for the
classifi-cation of 100 musical pieces into 12 categories. The x axis is the label (number from 1 to 100) associated to each mu-sical file of the RWC database. The file numbers are the same than the ones used in the description file of the RWC database (see [5]). For example, the first category includes 6 musical pieces which are labeled 1 to 6 on the x axis. Rock category contains also 6 musical pieces that are labeled from 7 to 12 and so on. Vertical axis corresponds to the inverse of the divergence measure. For each subplot, the title speci-fies the name of the category of the file presented in test and between parenthesis its order (label).
of the 12 categories. For each subplot, one musical test-ing piece correspondtest-ing to the category is randomly cho-sen. The divergence measure is computed from 100 ref-erence prototypes estimated during the training session as mentioned in section 5.2. The normalized inversion of all measures is reported in the 12 subplots. Most of the tested files were correctly classified. Moreover, a significant dif-ference of the similarity measure between the recognized model and the others can be highlighted. This confirms the good performance obtained with the matched conditions. To simulate the mismatched conditions, the reference pro-totype corresponding to each test file is ignored. In this con-text, only the similarity measures estimated from the others prototypes (models) are considered and compared. Only 5 categories are well identified (Rock, Jazz, Classical, March and Vocal). This is because files from the same category as the test file yield the best similarity measure. However, the others styles are badly discriminated. The badly recognized categories are characterized with a small inter-variability. Several prototypes should then be used for each of these categories. From these results, one can see that unsuper-vised musical genre classification would yield a different taxonomy than the one given on the RWC database.
8. CONCLUSION
Automatic musical genre taxonomy has been realized. It is based on four statistical measures. They were already used in the context of text independent speaker identification. Matched/mismatched and long/short testing strategies have been studied. The best results were observed in all matching conditions and yielded score until 99% and 98% recognition for categories and subcategories, respectively. Worst results were observed in all mismatched conditions and decreased to about 75% and 60% for categories and subcategories, re-spectively. A Gaussian Mixture Model is used as a reference system. In mismatched conditions, the proposed measures yield better scores than the reference system especially for the short testing case. Particularly, it is observed that the av-eraged discrimination information measure is most appro-priate for musical categories classification and on the other hand the divergence measure is most suitable for music sub-categories classification. In future works, we propose to fur-ther study theses measures since they yielded better scores and only two parameters are required, the mean vector (x12) and the covariance matrix (12x12) for each prototype. We plan to adapt this technique to unsupervised musical genre classification in the same conditions. We will focus our re-search on the automatic generation of new categories and subcategories.
Table 9. GMM score recognition (in%) for matched
mis-matched conditions.
time matched mismatched Categories 11 long 100 73 short 81 60 Categories 12 long 100 75 short 81 61 Subcategories 34 long 100 44 short 80 38 Subcategories 40 long 95 50 short 77 42 9. REFERENCES
[1] Fr´ed´eric Bimbot, Ivan Magrin-Chagnolleau and Luc Mathan, Second-Order Statistical Measures for Text-Independent Speaker Identification, In Speech
Com-munication, pp. 177-192, Vol. 17, 1995.
[2] H. Ezzaidi and J. Rouat, Speech, music and songs dis-crimination in the context of handsets variability, In
proceedings of ICSLP 2002, 16-20 September 2002.
[3] FT. Lambrou, P. Kudumakis, M. Sandler, R. Speller and A. Linney, Classification of Audio Signals using Statistical Features on Time and Wavelet Transform Domains, In IEEE ICASSP 98, May 1998, Seattle, USA.
[4] J. Tou and R. Gonzalez. Pattern recognition princi-ples, Addison-Wesley Publishinig Company, Reading, Massachusetts , 1974.
[5] Masataka Goto, Hiroki Hashiguchi, Takuichi Nishimura, and Ryuichi Oka,RWC Music Database: Music Genre Database and Musical Instrument Sound Database,ISMIR, pp. 229-230, October 2003. [6] Aucouturier, J.J and Pachet, F. Musical Genre: a
Sur-vey. In Journal of New Music Research, Vol. 32, No 1, pp.83-93, 2003.
[7] H. Soltau, T. Schultz, M. Westphal, and A. Waibel. Recognition of Musical Types. In Proceedings
ICASSP., May 1998, vol. 2, pp. 11371140.
[8] Tzanetakis, G., Essl, G., and Cook, P., Automatic Mu-sical Genre Classification of Audio Signals, In
Pro-ceedings of the 2001 International Symposium on Mu-sic Information Retrieval., 2001.
[9] Tzanetakis, G., and P. R. Cook, Musical Genre Clas-sification of Audio Signals, In IEEE Transactions on
Speech and Audio, July, 2002.
[10] Li, Tao and Tzanetakis, George, Factors in Auto-matic Musical Genre Classification of Audio Signals, In Proc. IEEE WASPAA, New Paltz, NY October 2003.