© Tohid Naseri, 2020
Mixed-mode model for studying microstructural
evolution of precipitates inside Aluminum alloys
Thèse
Tohid Naseri
Doctorat en génie des matériaux et de la métallurgie
Philosophiæ doctor (Ph. D.)
Mixed-mode model for studying microstructural
evolution of precipitates inside Aluminum alloys
Thèse
Tohid Naseri
Sous la direction de:
iii
Résumé
L'aluminium est l'un des métaux non ferreux les plus utilisés dans le monde avec une large gamme d'applications de la batterie de cuisine simple au vaisseau spatial avancé. Au fait, avec des applications où des propriétés mécaniques élevées sont nécessaires, comme dans l'industrie automobile, une considération technique est requise pour améliorer les propriétés mécaniques. Comme la distribution finale des précipités joue un rôle crucial dans les propriétés mécaniques de ces alliages, une meilleure compréhension de l'évolution de la microstructure et cinétique des précipitations peut aider sensiblement la conception du procédé de traitement thermique des alliages d'aluminium. Cependant, en raison de la taille et de la morphologie des précipités, les études expérimentales de la précipitation et les méthodes de caractérisation avancée requises comme la microscopie électronique à transmission sont coûteuses et nécessitent beaucoup d’expertises techniques. Les méthodes numériques, lorsqu’elles sont à point, peuvent s’avérer comme étant un outil très utile pour évaluer l'évolution des précipités et les propriétés mécaniques correspondantes. Cette étude présente un modèle cinétique de précipitation. Contrairement à de nombreuses études qui portent principalement sur la diffusion et l’énergie de d’interface, nous considérons la mobilité interfaciale comme étant la variable ayant un réel impact dans la cinétique de croissance des différents types de précipités. Cette variable, non seulement offre la possibilité d’étudier l’évolution des précipités des alliages multi éléments, mais permet aussi d’améliorer les performances de calcul. En outre, l'autre aspect positif de ce modèle est la possibilité de travailler avec des alliages industriels complexes multiphasés en considérant la croissance et la dissolution de différents types de précipités simultanément.
iv
Abstract
Aluminum is one of the most used non-ferrous metal in the world with an enormous range of applications from simple kitchenware to advanced spacecraft. In applications where high mechanical properties are needed, like in the car industry, it is strongly required to improve the mechanical properties. As the final distribution of precipitates plays a crucial role in mechanical properties of these alloys, a better understanding of the microstructural evolution and kinetics of precipitation can help noticeably the design of the heat treatment process of aluminum alloys. However, due to the size and morphology of the precipitates, experimental studies of the precipitation required advanced characterization methods like transmission electron microscopy which is not an industrially favorable technique since it is costly and required a lot of technical expertise. Numerical investigation can be a desirable tool to model the evolution of the precipitates and the corresponding mechanical properties. This study presents a kinetic model of precipitation. Unlike many studies that mainly focus on the diffusion and surface energy, we consider interfacial mobility as an effective variable in a mixed-mode model. This variable not only provides us the possibility to study the precipitates’ evolution in multicomponent alloys but also can boost the calculation performance. Moreover, the other superiority of this model is the possibility of working with complex multiphase industrial Al alloys by considering the growth and the dissolution of different types of precipitates simultaneously.
v
Table of Contents
Résumé ... iii Abstract ... iv Table of Contents ... v List of Figures ... ixList of Tables ... xiii
Dedication ... xiv
Acknowledgment ... xv
Preface ... xvi
Introduction ... 1
Chapters 1: Literature Review ... 3
1.1 Background ... 3 1.2 θ family precipitates ... 4 1.3 β family precipitates ... 5 1.4 Q family precipitates ... 6 1.5 Importance of precipitates ... 7 1.6 Homogeneous nucleation ... 8 1.7 Heterogeneous nucleation ... 9
1.8 Classical Nucleation Theory ... 9
1.8.1 Homogenous nucleation rate ... 10
1.8.2 Heterogenous nucleation rate ... 10
1.8.3 Applying of CNT and challenges ... 11
1.9 Sequence of precipitation ... 11
1.9.1 Role of interfacial energy ... 11
1.9.2 Role of elastic strain energy ... 12
1.9.3 Role of the chemical driving force ... 13
vi
1.10 Intermediate phases ... 15
1.11 Intermetallic compounds ... 16
1.12 Diffusion in intermetallic compounds ... 17
1.13 Sub-critical growth ... 20
1.14 Growth kinetics of the and particles, the role of the interfacial mobility ... 23
1.15 Ledge mechanism ... 24
1.16 Diffusion and its laws ... 25
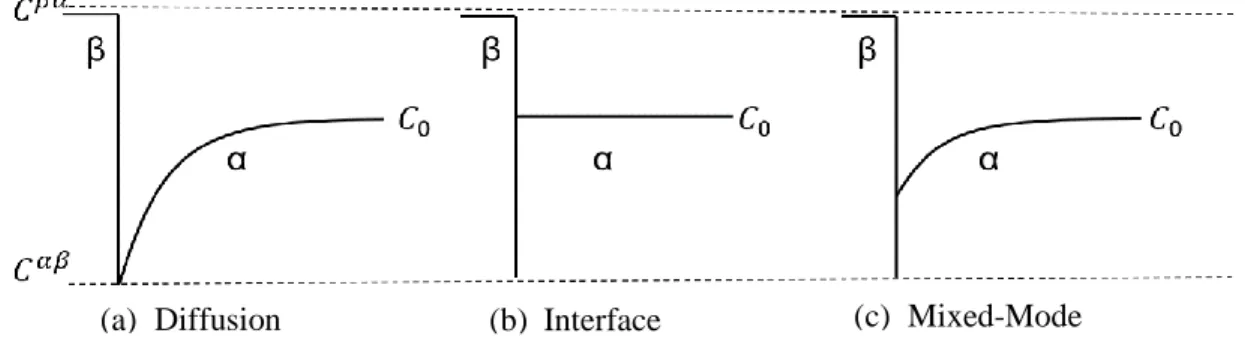
1.17 Different growth mechanisms ... 26
1.18 Zener model ... 28
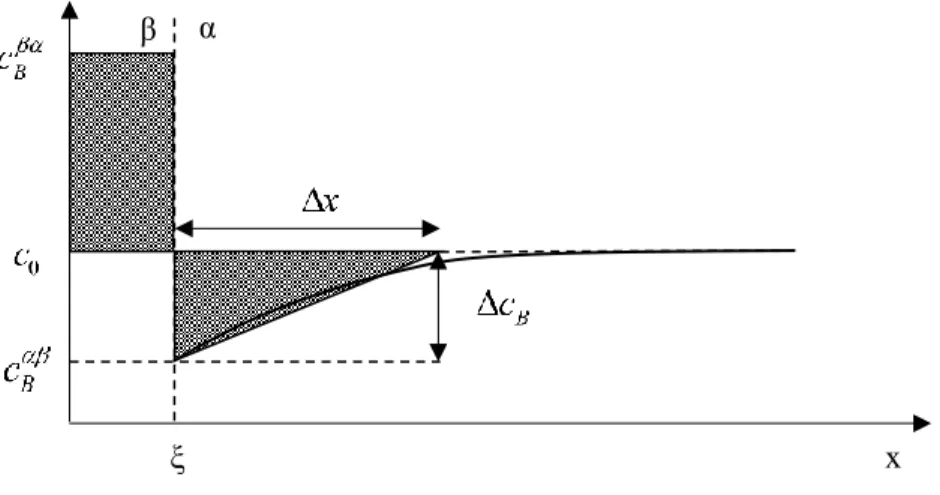
1.19 Stationary approximation ... 30
1.20 The general solution for a binary system ... 32
1.21 Diffusion control model of multicomponent precipitates ... 33
1.22 Geometry of precipitates ... 34
1.23 Mixed-Mode ... 34
1.23.1 Background ... 34
1.23.2 Case study (mixed-mode growth of ellipsoidal precipitate in the quasi-stationary regime) ... 35
1.24 KWN Model ... 40
1.25 Thermo-kinetic model of the MatCalc package ... 42
1.26 DSC and studying the precipitation ... 44
1.27 DSC modeling ... 45
Chapters 2: Objectives and Methodology ... 52
2.1 Hypothesis ... 52
2.2 Objectives ... 52
2.3 Methodology ... 52
2.3.1 Programming ... 52
vii
2.3.3 Driving force and geometry of the precipitates ... 54
2.3.4 Model verification and interfacial mobility ... 54
Chapters 3: Mixed-mode growth of a multicomponent precipitate in the quasi-steady state regime 55 3.1 Résumé ... 56
3.2 Abstract ... 56
3.3 Introduction ... 56
3.3.1 The role of interfacial mobility in the early stage of the growth ... 58
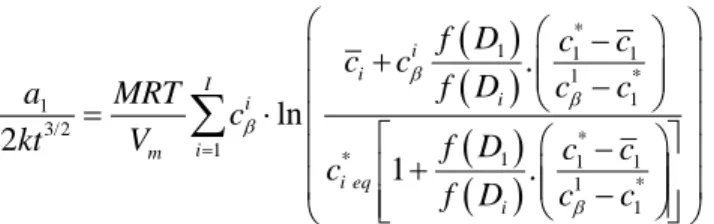
3.4 Mathematical analysis ... 60
3.5 Application of the model ... 62
3.6 Results ... 63
3.7 Discussion ... 65
3.8 Conclusion ... 69
3.9 Acknowledgements ... 69
Chapters 4: Analytical Modeling of the Mixed-Mode Growth and Dissolution of Precipitates in a Finite System ... 70
4.1 Résumé ... 71
4.2 Abstract ... 71
4.3 Introduction ... 71
4.4 Dissolution in the Quasi-Stationary Regime of an Ellipsoidal Precipitate ... 73
4.5 Application of the model ... 77
4.6 Growth and Dissolution in a Finite System ... 78
4.7 Application of the Model ... 80
4.8 Discussion ... 85
4.9 Conclusion ... 86
4.10 Appendix A ... 86
Chapters 5: Multiphase Modeling of the Growth Kinetics of Precipitates in Al-Cu alloys during Artificial Aging ... 91
viii
5.2 Abstract ... 92
5.3 Introduction ... 93
5.4 Methodology ... 96
5.4.1 Initial conditions during the subcritical growth regime ... 96
5.4.2 Evolution equations for the mixed-mode regime ... 97
5.4.3 Upgrading the size of precipitates and the average composition of the matrix ... 98
5.4.4 Using the model to depict the DSC thermograms ... 100
5.5 Application of the model ... 100
5.6 Results ... 102
5.7 Discussion ... 109
5.8 Conclusion ... 112
5.9 Acknowledgments ... 112
5.10 Conflicts of Interest ... 112
Conclusions and Perspectives ... 113
Overview of the project ... 113
Conclusions ... 113
Perspectives ... 113
References ... 115
Appendix: Details of the numerical model... 120
MatCalc calculation ... 120
User interface versus scripting ... 124
Sample script ... 125
Boost C++ Library ... 128
Installation ... 128
Boost Examples ... 131
ix
List of Figures
Figure 1. The microstructure of the Al-3.5 wt% Cu (a) as-cast and (b) as-quenched after SHT [9] .. 3 Figure 2. (a) Al-Cu phase diagram with metastable phases [13] (b, c) Transmission electron microscope micrograph of Al-1.7 at.% Cu where (b) GP platelets observed in the <1 0 0 >Al zone after aging at 438 K for 8 h, (c) precipitates observed after aging at 463 K for 8 h [15]. ... 5 Figure 3. (a) Vickers hardness evolution of the three Al-Si-Mg alloys (various content of Si) with aging time at 443 K,(b) TEM micrographs at peak-aging condition, (c) HRTEM image of a representative β precipitate from a peak-aged sample [23]. ... 6 Figure 4. Evolution of yield stress vs. aging time of AA6111 within the temperature range of 140-220 °C [36] ... 7 Figure 5. Schematic of free energy variation vs particle size of a new phase ... 8 Figure 6. Al-Cu Phase diagram including metastable phases [13]. ... 13 Figure 7. (a) Free energy curve for intermediate phase with a narrow stability range, (b) free energy curve for the intermediate phase with a wide stability range [13] ... 16 Figure 8. (a) schematic structure of an ordered binary alloy, (b) schematic of vacancy diffusion based on the six-jump cycle [54] ... 17 Figure 9. Schematic of activation energy for a vacancy diffusion with six-jump cycle [54] ... 18 Figure 10. Composition dependence of the diffusion of Ni atoms in AlNi intermetallic compound [56] ... 18 Figure 11. Composition dependence of the activation energy for the diffusion in AlNi intermetallic compound [56] ... 19 Figure 12. Composition dependence of Ni diffusion in AlNi at different temperatures based on the atomistic model calculation [55]; The U parameter is related to the strength of the atomic bond and it was defined based on the required energy for the vacancies formation. ... 19 Figure 13. Schematic of a binary phase diagram ... 20 Figure 14. Schematic of the energy barrier against the growth of an isolated embryo. ... 21 Figure 15. Evolution of the precipitate cluster sizes vs simulation time using the Monte Carlo approach; a* is a parameter describing the affinity of the vacancy to either solvent or solute atoms [57]. ... 22 Figure 16. Time evolution of an embryo containing i atoms, result of the Monte Carlo simulation [41] ... 22 Figure 17. Schematic of the ledge mechanism [13]. ... 24 Figure 18. Schematic diagram of showing ledges on Mg2Si plates in an Al-Mg-Si alloy [13]. ... 24
x
Figure 19. Schematics of different mechanisms for interface migration between two phases. ... 28
Figure 20. Zener approximation for diffusion control growth of spherical precipitate. ... 29
Figure 21. Schematic of concentration field in stationary approximation ... 31
Figure 22. Expected evolution of the boundary velocity of a growing ellipsoidal precipitate ... 38
Figure 23. (a) Size evolution (b) c* evolution of an oblate particle growing in an Aluminum matrix containing 0.03 molar fraction of Cu [59]. ... 40
Figure 24. Heat flow comparison between the model and the DSC experiment due to the formation and dissolution of the S phase within the thermal range 100-500 °C [79]. ... 42
Figure 25. (a) Heat flux comparison between model and simulation within Al-Mg-Si alloy, (b) Evolution of phase fraction versus temperature [87]. ... 44
Figure 26. Schematic of DSC heat flux cell [88] ... 45
Figure 27. Comparison between simulated and experimental DSC curve of Al-4 wt%Zn-2 wt%Mg alloy under a 5 K /min constant heating rate [88]. ... 47
Figure 28. Comparison between simulated and experimental DSC curve of AA 7075 alloy under a 5 K/min constant heating rate [88]. ... 48
Figure 29. Simulated heat flow versus DSC experiment during continuous heating [86]. ... 48
Figure 30. Simulated result for mean radius evolution of precipitates within Al-1at% Mg-1.2at% Si under 20 °C/min constant heating rate [91]. ... 49
Figure 31. Comparison between simulated and experimental study of Al-Mg-Si alloy under 5
°C/min constant heating rate,(a) DSC curve (b) Evolution of Number density (count/m3) of second phases [92]. ... 51
Figure 32. Time evolution of the semi-axis length a1 calculated using 2 different interfacial mobilities. ... 63
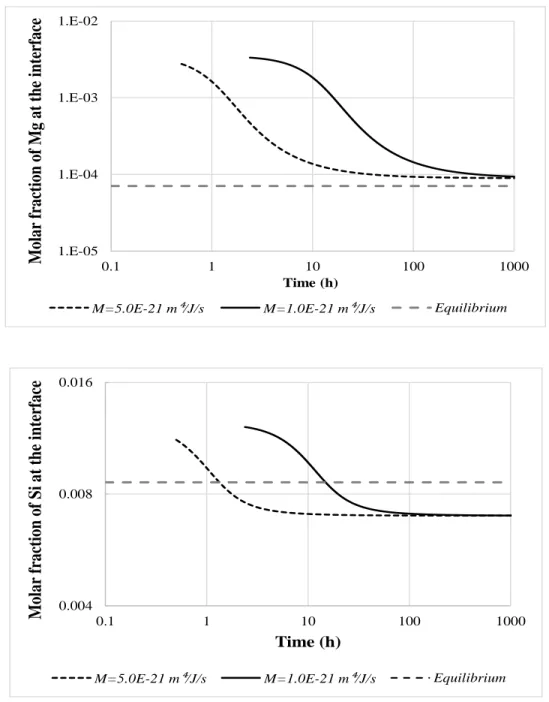
Figure 33. Time evolution of the solute molar fractions at the interface of a needle-shape ’’ precipitate growing in an aluminium matrix as calculated by the mixed-mode model. ... 64
Figure 34. Evolution of the solute molar fractions at the interface as calculated by the two models. ... 68
Figure 35. Relationship between the stationary (x) and the moving (x′) reference frames for a precipitate growing at the expense of the matrix. ... 74
Figure 36. The concentration profile along the main axis of a dissolving ellipsoidal precipitate. The coordinate is defined in the ellipsoidal system of coordinates. ... 76
Figure 37. Evolutions of (a) the radius and (b) the Cu molar fraction at the interface of a spherical -Al2Cu precipitate dissolving in an infinite matrix with different values of the interfacial mobility. ... 78
xi
Figure 38. Schematic of the time discretization technique evaluating the interface velocity in the finite system. ... 80 Figure 39. Coefficient of diffusion as a function of the Cu molar fraction in an Aluminum rich matrix at 600 K and 730 K, estimated with Thermo-Calc and the databases TCAL5 [106] and MOBAL1 [107]. ... 81 Figure 40. Size evolution of a spherical -Al2Cu growing in a finite Al-1.0 at%Cu matrix with four different values of the interfacial mobility. The number density of the precipitates is assumed to be 1.0 × 10¹⁸ m-3. ... 82 Figure 41. Evolution of c and c* for a spherical -Al2Cu precipitate growing in a finite Al-1.0 at%Cu matrix with different values for the interfacial mobility. ... 82 Figure 42. Time evolution of the radius of a spherical -Al2Cu θ inside a finite Al-1.0 at%Cu matrix at 600 K with three different values for the number density. ... 83 Figure 43. Solute concentration profiles in front of the spherical -Al2Cu as calculated by DICTRA at different times for systems having different values for the number density. ... 84 Figure 44. Time evolution of the radius of a spherical -Al2Cu precipitate dissolving in a finite Al-1.0 at%Cu matrix at 730 K with three different values for the interfacial mobility. The number density of the precipitates is assumed to be 1.0 × 10 18 m-3. ... 85 Figure 45. Time evolution of c and c* for a spherical -Al2Cu precipitate dissolving in a finite matrix with three different values for the interfacial mobility. The number density of the precipitates is assumed to be 1.0 × 10 18 m-3. ... 85 Figure 46. Schematic of the growth and dissolution model for the multiphase system. ... 99 Figure 47. Evolution of the interfacial mobility of precipitates versus temperature evaluated in the Al-3.5wt%Cu alloy. ... 102 Figure 48. Comparison between the apparent heat capacity calculated by the model and measured experimentally during the decomposition of the supersaturated Al-3.5wt%Cu alloy occurring with a heating rate of 6 K/min. The experimental curve was retrieved from the work of Heugue et al. [9]. ... 103 Figure 49. Calculated evolution of the size (a1) and volume fraction of the precipitates versus temperature during the decomposition of the supersaturated Al-3.5wt%Cu alloy occurring with a heating rate of 6K/min... 104 Figure 50. Evolution with temperature of the ′′, ′, and solvus as determined by MatCalc, and of the Cu solute molar fraction of the matrix ( c ) as calculated by the model for the decomposition of the supersaturated Al-3.5wt%Cu alloy occurring with a heating rate of 6K/min. ... 105
xii
Figure 51. Influence of heating rate on the apparent heat capacity during the decomposition of the
supersaturated Al-3.5wt%Cu alloy. ... 107
Figure 52. Evolution of the calculated and measured diameter of disk-shaped ′ precipitates in an Al-4wt%Cu alloy submitted to a reversion treatment (3 minutes at 225 °C) after the homogenization and quench treatments. The number density of precipitates was the same for all temperatures. Experimental data were taken from reference [110]. ... 108
Figure 53. Evolution of the calculated and measured diameter of disk-shaped ′ precipitates in an Al-4wt%Cu alloy submitted to a reversion treatment (3 minutes at 225 °C) after the homogenization and quench treatments. The experimental data were taken from reference [110]. ... 109
Figure 54. Influence of ac value on the calculated apparent heat capacity during the decomposition of the supersaturated Al-3.5wt%Cu alloy occurring with a heating rate of 6 K/min. ... 111
Figure 55. User interface of MatCalc package, version 5.62. ... 120
Figure 56. MatCalc user interface window for choosing databases. ... 121
Figure 57. Matcalc user interface, choosing elements and phases. ... 122
Figure 58. MatCalc user interface, setting for the nominal composition ... 122
Figure 59. MatCalc user interface, Equilibrium calculation window ... 123
Figure 60. MatCalc user interface, Phase details window ... 123
Figure 61. MatCalc user interface, Variables window ... 124
Figure 62. MatCalc user interface, Output of the sample script ... 126
Figure 63. Boost library installation. It should be noted that the user should change the directory ‘C:\Boost’ to the address that the file has been unzipped in local drive. ... 129
Figure 64. Windows command prompt, confirmation of building Boost C++ libraries. ... 129
Figure 65. Property pages of the project within Microsoft Visual Studio 2017. ... 130
Figure 66. Making a connection between the C++ program and the Boost libraries; Adding the root directory of the Boost package. ... 131
Figure 67. Making a connection between the C++ program and the Boost libraries; Adding the directory of all libraries of the Boost package. ... 131
xiii
List of Tables
Table 1. The solid solubility of elements in Aluminum [52] ... 16 Table 2. Chemical composition of the alloy used for the mixed-mode growth modelling ... 62 Table 3. Equilibrium values calculated at 453 K and 101 kPa with the nominal composition given in Table 2. The Al matrix and the precipitate ’’ were considered as the only active phases. ... 63 Table 4: Equilibrium values calculated at 453 K and 101 kPa with the nominal composition given in Table 2. The Al matrix and the precipitate-Mg2Si were considered as the only active phases. ... 66 Table 5. Parameters defining the growth of -Al2Cu precipitates in the Al–Cu system. ... 81 Table 6. Thermodynamic variables used in the models. ... 81 Table 7. Parameters describing the dissolution of -Al2Cu precipitates in the Al–Cu system. All other parameters are the same as in Table 5 and Table 6. ... 84 Table 8. Parameters used for the simulation of aging for the Al-3.5wt%Cu alloy ... 101 Table 9. Optimized values for and E in the expression calculating the interfacial mobility. ... 102
xiv
Dedication
xv
Acknowledgment
I would like to deeply express my gratefulness to my supervisor Prof. Daniel Larouche for his continuous support, encouragement, dedication to student development and commitment to excellence. His expertise, perspective, and insightful commentary were invaluable. During my PhD I had many inspiring and productive discussions with Prof. Larouche which provided me an opportunity to learn a great deal about analytical techniques and computational engineering. He provided me a unique scientific atmosphere to boost my knowledge, sharpen my research skills, and enhance my multidisciplinary scientific approach. I appreciate the freedom he gave me to follow my passion in the field of computational engineering. I am also grateful for his generous financial support during my PhD program.
I am also thankful to our industrial collaborators, Rémi Martinez, Francis Breton, Denis Massinon, for their helpful comments, suggestions, and encouragement during my Ph.D. I am also thankful to the jury members Prof. Carl Blais, Dominique Dubé, and Jean-Philippe Harvey for their constructive feedback and advices. In addition, the financial support of Natural Sciences and Engineering Research Council of Canada (NSERC), and the industrial corporations Montupet (France, Laigneville) and Rio Tinto Arvida (Canada, Quebec) are greatly appreciated.
I would also like to thank my friend and colleague, Pierre Heugue, for the valuable discussion and collaboration that we had during this thesis. Moreover, I thank all my friends at our department’s graduate office for their encouragement and support.
I would like to thank my parents for their encouragements and supports. Specially, I thank my dear mom for her unlimited love and believing in me. Finally, I would like to thank my dear wife, Mahboubeh. I greatly appreciate her encouragement, patience, substantial support and love, and standing by me through the course of my university educations. I am deeply fortunate to have her in my life. With her at my side, I will always be inspired to ascend ever greater heights of achievements.
xvi
Preface
This doctoral thesis is presented to the Department of Mining, Materials and Metallurgical Engineering of Laval University. This research was funded by the Natural Sciences and Engineering Research Council of Canada (NSERC), grant number RDCPJ 468550–54814, and also by the industrial companies Montupet (France, Laigneville) and Rio Tinto Arvida (Canada, Quebec). This doctoral project was carried out under the supervision of Professor Daniel Larouche from fall 2016 till fall 2019.
In this thesis, a computational approach is developed in order to model the kinetics of the precipitation in Al alloys. After an introduction of the project and states the problems, in chapter 1, it is tried to cover the theoretical aspects of the kinetics of the precipitation in Al alloys. It includes related mathematics, computational aspects, and ongoing challenges. It also introduces a lately published model which is considered as the theoretical basis of this project. Chapter 2 presents the general methodology and objectives of this project. The following three chapters, chapters 3 to 5, present the major achievements of the current study which lead to 3 scientific papers. Finally, the conclusion and perspectives for future works are presented.
Chapter 3: Mixed-mode Growth of a Multicomponent Precipitate in the Quasi-steady State Regime
Authors: Tohid Naseri, Daniel Larouche, Rémi Martinez, and Francis Breton Journal: Materials Theory (open-access), Vol. 2 (1), 1-14 (2018).
Author contributions: T. Naseri and D. Larouche developed the methodology and numerical model.
T. Naseri provided the computational model and performed the computer calculation. T. Naseri and D. Larouche have done the data analysis and prepared the original draft. The final version is provided by D. Larouche. All co-authors contributed to the scientific revision of the results and commented/corrected the article.
Chapter 4: Analytical Modeling of the Mixed-Mode Growth and Dissolution of Precipitates in a Finite System
Authors: Tohid Naseri, Daniel Larouche, Rémi Martinez, Francis Breton, and Denis Massinon. Journal: Metals (open-access), Vol. 9, 889 (2019).
Author contributions: T. Naseri and D. Larouche developed the methodology and numerical model.
T. Naseri provided the computational model and performed the computer calculation. T. Naseri and D. Larouche have done the data analysis and prepared the original draft. The final version is
xvii
provided by D. Larouche. All co-authors contributed to the scientific revision of the results and commented/corrected the article.
Chapter 5: Multiphase Modelling of the Kinetics of Precipitation in Al-Cu Alloys During Artificial
Aging
Authors: Tohid Naseri, Daniel Larouche, Pierre Heugue, Rémi Martinez, Francis Breton, Denis Massinon.
Journal: This article will be submitted to a peer-review journal.
Author contributions: T. Naseri and D. Larouche developed the methodology and numerical model.
T. Naseri provided the computational model and performed the computer calculation. T. Naseri and D. Larouche, and P. Heugue have done the data analysis. T. Naseri and D. Larouche prepared the original draft. The final version is provided by D. Larouche. All co-authors contributed to the scientific revision of the results and commented/corrected the article.
1
Introduction
Aluminum is one of the most used non-ferrous metal in the world with an enormous range of applications from simple kitchenware to advanced spacecraft. Indeed, there are a lot of technical advantages of using aluminum helped by its intrinsic properties like low density, high resistance to corrosion, high thermal-electrical conductivity, and many other desired properties. But there are some extrinsic reasons which boost the usage of aluminum alloys in some industries like the automotive industry. For example, governmental regulations regarding reduction in fuel emissions, along with the growing desire of society for fuel-efficient cars, push car making companies to reduce the weight of their products. As a result, they started to massively downsize their engines in past years, and produce engine components with light metals, especially aluminum-based alloys. The process of downsizing involves higher working temperature and pressure in order to gain the desired performance. The new working situations can easily degrade mechanical properties of aluminum foundry alloys as they are prone to softening, so it is vital for the car industry to overcome this weakness.
One of the important strengthening techniques improving the mechanical properties of alloys used in the automotive industry (which are mainly based on Al-Si with Cu, Mg additions [1]) is the precipitation of the second-phase particles inside the aluminum matrix. The large intermetallic and eutectic phases (e.g. θ-Al2Cu) which are formed during casting are not able to provide favorable mechanical properties. For that matter, the solutionizing heat treatment should first be applied to achieve the maximum strengthening role of solutes.
During solution heat treatment, the alloy is heated to a temperature slightly higher than the solvus temperature, and it is kept at that temperature for a specific time which allows solute atoms to be dissolved in the matrix by diffusion. The goal of this step is gaining the homogenization of solute atoms inside the aluminum matrix. The following step is quenching, rapid cooling of the solutionized matrix, to provide a supersaturated solid solution. The final step is aging where strengthening phases gradually formed by means of precipitation. The level of supersaturation decreases with aging time and the matrix is getting closer to its equilibrium state. The final goal is finding optimum aging parameters, time and temperature, which can provide uniform distribution of metastable precipitates inside the aluminum matrix.
As the final distribution of precipitates plays a crucial role in the mechanical properties of the alloys, a better understanding of the microstructural evolution and kinetics of precipitation can help noticeably the design of the heat treatment process of aluminum alloys. In industry, engineers do
2
many experiments to find out the best heat treatment process for each new alloy. According to the size and morphology of the metastable precipitates, transmission electron microscopy (TEM) analysis help considerably the study of precipitates. However, depending too much on TEM analysis is costly and time-consuming. Conversely, mathematical modeling of precipitation can overcome some difficulties of experiments, provided that they are able to model complex alloys, closer to those used in the industry. Unfortunately, some of the assumptions which are usually considered in mathematical modeling of precipitates, impose some limitations when studying complex alloys.
In the present work, we are looking for a mathematical model to study the microstructural evolution of multicomponent precipitates inside aluminum alloys. Instead of following the diffusion-controlled growth approach used in commercial software like DICTRA [2] and MatCalc [3], we will apply a mixed-mode growth approach by considering the interfacial mobility as a variable in the evolution equations. The final goals of this research are achieving a better understanding of precipitation kinetics, particularly during the initial stage of precipitates’ growth as well as providing a mathematical model to contribute to the design of experiments in the heat treatment process.
3
Chapters 1: Literature Review
1.1 Background
Aluminum alloys usually used in the fabrication of engine cylinder head contain silicon, magnesium, and copper as their main alloying elements. The most commonly used alloys are based on the 319-type and the 356-type families [4, 5]. There are many research interests in finding the optimum chemical composition of these alloys and the required heat treatment process to improve their mechanical properties [6-8]. For the car industry, the general goal is improving the fatigue life of the head cylinder to ensure the desired performance of the engine at high working temperature and pressure. The key factor of this goal is achieving desirable precipitates inside the Al matrix during aging since precipitation hardening is the main strengthening technique for these alloys. The conventional approach to treat the precipitation hardening is considering particles as obstacles against the motion of dislocations. Relatively, the desired schema would be a uniform distribution of fine precipitates inside the matrix instead of heterogeneous distribution of precipitates on grain boundaries for instance.
To study the precipitation within alloys, the initial step is performing solutionizing heat treatment (SHT). This is required since the second phases formed during the solidification are usually not the best candidate for improving the mechanical properties. During SHT, the system is kept at solutionizing temperature long enough to obtain a more homogenous matrix and enforces the particles of the second phase to be dissolved. Figure 1 shows the microstructure of the Al-3.5 wt% Cu (a) as-cast and (b) as-quenched after the two-step SHT, 8 hours at 500 °C followed by another 8 h at 550 °C [9]. It is clear that many intermetallic particles (Al2Cu) were already formed during the solidification, Figure 1 (a). However, solutionizing treatment makes the intermetallic particles to be dissolved. Consequently, the as-quenched sample gets a more homogenous matrix, Figure 1 (b) [9].
4
According to the different alloying elements which are used in the alloys, different types of precipitates can form during the aging. By considering Al-Si-Mg-Cu quaternary alloy as the material used for cylinder head fabrication, the following types of precipitates can form during aging:
➢ θ family precipitates: (Al-Cu) ➢ β family precipitates: (Mg-Si) ➢ Q family precipitates: (Al-Mg-Si-Cu)
The mathematical models developed in the present study will be dedicated to the Al alloys containing Cu, Mg, Si as the alloying elements. For that matter, a brief introduction of the most probable precipitates in these systems will be given in the following paragraphs.
1.2 θ family precipitates
Thermodynamically, the most stable precipitate in this group is with the chemical composition of Al2Cu. Since there is only one solute, Cu, these precipitates are known as binary precipitates. The sequence of precipitation in this group is known as [10]:
Supersaturated solid solution → Guinier–Preston (GP) zone → → → (Al2Cu)
The sequence starts with GP zones, which thermodynamically are the least stable but kinetically the most favored phases [11, 12]. Except for (Al2Cu) which is the stable precipitate, other types of precipitates in this group are known as metastable particles. In the above sequence, the level of coherency between the precipitate and the surrounding matrix is decreased by going from left to right. GP zones and are fully coherent with the Al matrix, particles are mainly semi-coherent, while precipitate is completely incoherent [13, 14].
Figure 2 (a) shows the Al-Cu phase diagram with the metastable phases [13]. According to this diagram, GP has a minimum temperature range of thermal stability while has the maximum range. At each temperature, the maximum equilibrium concentration of Cu in the matrix is achieved when the matrix is in equilibrium with the GP zone. Afterward, the equilibrium concentration in the matrix is decreased, and when it is in equilibrium with , it has the minimum equilibrium concentration. Figure 2 (b, c) show transmission electron microscope images of Al-1.7 at.% Cu alloy after aging for 8 hours at two different temperatures. Aging at 438 K leads to the formation of plate-like GP (or) precipitates, while by aging at 463 K, only particles are observed [15].
5
Figure 2. (a) Al-Cu phase diagram with metastable phases [13] (b, c) Transmission electron microscope micrograph of Al-1.7 at.% Cu where (b) GP platelets observed in the <1 0 0 >Al zone after aging at 438 K for
8 h, (c) precipitates observed after aging at 463 K for 8 h [15].
1.3 β family precipitates
Thermodynamically, the most stable secondary phase in this group is the compound β - Mg2Si. The shape of this phase is plate-like, and it has a cubic crystal structure [16]. As there are two solutes in these precipitates, Mg and Si, they are known as multicomponent precipitates inside the Al base matrix. By considering Al-Si-Mg alloy, the sequence of precipitation in this group is known as [16, 17]:
Supersaturated solid solution → GP zone → β → β → β(Mg2Si)
GP zones are the first phase that forms during aging and grows coherently within the Al matrix [18]. Following the GP zones, the next dominant precipitate during aging is the needle-like β precipitate. It is fully coherent with the Al matrix in its needle direction while in the perpendicular direction to the needle it is semi-coherent. This precipitate has the stoichiometric Mg5Si6 chemical composition. It is known that this phase has a monoclinic crystal structure, but different researchers reported different crystal parameters for β precipitate [19-21]. This metastable precipitate plays the main strengthening role for the Al-Si-Mg alloys [19, 22]. Zheng et al. [23] studied the microstructure of three complexes Al alloys with 1.90 wt.% Mg and various content of Si, from 1.21 to 2.52 wt.% during aging at 443 K. Their results of hardness test, Figure 3 (a), shows peak-aged for all three alloys. Bright-field TEM study of the peak-aging sample, Figure 3 (b), shows the distribution of fine needle-like precipitates inside the Al matrix. Finally, Figure 3 (c) presents a high-resolution TEM (HRTEM) image of a β type precipitate which is dominant in the peak-aged alloy. at% of Cu wt% of Cu Te m p er a tu re (C) (a) (b) (c)
6
Figure 3. (a) Vickers hardness evolution of the three Al-Si-Mg alloys (various content of Si) with aging time at 443 K,(b) TEM micrographs at peak-aging condition, (c) HRTEM image of a representative β precipitate
from a peak-aged sample [23].
The final metastable precipitate in this group is β phase, which has less coherency than β. The shape of this phase is reported as rod-like with a hexagonal crystal structure [16, 24]. According to TEM analysis, β particles can grow larger in size compare to β [25].
1.4 Q family precipitates
There are two types of precipitates in this group, Q and Q which are quaternary multicomponent precipitates having three solute elements Mg, Si, and Cu. The Q phase has 21 atoms in the hexagonal unit cell which is present as the equilibrium phase in many alloys based in the Al-Mg-Si-Cu system [26]. The exact composition of the phase is unknown but it has been reported as Al5Cu2Mg8Si6 [27], Al4CuMg5Si4 [28], Al4Cu2Mg8Si7 [29], and Al3Cu2Mg9Si7 [30].
The metastable precipitate in this group is Q which has the same crystal structure and lattice parameters as the equilibrium Q. However, Q is coherent with the Al matrix along its long axis which is parallel to <100>Al and generally they are smaller than stable Q particles. During the aging of Al-Mg-Si-Cu base alloy, Q particles can simultaneously be present with β or β precipitates inside the matrix, but as Q phase has a lath morphology, so it can be distinguished [26]. In addition, two other combinations of precipitates have been observed in peak-aged condition of the Al-Si-Mg-Cu alloy system: (1) β and/or (2) metastable phases of Q family and/or , where the phase only appears for a high concentration of Cu (>1 wt. %) [31-33].
The aforementioned precipitates are the main phases that are formed during the aging of Al-Mg-Si-Cu base alloys. However, it should be noted that there are some other metastable phases observed in these alloys; They are not covered in this short introduction, but interested readers are invited to
7
read the original experimental studies [26, 34, 35]. To continue, different aspects of the precipitation will be covered in the following sections.
1.5 Importance of precipitates
The kinetic pathway of precipitation can have a noticeable influence on mechanical properties. For example, Figure 4 shows the evolution of yield stress versus the aging time of the AA6111 alloy within the temperature range of 140-220 °C [36]. It is clear that peak strength of 340 MPa is obtained at different aging temperatures. The required time to obtain peak strength depends on the aging temperature. The lower the temperature, the longer the required time. So, it is clear that in-depth knowledge of the kinetic pathway of the precipitation can help us to design the heat treatment process to obtain the required physical and mechanical properties. An example from the industrial application is the aluminum-based head cylinder used in the car industry. One of the general goals for these industries is improving the fatigue life of the head cylinders to ensure the desired performance of the engines at high working temperature and pressure. It is known that fatigue behavior is related to the crack plasticity ahead of the crack tip. Indeed, if dislocations can move easily, the crack can propagate more rapidly. In this regard, the precipitates can impose some limitations against the motion of dislocations. As a result, one can expect to improve the fatigue resistance with an efficient precipitation hardening. According to Figure 4, it is clear that by optimizing the aging parameters (time and temperature), it is possible to improve the yield stress.
8
1.6 Homogeneous nucleation
Precipitation process starts by the nucleation of a new phase. Homogeneous nucleation happens when the nucleus is formed inside the matrix without any preferential nucleation sites such as impurities, grain boundaries or dislocations. The corresponding driving force can be described as [13]:
hom ( v s)
G V G G A
= − − + (1.1)
Where:
V: volume of the particle,
∆Gv: free energy variation due to change in volume,
∆Gs: misfit strain energy per unit volume,
A: area which is made by the formation of the new phase,
: interfacial free energy per unit area
Figure 5 shows a schematic of the free energy variation versus the particle size. Due to the positive value of the surface energy, it acts against the formation of the new phase. The bulk free energy is in favor of the growth since the matrix is supersaturated and there is a chemical driving force for having a second phase. For the tiny clusters, the value of these two competitors is comparable. However, for bigger particles, the bulk free energy would be dominant and then, the particles can get stabilized. G* shows the activation energy of the nucleation and the corresponding size r (or crit
*
r ) shows the critical size of a spherical particle.
Figure 5. Schematic of free energy variation vs particle size of a new phase
* G
9
The critical radius and the activation energy are defined by the following relationships [13]:
* 2 v s r G G = − (1.2) 3 * hom 2 16 3( v s) G G G = − (1.3)
1.7 Heterogeneous nucleation
Practically, homogenous nucleation is not dominant, due to the available defects and preferable nucleation sites within the matrix such as grain boundaries, dislocations, impurities, excess vacancies and so on. This type of nucleation is known as the heterogeneous nucleation and is the most probable form of nucleation and the corresponding driving force is defined as [13]:
(
)
het v s d
G V G G A G
= − − + − (1.4)
Compare to the Eq. (1.1), the heterogenous driving force has a new term Gd which is the free energy released due to the destruction of a “defect”. In a similar way, the heterogeneous activation energy can be obtained by using the derivative of the Eq. (1.4). However, in this case, a shape factor is needed to be considered since the geometry is not a perfect sphere due to the interaction between the particle and the defect. Thus, the heterogeneous activation energy can be defined as [13]:
3 * 2 16 ( ) 3( ) het v s f G G G = − (1.5)
Where f( ) represents the shape factor, which is always less than the unity. The corresponding reduction of the nucleation barrier can facilitate heterogeneous nucleation. As a result, it is the most common form of nucleation in most circumstances.
1.8 Classical Nucleation Theory
Classical nucleation theory (CNT) is the most common theoretical model for studying the kinetics of nucleation. To apply the CNT, usually, the nucleation rate is defined. However, the laboratory experiments for direct investigation of the nucleation has some technical challenges such as coherency, tiny size and so on [37]. It is also be noted that there are some uncertainties in the related calculation. For example, it has been reported that the nucleation rate has at least an uncertainty of three to five orders of magnitude [38]. Another reference [39] reported the uncertainty of at least 10 orders of magnitude for the nucleation rate.
10
As an alternative for the experiments, computer simulation can overcome some experimental challenges such as considering homogenous nucleation within a defect-free matrix. However, there are some challenges to overcome like time-length, size-length, and required accurate metallic interatomic potential.
1.8.1
Homogenous nucleation rate
The homogenous nucleation rate is defined as [13]:
* 0exp B G I fN k T = − (1.6) Where: 0
N : number of atoms per unit volume,
f : condensation rate of critical particle.
In CNT, f depends on the surface of the nucleus and diffusion rate. Therefore, the above relationship can be rewritten as [13]:
* 0exp exp m B B G G I N k T k T = − − (1.7) Where: m G
: Activation energy for atomic migration,
: Vibration frequency of the atom1.8.2
Heterogenous nucleation rate
In a similar way, it is possible to define the heterogeneous nucleation rate as [13]: * 1exp exp m het het B B G G I N k T k T = − − (1.8) Where: 1
N : heterogeneous nucleation site- depends on the defect type
Comparison the Eqs. (1.7) and (1.8) shows that the difference between the homogenous and heterogenous nucleation rate are based on two parameters, N and *
G
. On one hand, less value of the G*het, facilitates the heterogenous nucleation. On the other hand, the nucleation site for the
11
homogenous nucleation is much more than the heterogenous case. In reality, both scenarios can occur depending on the ongoing circumstances.
1.8.3
Applying of CNT and challenges
One of the required parameters to apply the CNT is the nucleation rate. As an example, to analyze the precipitation through the differential scanning calorimetry (DSC) the common belief is that we expect transformation peaks when there is a boosting in the nucleation rate. The consequence of considering Gmas the activation energy for the atomic migration from one position to the other position is the fact that migration mainly depends on the element. Consequently, one of the theoretically challenges is applying the CNT to justify the sequence of the precipitation. According to the CNT, since the Gmis considered independent of the different phases and the corresponding interface, the only option to justify the sequence of the precipitation is based on the G*. As a result, according to the Eq. (1.3) and (1.7), surface energy and strain energy are the two important parameters that can influence the nucleation rate, and therefore the sequence of the precipitation. However, the values of these parameters in the literature do not permit to justify this sequence.
1.9 Sequence of precipitation
To discuss the sequence of the precipitation, readers’ attention is invited to the phase, which is one of the precipitates in Al alloys, especially in Al-Cu systems. One can find the following sequence for the precipitation in Al-Cu alloys in the literature [13, 40]:
( )
Supersaturated Solid Solution SSS →GP→
→ →
(1.9)Where the GP zone is the fully coherent particles and the phase is fully incoherent. Indeed, by moving from left to right, the precipitates lose their coherency and get more stability thermodynamically. In the following sections, a brief discussion about the roles of the interfacial energy and the elastic strain energy as well as the role of precursors in the sequence of the precipitation are provided.
1.9.1
Role of interfacial energy
One of the explanations for justifying the sequence of precipitates is based on interfacial energy. That is the excess free energy associated with the formation of the interface, due to breaking network bonds along with forming new bonds. However, this explanation is not certain enough. In fact, calculating the surface energy of the different phases of precipitates with reasonable accuracy is relatively difficult and the related uncertainty can have a noticeable influence on the results [37, 41]. To continue, some data from the literature for the and precipitates are
12
mentioned. Kokotin et al. [42] reported the average value for the interfacial energy of the phase as 0.456 J.m-2 with a minimum value of 0.24 J.m-2. While the interfacial energy for the is reported as 0.156 - 0.190J.m-2 for the coherent faces and 0.520 - 0.694 J.m-2 for the semi-coherent phases [43, 44]. In addition, Kozeschnik reported the value for the interfacial energy of the and phases as 0.091 and 0.088 J.m-2, respectively [45]. According to Larouche [46], one can conclude that the interfacial energy cannot play the deterministic role in the sequence of the precipitates since the reported values for the interfacial energy of the and phases are quite comparable [46]. 1.9.2
Role of elastic strain energy
The other possible parameter which can address the sequence of the precipitates is the difference in the elastic strain energy of the particles [46]. Precipitates with different types of interface in terms of coherency can introduce different types of strain energy. Precipitates with coherent interface will introduce strain energy due to lattice misfit (Gsc), while incoherent precipitates will introduce strain energy due to volume misfit (Gsi) [46]. An approximation of the Gsccan be defined by the following relationship [13]: 2 4 sc G V (1.10) Where: : shear modulus, : lattice misfit
Larouche reported the value of Gscfor a matrix around the semi-coherent precipitate like particles as -10.5% [46]. On the other hand, for incoherent particles, the Gsican be defined as [47]: 2 2 . 3 si c G V f a = (1.11) Where: : volume misfit, c f a : shape factor
And the value of Gsifor phase is reported as -9.3% [46]. Since the volume strain energy of the phase is less than the lattice misfit of the phase, not only it cannot justify the sequence for the
13
andprecipitates, but also it is in favor of the kinetic pathway for the particles to form sooner.
1.9.3
Role of the chemical driving force
To consider the role of the chemical driving force, one should take into account the fact that the particles are the most stable phases among the precipitates within the Al-Cu alloys. In other words, during the aging of a given supersaturated matrix, particles have more chemical driving force than particles to precipitate. The schematic of this behavior can be seen in Figure 6 which shows the Al-Cu phase diagram with metastable phases. According to this figure, the chemical driving force cannot justify the differences between kinetic pathways of the and particles.
Figure 6. Al-Cu Phase diagram including metastable phases [13].
1.9.4
Role of precursors
One of the accepted explanation for the precipitation sequence in Eq. (1.9), is the fact that by going from left to right, each former precipitate will act as the precursor of the latter precipitate. Whereas, there are some contradictions in the literature against that. For example, Murayama et al. [48] reported that grain-size has a determining role in the sequence of the precipitation in Al-1.7 at% Cu alloy. The authors compared two systems with different microstructure in terms of grain size. For that matter, plastic deformation through the equal-channel angular pressing (ECAP) was applied to prepare different grain sizes. The properties of the two systems are as follow [48]:
- Alloy I: coarser grain size 500 nm - Alloy II: finer grain size < 400 nm
14
Applying artificial aging at 100 °C for 24 hours on the alloy (I) led to the known sequence of precipitation, Eq. (1.9). In contrast, applying the same aging treatment on the alloy with finer microstructure (alloy II) led to the formation of the phase directly without any precursors. The authors concluded that there is a critical grain size that the phase can precipitate from the beginning. Murayama et al. explained that by modifying the grain size, the kinetic pathway of the precipitate can be changed [48]. In fact, finer grain size provides a more preferred site for the nucleation sites of phase. Thus, the Cu atoms will diffuse from the grains into the grain boundaries, and the intensity of the supersaturation within the grains will be reduced. Consequently, the required chemical driving force for the metastable phases would be lost [48]. This report provided clear evidence that the conventional sequence of the precipitates is not an intrinsic behavior of the system, and this sequence can be changed depending on the kinetic factors.
Moreover, Heugue et al. reported that small particles of the phase have been observed along with the metastable phases from the initial stage of the aging of Al-3.5wt% Cu alloy [9]. While according to the conventional sequence, phase should appear only at the late stage of the aging process. There are also other challenges like the preferred position for different types of precipitates. According to the conventional sequence, one can expect that precipitates which follow each other in the sequence(like → ) will form in the same region. Contrary to this expectation, metastable phases are usually growing inside the grains, while phase tends to precipitate on the grain boundaries [48, 49]. Another challenge would be related to the number density of these two phases. The direct transformation ( → ) implies the fact that the number density of the two phases would be comparable. While the experimental studies showed that the number density of phase is noticeably less than phase [9]. That means that a notable amount of particles should be dissolved into the matrix, instead of direct transformation to the phase.
From the literature, one can find other examples regarding not following the conventional sequence of precipitation. For example, the formation of S phase within Al-Cu-Mg alloy. It is known that the sequence of the formation of the second phase in supersaturated Al-Cu-Mg is the following [50]: SSS → Cu-Mg clusters/GP zones→ GP2 /S phase → S/S phase
By the way, Khan et al. [50] noted that there is no clear evidence that S phase forms via transformation from the precursors; In other words, it seems that S phase nucleates independently in the Al matrix.
It has been mentioned already that none of the factors like interfacial energy, strain energy, and chemical driving force can explain the sequence of the precipitation. In addition, the above
15
paragraphs provided some examples that the stable phases can form directly in the matrix phase without any need of precursors. Thus, the challenge is still there regarding the precipitation’s sequence and the corresponding kinetic pathways. On top of that, there is some research showing that we cannot rely on the common belief about the kinetic pathway. For example, Sanz et al. [51] showed that the critical nuclei in a binary suspension of an oppositely charged colloid are not the ones with the lowest activation energy of the nucleation, but the one with the highest growth rate. This result clearly contradicted the common understanding that the phase with the lowest activation energy of the nucleation crystallizes most readily. In fact, according to Eq. (1.12) nucleation of the crystal structure with the higher nucleation barrier can be possible provided that a large kinetic prefactor ( ) compensates the effect of the higher G*.
* exp( ) B R G k T = − (1.12)
1.10 Intermediate phases
Figure 7. shows the free energy curve for an intermediate phase with two different chemical stability range [13]. It should be noted that a different range of chemical stability can be addressed by the interatomic bonding type. Figure 7 (a) shows that a small composition deviation can impose a critical change in the Gibbs free energy. Under this circumstance, the ideal composition is strongly preferable. Such a phase is known as an intermetallic compound and it is normally stoichiometric. The precipitates like and are categorized as intermetallic compounds with a specific chemical composition (Al2Cu) and represent a good example of this type of phase. On the other hand, Figure 7. (b) shows the free energy curve for the phases which can accept a wider variation in chemical composition without a critical change in the Gibbs free energy. For example, the Aluminum matrix is an example of a phase with a wide stability composition range. In this regard, Table 1 presents the solid solubility of some elements in Aluminum at different temperatures [52]. When the concentration of the alloying elements is less than the solubility limit, the system can have only one phase (matrix phase). As soon as the solute concentration exceeds the solubility limit, one can expect the formation of the second phase because it will decrease the Gibbs free energy of the system.
16
Figure 7. (a) Free energy curve for intermediate phase with a narrow stability range, (b) free energy curve for the intermediate phase with a wide stability range [13]
Table 1. The solid solubility of elements in Aluminum [52]
Element Temperature °C Maximum solid solubility (wt. %)
Cadmium 649 0.4 Copper 548 5.65 Chromium 424 0.77 Lithium 600 4.2 Magnesium 450 17.4
1.11 Intermetallic compounds
It has been mentioned that precipitates are categorized as intermetallic compounds. To continue, a brief explanation regarding the intermetallic compounds is provided. Considering the valence electrons, the atoms can share or transfer electrons to form a compound. Due to the high affinity between the contributing atoms within an intermetallic compound, ionic or covalent bonding occurs. Indeed, most of the valence compounds have a bonding intermediate between metallic and covalent [53]. Such strong bonding can maintain microstructural stability at high temperatures and even improve creep strength [53, 54]. Due to the nature of bonding, this class of materials can fill a gap between superalloys and ceramics. Compare to the ceramics they are less brittle due to the metallic bonding characteristic; And compare to the superalloys, they take advantage of higher strength because of the strong atomic bonding [53].
17
1.12 Diffusion in intermetallic compounds
Diffusion in intermetallic compounds is much slower than in disordered alloys [55, 56]. That is mainly because of the high energy barrier against the diffusion in the intermetallic compounds. In this regard, the random motion of vacancies is known as the main mechanism for diffusion in pure metals and alloys, while there are some obstacles against that in the intermetallic compounds. In this regard, it should be noted that the intermetallic phases are known as ordered phases with strong chemical bonding among their constituent elements [55]. The diffusion of vacancies can disturb the order provided by the intermetallic phases and thus it can cause a deviation from the thermodynamic equilibrium [55]. This means that the diffusion must happen in a way that the energy level of the system increases as little as possible. For example, one of the suggested mechanisms for the diffusion in such systems is the six-jump cycle [54]. It is a sequence of atomic motions which allows the diffusion through the nearest neighbor jumps and tries to minimize the increase of energy during the diffusion. This cycle is made of two sets of three jumps. The first set of motions will increase the energy of the system since atoms are placed in the wrong atomic sites. The following set of motions restore atoms to their correct sites. The schematic of this process and the required activation energy are presented in Figure 8 and Figure 9, respectively [54].
Figure 8. (a) schematic structure of an ordered binary alloy, (b) schematic of vacancy diffusion based on the six-jump cycle [54]
18
Figure 9. Schematic of activation energy for a vacancy diffusion with six-jump cycle [54]
In the following, some results from the literature about the diffusion in intermetallic compounds are mentioned. In agreement with the above discussion, it has been reported that diffusion in the intermetallic compounds is noticeably composition-dependent. For example, a minimum in the coefficient of diffusion around the stoichiometric composition in AlNi intermetallic compounds is shown in Figure 10 [56]. Correspondingly, Figure 11 shows that there is a bump in the activation energy of diffusion around the stoichiometric composition [56]. There is also some support from the atomistic modelling studies. For example, Figure 12 shows a similar result for the composition dependence of diffusion in AlNi intermetallic compounds where a minimum in the coefficient of diffusion was observed around the stoichiometric composition [55].
19
Figure 11. Composition dependence of the activation energy for the diffusion in AlNi intermetallic compound [56]
Figure 12. Composition dependence of Ni diffusion in AlNi at different temperatures based on the atomistic model calculation [55]; The U parameter is related to the strength of the atomic bond and it was defined based
on the required energy for the vacancies formation.
According to the above paragraphs, within a stoichiometric precipitate phase, the chemical bonding is strong and there is a high value of energy barrier for the diffusion. As a result, the direct transformation from one stoichiometric phase into another stoichiometric phase cannot be a dominant mechanism although it may happen. Indeed, the direct transformation can occur especially when the particles are very tiny. Because under this circumstance, only a few atomic movements would be required. However, it would be too difficult for relatively large particles because of the low solubility and diffusion.
20
1.13 Sub-critical growth
The formation of a new surface is known as the source of energy barrier against the growth of an embryo to get the critical size. Since for the tiny embryos the surface energy overcomes the volume energy, the net velocity of sub-critical growth tends to be negative. Thus, the growth of an embryo requires a source of energy to overcome this energy barrier. The accepted explanation is the fact that the required energy would be provided through the thermal fluctuations. To follow, it should be noted that the energy barrier of precipitation is inversely proportional to the undercooling. Hence, for the high value of undercooling, the energy barrier would be low and the corresponding critical size would be small. Under this circumstance, it is quite logical to consider sub-critical growth through thermal fluctuations. Nevertheless, according to the schematic of a phase diagram, Figure 13, it is clear that small values of undercooling (aging at high temperature) can provide less amount of the chemical driving force. As a result, the energy barrier would exceedingly increase which leads to a bigger critical size. D. Larouche [46] stated that depending on the undercooling and the critical size, probably thousands of atoms are needed to join the embryo to pass the energy barrier.
T
Concentration
Figure 13. Schematic of a binary phase diagram
To address the solid-state growth of embryo up to the critical size, D. Larouche recently published a new theory [46]. The interested reader is invited to the original reference where the theory was presented in detail. However, to follow our discussion, a brief introduction of the theory is provided. If one considers an isolated particle, increasing the size of the particle during the sub-critical stage has an effect that the increase of surface energy overcomes the decrease in the chemical-free energy. Then the growth velocity would be negative. However, the author stated that a collective behavior can happen. In fact, from the initial stage of nucleation, plenty of embryos can be present in the system. These embryos can be classified into two groups:
- Losers: The particles which will dissolve, - Winners: The particles which will grow.
The new theory of Larouche [46] is based on the fact that the dissolution of the loser particles can facilitate the growth of the winners. In other words, when there are plenty of embryos, it is possible
α
21
to have increasing of the volume fraction of the second phase without increasing the total surface area of all available particles in the system. So, one can expect that a decreasing of the surface area caused by the dissolution of the loser particles can neutralize the increasing of the surface area due to the growth of the winner particles. To follow, the readers' attention is invited to the concept of the energy barrier against the growth of an isolated embryo, Figure 14. The source of this barrier is the formation of the new surface area to provide the growth of an embryo. According to the theory of the loser and winner embryos [46], the system can bypass this barrier under the balance circumstances between loser and winner particles. The particular requirement of this idea is the presence of plenty of embryos in the system. That is quite rational due to the numerous preferable nucleation sites in the system such as vacancies and dislocations in a supersaturated solid solution. In this way, we will have plenty of nuclei, and we can consider the collective behavior of embryos so that coarsening (ripening) at the early stage of the transformation can be one of the active scenarios.
Figure 14. Schematic of the energy barrier against the growth of an isolated embryo.
To continue, the reader’s attention is invited to other research from the literature. Warczok et al. [57] studied the kinetics of the precipitation within Fe–3 at.%Cu system at 500 °C via Monte Carlo simulation. Due to the atomistic approach of the Monte Carlo simulation, it is possible to investigate the direct interaction between atoms. They noted that if Cu atoms are surrounded by at least 9 other Cu atoms within the simulation box, that group of atoms was considered as an atomic cluster. Figure 15 shows the evolution of the precipitate cluster sizes vs simulation time [57]. The authors concluded that Ostwald ripening took place for the early stage of precipitation. This finding is in good agreement with the new sub-critical growth theory of Larouche [46]; Indeed, similar to the late coarsening, it is possible to have early coarsening during the initial stages of the nucleation. In this regard, one of the main requirements of the coarsening is the absence of a concentration gradient in the system. In the case of the late coarsening, keeping the system long enough at the aging temperature allows the supersaturated solid solution to obtain its thermodynamic equilibrium. Indeed, particles of the second phase get stabilized and finally the concentration gradient will get
22
disappeared. In the case of early coarsening, although the system does not have its thermodynamics equilibrium exactly after the quench, the applied solutionizing heat treatment let the system to have a homogenous chemical composition. Consequently, the lack of concentration gradient right after the quench can lead to the early coarsening at the start of the aging.
Figure 15. Evolution of the precipitate cluster sizes vs simulation time using the Monte Carlo approach; a* is a
parameter describing the affinity of the vacancy to either solvent or solute atoms [57].
Furthermore, Soisson et al. studied the kinetics of nucleation via the Monte Carlo simulation [41, 58]. They assumed that secondary phases are formed through the vacancy jumps and the kinetics is totally controlled by the vacancy concentration and vacancy movement frequency. In agreement with the theory of Larouche [46], coarsening has been reported during the incubation region. As an example, Figure 16. shows the result of the Monte Carlo simulation which confirms a gradual growth of a very small embryo. It should be noted that decreasing in the number density of the embryos is also reported [41].
![Figure 2. (a) Al-Cu phase diagram with metastable phases [13] (b, c) Transmission electron microscope micrograph of Al-1.7 at.% Cu where (b) GP platelets observed in the <1 0 0 >Al zone after aging at 438 K for](https://thumb-eu.123doks.com/thumbv2/123doknet/2906177.75272/22.918.287.685.115.364/figure-metastable-transmission-electron-microscope-micrograph-platelets-observed.webp)
![Figure 4. Evolution of yield stress vs. aging time of AA6111 within the temperature range of 140-220 °C [36]](https://thumb-eu.123doks.com/thumbv2/123doknet/2906177.75272/24.918.210.712.653.956/figure-evolution-yield-stress-aging-time-temperature-range.webp)
![Figure 10. Composition dependence of the diffusion of Ni atoms in AlNi intermetallic compound [56]](https://thumb-eu.123doks.com/thumbv2/123doknet/2906177.75272/35.918.323.597.641.999/figure-composition-dependence-diffusion-atoms-alni-intermetallic-compound.webp)
![Figure 16. Time evolution of an embryo containing i atoms, result of the Monte Carlo simulation [41]](https://thumb-eu.123doks.com/thumbv2/123doknet/2906177.75272/39.918.305.616.776.996/figure-evolution-embryo-containing-result-monte-carlo-simulation.webp)
![Figure 18. Schematic diagram of showing ledges on Mg 2 Si plates in an Al-Mg-Si alloy [13]](https://thumb-eu.123doks.com/thumbv2/123doknet/2906177.75272/41.918.268.651.759.922/figure-schematic-diagram-showing-ledges-mg-plates-alloy.webp)
![Figure 31. Comparison between simulated and experimental study of Al-Mg-Si alloy under 5 °C/min constant heating rate,(a) DSC curve (b) Evolution of Number density (count/m 3 ) of second phases [92]](https://thumb-eu.123doks.com/thumbv2/123doknet/2906177.75272/68.918.137.779.115.381/figure-comparison-simulated-experimental-constant-evolution-number-density.webp)