HAL Id: hal-01572477
https://hal.archives-ouvertes.fr/hal-01572477 Submitted on 7 Aug 2017
HAL is a multi-disciplinary open access archive for the deposit and dissemination of sci-entific research documents, whether they are pub-lished or not. The documents may come from teaching and research institutions in France or abroad, or from public or private research centers.
L’archive ouverte pluridisciplinaire HAL, est destinée au dépôt et à la diffusion de documents scientifiques de niveau recherche, publiés ou non, émanant des établissements d’enseignement et de recherche français ou étrangers, des laboratoires publics ou privés.
Ageing and durability of concrete structures
Gilles Pijaudier-Cabot, Khalil Haidar, Ahmed Loukili, Mirvat OmarTo cite this version:
Gilles Pijaudier-Cabot, Khalil Haidar, Ahmed Loukili, Mirvat Omar. Ageing and durability of con-crete structures. Degradations and Instabilities in Geomaterials, 461, Springer, pp.255-286, 2004, International Centre for Mechanical Sciences, 9783211219362. �10.1007/978-3-7091-2768-1_9�. �hal-01572477�
Ageing and durability of concrete structures
Gilles Pijaudier-Cabot, Khalil Haidar, Ahmed Loukili, and Mirvat Omar
R&DO- GeM, Ecole Centrale de Nantes, France
Abstract: The serviceability of concrete structures is a coupled problem in which fracture and damage are coupled with several environmental attacks. In this chapter, we start with the investigation of chemo-mechanical damage due to calcium leaching. We show that the fracture characteristics, namely the internal length in continuum models evolve with ageing. This observation is confirmed with experiments on model materials. Acoustic emission data and size effect tests data are strongly correlated with the evolution of the microstructure of the material. This chapter concludes on some creep tests designed to investigate the coupled effect between creep and fracture.
9.1.
Introduction
The serviceability concrete structures used for instance in waste containment or electric production facilities is a coupled problem. These concrete structures are subjected to various mechanical loads, soil structure interactions, and at the same time to chemical aggressions. In order to determine the service life of such structures, prediction of the material response and structural failure with time are required. Typically, this kind of problem involves two sources of damage: one due to mechanical loads, and another one due to environmental actions. In the following, we are going to give examples of such coupled mechanisms. The first one deals with leaching of concrete. It is related to the safety of nuclear waste disposal systems. Then, we will discuss results obtained with model materials aimed at describing this type of chemical damage and we will be interested with the variation of the internal length in the course of the ageing process. Finally, recent experiments on creep - fracture interaction will be presented. These tests aim at evaluating the capacity of prestressed concrete structures and its variation during ageing.
9.2.
Leaching of cementitious materials
The long-term behaviour of concrete structures subjected to environmental damage is a topic of the utmost importance for waste containment disposals. In the case of long-life wastes (such as radioactive wastes), the models cannot rely on experimental data over the entire service life of the disposal, which spans over several hundred years. Assessing such structures and comparing several possible designs prior to their construction must rely on robust and accurate computational tools, in which the knowledge of the various degradation mechanisms at the
leaching due to water, and particularly calcium leaching as calcium is the most important element in the hydrated cement paste. The consequences of calcium leaching are an increase of porosity, a decrease of the elastic stiffness and a decrease of strength (Carde 1996, Gerard 1996, Carde and Francois 1997). It is this decrease of the mechanical properties that is addressed more specifically. The main reason is that for lifetime assessments, chemical degradation mechanisms must be superimposed to mechanical loads so that cracking may be predicted.
As leaching is a very slow process, accelerated experimental procedures are needed in order to calibrate models, and to validate them subsequently. Goncalves and Rodrigues ( 1991) and Schneider and Chen ( 1998, 1999) among others, have studied the influence of calcium leaching on the residual strength of beams for different cements subjected to different aggressive solutions. Carde ( 1996) used ammonium nitrate as an aggressive solution for accelerated leaching. Le Bellego et al. (2000) have carried out size effect tests on leached specimens for different degradation rates, and more recently Ulm and eo-workers (200 1) used a similar method in order to accelerate leaching.
Various models have been developed to describe calcium leaching, its effect on the mechanical properties of the leached material, and mechanical damage as well. Ulm and eo-workers ( 1999, 2001) used a chemo-plastic approach based on the mechanics of porous materials. Kuhl et al. (2000) devised a continuum damage model on the same basis. Gerard (1996) proposed a non-local damage model coupled with leaching effects. It is based on the definition of two damage variables: one is due to mechanical loads and the other one, which could be called a chemical ageing variable, accounts for chemical damage. These models could provide predictions of the residual strength and of the lifetime of concrete structures subjected to aggressive water but their range of validity in structural computations needs to be explored still. Such an assessment is the prime objective of this section, in which the experiments obtained by Le Bellego et al. (2000) will serve as reference data. The constitutive relations due to Gerard will be considered as an illustration. Among the models mentioned above, it is the only one that contains an internal length. Examined with the help of the size effect law, which contains a definition of brittleness as the transition of a strength of material criterion to a linear elastic fracture mechanics one in design (Bazant and Planas, 1998), the model fails to describe the increase of brittleness of the specimens during leaching. Such an increase may be represented by a decrease of the internal length and by an increase of the damage threshold essentially.
9.2.1 Constitutive relation
We are going to describe chemical damage very briefly only, and see how it can be coupled with a scalar mechanical damage model. Full details on the chemical damage model can be found in Gerard (1996).
9.2.1.1 Chemical damage
Concrete is a reactive porous material. Hydrates and water are the main components. Solid phases are in thermodynamic equilibrium with the surrounding pore solution chemistry and
calcium is the main chemical component of the binder. The hydrates leaching process is caused by the difference of composition and chemical activity between water in contact with concrete and the pore solution inside concrete. The difference between the pore solution and the external solution causes the motion of ions out of the cement paste. This overall motion of ions breaks the thermodynamic equilibrium established between the pore solution and the hydration products, and favours the dissolution of solid phases. The present simplified approach avoids considering all the elementary chemical mechanisms and focuses on the evolution of one variable only, the amount of calcium ions in the liquid phase of the hardened cement paste (Gerard et al. 1999). It is obtained by solving a non-linear diffusion equation:
X solid X = div[D(C)griid(C)]
cc a
(1)where
csolid
denotes the amount of calcium in the solid phase andc
denotes the amount of calcium ions in the liquid phase. A mathematical relationship for the calcium solid-liquid equilibrium can be found in Gerard (1996). It is a function of the cement chemistry and of the water to cement ratio. The diffusion coefficient D is not constant. It is related to the volumefraction of the different solid phases initially. During the leaching process, it varies between that of the virgin material and the diffusion coefficient of calcium ions in water (when the material is totally cracked).
9.2.1.2 Mechanical damage
Micro cracking due to mechanical loads is described with a scalar damage model due to Mazars (1984). It is briefly recalled in the following. The stress- strain relation is:
(2)
where a iJ and 8 iJ are the components of the stress and strain tensors, A iJkl are the initial stiffness moduli, and d is the damage variable. E and v are the initial Young's modulus and Poisson's ratio respectively. For the purpose of defining damage growth, the equivalent strain is introduced first:
(3)
where (.) + is the Macauley bracket and 8; are the principal strains. In order to avoid
ill-posedness due to strain softening, the mechanical model is enriched with an internal length (Pijaudier-Cabot and Bazant 1987). The non-local variable
&
is defined:£(x)
=
l flf/(X-s)&'(s)ds with Vr (x)= f lf/(X-
s)dsVr(x) n n
where Q is the VOlume Of the Structure, Vr (X) is the representative volume at point X, and lf(x- s) is the weight function:
(5)
(. is the internal length of the non local continuum. & is the variable that controls the growth of damage according to the following conditions:
F(&) == & - K
·
{d
== h(K) ·if F(&) == 0 and & > 0 then . ~ with the condition d ~ 0
{ d=O else K-==0 K==£ (6a) (6b)
K is the softening parameter and takes the largest value of
8
ever reached during the previousloading history at a given time and at the considered point in the medium. Initially K == K 0 , where K 0 is the threshold of damage. The damage evolution law h(K) in ( 6b ), is defined in an integrated form. In particular, the tensile damage growth is:
d == 1- K 0 (1- At) - At
t K exp(Bt(K-K0))
(7)
where constants At, Bt are model parameters which must be obtained from a fit of experimental data (e.g. bending beams).
9 .2.1.3 Chemo-mechanical coupling
The influence of chemical damage on the mechanical properties of the material may be introduced in the stress - strain relations following at least two methods. In the first one, which is inspired from the works of Ulm and Coussy ( 1996), the chemical degradation enters in the plastic yield function and, at the same time, changes the elastic stiffness of the solid skeleton of the material. Accordingly and within the context of continuum damage mechanics, the evolution of damage can be rewritten in a generic form as:
For the sake of simplicity a single phase material is considered only. The contribution to the growth of damage of each separate mechanism appears explicitly: damage growth due to mechanical loads is F(&) (e.g. as defined by Eqs. 6a,b) and damage growth due to leaching is defined by the function G(C). One has to check, however, that the damage variable ranges between 0 and 1, which means that the functions F(&) and G(C) cannot be independent.
A second method consists in adding a new chemical damage variable V on top of the
mechanical one. This chemically induced damage variable is an independent contribution to the weakening of the material. It is a new internal variable. This method as been chosen by Gerard (1996), Gerard et al. (1998), Saetta et al. (1999), Kuhl et al. (2000), Meftah et al. (2000), and Stabler and Baker (2000) for environmental (chemical and thermal) damage modelling. The corresponding stress - strain relation reads:
(9)
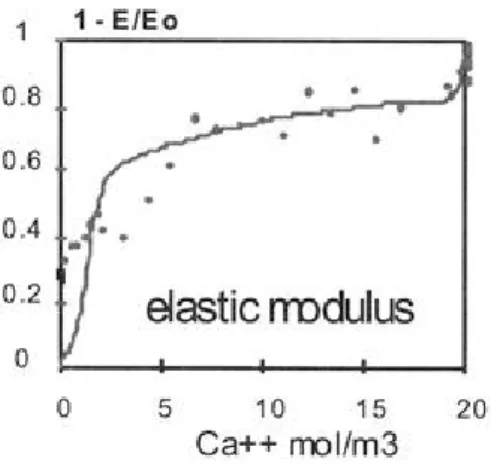
V is the chemical damage, a function of the concentration C of calcium ions in the pore solution: V = g( C) . g is an experimentally determined function shown in Fig. 1.
11 ~ E/Eo
0.6 0.4
0 .,2
elasfc rro - Ius
0
0 5 10 15 20
Ca++ nlJ~I/m3
Figure 1. Consequence of calcium leaching on the cement paste on elasticity (after Gerard ( 1996) ).
It may be also related to the porosity of the material in the case of a cement paste (Ulm et al. 1999). Figure 2 shows the material responses in tension and in compression at different levels of chemical damage.
The mechanical evolution of damage will affect the diffusion of the ions in the material too. In the absence of experimental data, the variation of the diffusion coefficient due to damage can be neglected. In more advanced computations, it can be arbitrarily fixed as a S-shaped function ranging in between ~ which is the value of the diffusion coefficient in the absence of chemical attack and Dmax which is the value for a cracked material which cannot
10
-60 -40 =20 20
-40
Figure 2. Constitutive law of a concrete as a function of the ageing variable V (stresses on the vertical
axis are in MP a, strains on the horizontal axis are m/m 1
o-
4).9.2.2 Sensitivity analysis
The chemo-mechanical damage model has been implemented in a finite element code according to a staggered scheme. The diffusion problem (Eq. 1) is solved first over a time step, considering that mechanical damage is constant, then the mechanical problem is solved assuming that the chemical damage is constant. The time integration scheme in the diffusion problem is unconditionally stable and the mechanical solver uses a secant stiffness algorithm that provides sufficiently robust results with such a damage model (Rodriguez-F erran and Huerta 2000). It should be stated here that both the diffusion problem and the mechanical problem are non linear. They are coupled, although the influence of mechanical damage on the diffusion problem is quite small. For a good accuracy, the finite element grid and the time steps are rather small (smaller than what is needed for the damage problem in the absence of coupled effects). These are two reasons, besides simplicity of implementation, why a staggered scheme has been preferred to a fully coupled computational approach as it provides a reasonable accuracy. Note also that it is possible to control the accuracy of the time integration in the diffusion process (Diez et al. 2002).
Let us perform first a sensitivity analysis and consider a three point bending beam subjected to an external constant deflection and a chemical attack by pure water on the tensile bottom face (Fig. 3 ). This is a plane stress calculation. Vertical displacements are prevented at the bottom supports, and fixed at mid span on the upper part of the beam under the load. Horizontal displacement is prevented at the left-side support. The central half of the beam is treated with the damage model while the rest is assumed to remain elastic. The diffusion coefficient is assumed to remain constant (Table 1 ). All the computations have been performed with the same mesh of 4 nodded square elements of size 2.5 mm. Initially, the tensile stress at the bottom is 80 % of the tensile strength. Due to leaching, chemical damage propagates from the bottom to the upper faces of the beam. The strain increases and mechanical damage is triggered in the central part of the beam. As a consequence, the beam
E At Bt Ko
/c
V D35000 MPa 1 6000 1.510-4 1cm 0.2 7 10-10m2/s
Table 1. Model parameters for the evolution of damage.
fixed displ a.oeme nt
160mm
Figure 3. Three point bend beam subjected to a chemical attack and a constant deflection.
For a mode I crack propagating in an infinite body, it is possible to show that the fracture energy is roughly proportional to the area under the stress strain curve and to the internal length (Mazars and Pijaudier-Cabot, 1996). Because the internal length is proportional to the fracture energy, it is sufficient to change this parameter in order to change the fracture energy without changing the tensile strength. We can observe in Fig. 4 that the time to failure is extremely sensitive to the fracture energy. A 100% increase of the fracture energy G 1 results in a 600% increase of the time to failure.
-16000 -14000 -12000 10 Load (N) 210 410 Time (days) 610
Figure 4. Variation of life time predictions with the fracture energy.
9.2.3 Residual strength of leached beams
We are going now to compare the model predictions to experimental results. The experimental data have been taken from Le Bellego et al. (2000) and Le Belle go (200 1 ).
9 .2.3 .1 Size effect tests on leached specimens
The experimental program performed consists in residual strength tests: the residual behaviour of mortar beams was obtained after leaching in an aggressive solution (am onium nitrate). The specimens are mortar beams of rectangular cross section. In order to study size effect, geometrically similar specimens of various height D = 80, 160, and 320 mm, of length L = 4D, and of thickness b = 40 mm kept constant for all the specimens have been tested. The length-to-height ratio is L/D = 4 and the span-length-to-height ratio is 1/D = 3. The beams were immersed into the aggressive solution during different periods of time (28, 56 and 98 days). Only the two lateral sides were exposed in order to have a unidirectional leaching front. The leaching depth X 1 was measured at the end of each time period. It helped at defining the leaching rate LR= 2X 1 I b which is the ratio of the leached cross section to the initial cross section of the beam. For 28, 56 and 98 days of leaching, the leaching rates are 45%, 62%, and 84% respectively. After the chemical degradation tests, the residual mechanical behaviour of the beams were obtained from three point bending tests. A notch of depth D/1 0 and thickness 3 mm was sawed just before the mechanical test. The notch thickness was kept the same for all specimens. Its size is approximately that of the sand particles and the notch could be seen as a local defect in the beam. The response of bending beams entirely leached was also extrapolated from these data following the method described in Le Bellego et al. (2000).
9.2.3.2 Response of leached beams
The parameters controlling chemical damage have been fitted independently, including the diffusion coefficient in Eq. ( 1) whose variation depends on the type of accelerated leaching used in the experiments (complete data are available in Le Belle go 2001 ). The parameters entering in the mechanical model are provided in Table 2. These parameters result from a manual (trial and error) fit of the size effect test data on sound beams.
/c Ko At Bt E V
40mm 3 10-s 0,95 9000 38500 MPa 0.24
1rDOO - lload (k N.) BOO -GOD 200 0 1rDOO load (kN.) 600 200 ~ EXPER~IMENTAl - - NUMERICAL rD.2 deflecti'on (mm) - EXPERIMENTAl - - U'MERICAL 10~2 deftecti'on (mm) 0 .. 4
Figure 5. Prediction of the response of leached beams for two leaching rates 45% (a) and 64% (b). The thin lines correspond to the experimental results for each size and the thick lines correspond to the computations.
It is now possible to compute the responses of beams at different leaching rates and to compare with the experiments. A one dimensional diffusion problem is solved first within the beam thickness in order to compute the calcium concentration. Then, the distribution of calcium ions is converted into a distribution of chemical damage according to the function plotted in Fig. 1. It is averaged over the thickness of the beam. Then, the average chemical damage is inserted into the mechanical model (decrease of Young's modulus) and the load deflection curves of the beams are computed. Within the fracture process zone, the finite element should be smaller than the internal length. The finite element meshes of geometrically similar beams should not be geometrically similar (unless the above requirement is met for each size). In the present computations, the finite elements placed in the fracture process zone (constant strain triangles) have a size of 1/3 of the internal length approximately.
Figure 5 shows the numerical predictions for leaching rates of 45 % and 64%. Due to chemical damage, the average Young's moduli of the beams have been decreased by 25% and 40% in the mechanical computations respectively. These comparisons can be considered to be
quite satisfactory. The softening response for large beams is not very well described but the peak loads are almost predicted correctly.
9.2.3.3 Prediction of size effect
In order to examine the accuracy of the above computations, it is helpful to consider them on a size effect plot since it is an extrapolation of the model predictions for different sizes of specimens. A simple version of Bazant's size effect law is used (Bazant and Planas, 1998). The nominal strength (MPa) is obtained with the formula:
3 Fl
a =
-2 b(0.9D )2 (10)
where b is the thickness of the beam, D is the height (mm), I the span (mm), and F the maximal load (N). The size effect law reads:
(11)
/ 1 is the tensile strength of the material, d0 is a characteristic size which corresponds to a
change of failure mechanism between strength of materials and linear elastic fracture mechanics, and B is a geometry related parameter. Dld0 can be considered as a measure of the
structural brittleness. The larger it is, the more brittle the structure, which tends to fail according to linear elastic fracture mechanics. Bf, and d0 are obtained from a linear regression.
The fracture energy G 1 is also obtained with this regression. Table 3 shows these parameters for sound and entirely leached beams.
B/
1 (MPa) G1 (N/mm) d0 (mm)Sound 5.25 89 416
Leached 3,04 26,9 123
Table 3. Material characteristics from size effect regression on experimental data.
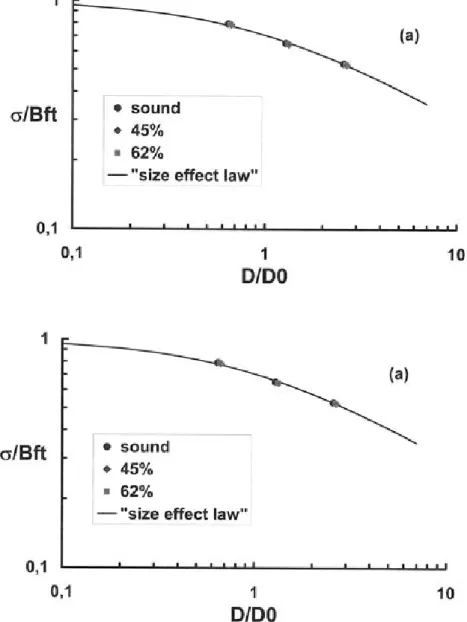
Figure 6a shows the size effect plots for the computations of sound beams and of leached beams at different leaching rates. Figure 6b shows the experimental results, which are quite different from the computations. These plots have been obtained assuming that the beams are made of a homogeneous material equivalent to the leached and sound materials in the cross
section. For each stage of leaching, new values of B/1 and of d0 are obtained from the regression and used to normalise the data in Figs. 6a,b. The tensile strength / 1 , the parameter
d0 and the fracture energy which result from these fits of Eq. ( 11) should not be regarded as
intrinsic material properties as they depend on the leaching rate in the cross section of the beam. It is their initial values (sound material) and their asymptotic values (leaching rate of
100%) which have a sense in terms of constitutive modelling and therefore are intrinsic, since in these cases the beams are indeed made of a homogeneous material.
1 u/Bft 0,1 1 u/Bft 0,1 • .sound • 45°1~ • 162°/o
- · "siize effect lawn
• sound
• 45o/~
- 162°/o
11
DIDO
- · "s i~Ze effect I awn
11
DIDO
10
10
Figure 6. Prediction of size effect at several leaching rates (a), and experimental size effect at several leaching rates (b).
Figure 6a shows that the model cannot reproduce the shift of the experimental results to the right on the horizontal axis of the size effect plot. This shift, observed on Fig. 6b, corresponds to an increase of brittleness of the beams upon leaching. For such a shift to be captured, d0
should change with the leaching rate at least. Computations performed by Le Bellego et al. (2003a) have shown that d0 is proportional to the internal length I c which does not depend on
chemical damage here. Hence d0 does not depend on the leaching rate and a shift to the right
or left of the data points on the horizontal axis of the size effect plot cannot be described.
/c
Ko At Bt E VSound 45.9 mm 2.92 1
o-
5 0.72 10000 38500 MPa 0.24Leached 35.3 mm 7.41 10-5 0.88 10500 13052 MPa 0.24
Table 4. Set of model parameters for sound and leached materials resulting from optimised fits.
Developing a new constitutive relation which would encompass the response of the sound and leached materials at the same time is outside the scope of this chapter. It is possible, however, to perform a new calibration of the mechanical damage model assuming that it describes the response of the leached material only (Le Belh!go et al., 2003b ). Table 4 shows the resulting model parameters and figure 7 shows the comparison between the experimental data and numerical model for the degraded material. The internal length decreases by 24% and the damage threshold is multiplied by 2.5 as the material is leached. There is no doubt that such variations are the result of the micro structural changes occurring inside the cement paste upon leaching. 4000 Load 1(N) 1000 ... ... ... , ...
-.... ..._
- - - ~- ~!!!!!! -0+---~---T---r---~ 0 0Jl15 0.1 0.15 Disp~lacement (mm1)Figure 7. Size effect experiments - comparison between the experimental results (dotted curves) and the numerical results (plain curves) obtained after calibration of the model for degraded material.
The computations considered in this section could be performed with any other constitutive model aimed at describing chemo-mechanical damage due to calcium leaching. It is found here that the mechanical consequences of leaching are better described if the model parameters in the damage evolution laws are changed. The most important variations deal with the internal length and the damage threshold. These variations remain to be explained. In order to investigate them more easily, experiments on model materials can be performed. Such data are going to be reviewed next.
9.3.
Experiments on model materials
In quasi-brittle materials, fracture exhibits a finite size process zone. Macro-cracking is the result of progressive material damage in which micro-cracks appear first in a rather diffuse way and then coalescence occurs in order to form the crack. The size of the resulting fracture process zone (FPZ) is not dependent on the structural size, provided it does not interfere with the boundaries of the considered body. It is controlled by local heterogeneity, and by the state of stress as well. From the modelling point of view, the description of the FPZ has to involve the introduction of an internal length in the governing equations. It can be in the form of a characteristic length which is related to the length of the process zone, or in the form of an internal length in non local constitutive relations.
Figure 8. Distribution of polystyrene beads in 1.4 density mixture.
In most existing proposals, the internal length is a constant parameter. Still, there are some theoretical indications that suggest that the internal length should change in the course of the fracture process: with the help of micromechanics, Bazant (1994) arrived at the conclusion that when the interactions between cracks and voids develops in the course of failure, the weight function entering in the calculation of the non local variable controlling damage should change. The aim of this section is to examine, with the help of model materials, the correlation between the width of the fracture process zone observed with acoustic emission (AE), the parameters in the size effect law, and the internal length in non local constitutive relations. In
addition, tests on model materials designed to investigate ageing effects are presented in order to exhibit variations of the internal length due to the evolution of the microstructure.
All test specimens were made with a mix which consists of ordinary Portland cement CP A-CEMI 52.5, polystyrene beads, normal density fine sand with a maximum size of 2 mm, a superplasticizing agent (Glenium 51) and water. Expanded polystyrene spheres of 3 - 7 mm mean diameter were used as aggregate in the mix design. Expanded polystyrene consists essentially of air. Four different mixes of densities 2.0 - 1.8 - 1.6 and 1.4 (see Fig. 8), having polystyrene content g of 13 - 22- 31 and 39% respectively, were achieved in addition to the reference material (mortar without inclusions). All mixes have a cement/sand ratio of 0.46 and a water/cement ratio of 0.4. For the bending tests, four different sizes of geometrically notched concrete specimens were used. The depths were D
=
40 , 80 , 160 and 320 mm while the thickness was kept constant for all the specimens b=
40 mm. The length to depth ratio was LID=
8:3 and the span to depth ratio was IlD=
2.5 for all specimens. One notch of depth D/6 and thickness 1.5 mm (same for all dimensions) was placed in each bending specimen by putting steel plates in the moulds before casting.9.3.1.1 Size effect tests
The size effect tests followed the guidelines established by RILEM ( 1990). The tests were notch opening controlled with a constant CMOD rate of 0.1 J.!mls forD = 40 - 80 mm, 0.20 flm/S for D = 160 mm, and 0.25 J.!mls for D == 320 mm. Figure 9 shows the test set up and figure 1 0 shows the specimens tested.
(a)
(b)
deflcctiotl
1nea "ur ID t
---I ~I ·--·- -·- ·- -... - ·-~- - ...
Figure 10. Specimens for the size effect tests.
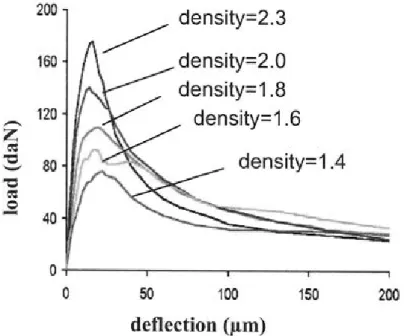
Figure 11 shows the response of medium size specimens (D=40mm) for each material density.
Note that the deflection at peak is almost independent from the density of the material. The material density influences still the mechanical behaviour of beams; the lower the density, the lower the stiffness and the peak load.
200 1'60 . . ~ density=2.3 - d~ensity=:2.0 dl~e n stity= 1 ..
a.
den1sd.y=1 ~ 6 density=1 ~4 deflecti.on (Jlm)Figure 11. Influence of density on structural behavior, average load-deflection curves, for different material densities on 40 x 40 x 107 mm3 beams.
From size effect interpretation, it is found that the fracture energy G1 shifts from the value 88.5 N/m for the reference material to 52.30 N/m for the material density 1.4, a decrease of 41%. 0,00 .... ·0,06 -~
=
l3
·0,12 . ._. etJ C/1 -0,18 density ~ 2: 3 -0., 24 • density = 1 ,40 -0.30 ·+---_...---...---·1.2 0,8 0,4 00 04 log (D/do)Figure 12. Bazant's size effect curve: calibration for material density 2.3 and 1.4.
In figure 12, size effect results are presented in a log-log diagram only for the two extreme densities (1.4 and 2.3) for more clarity. The larger the beam, the lower the relative strength. It can be noticed that the failure of the beams with polystyrene (density = 1.4) tends to adhere more to strength of material than to fracture mechanics, since the corresponding data shift right on the size effect plot. It means that the material becomes more ductile as the density decreases (increasing porosity).
9.3 .1.2 Acoustic emission analysis
AE analysis was performed on specimens of size ( 40x 160x428 mm3) and for three different
material densities (2.3, 2.0 and 1.8). Three piezoelectric transducers (resonant frequency of 150 kHz) were used. Transducers were placed around the expected location of the process zone to minimise errors in the AE event localisation program. The accuracy of the technique ranged from ±4 mm for the reference mortar to ± 10 mm for the lighter material tested (density
1.8).
The cumulated locations of acoustic events throughout a test are shown in Figure 13: the plotted points indicate the detected AE sources over a window of observation, centered at the notch, of width 130 mm and covering the beam depth. In the same figure, we have plotted the observed crack path that appeared after the test on the lateral surface of the specimen.
The major aim of the AE analysis is to obtain an experimental characterisation of the FPZ. More specifically, it is the width of the FPZ which is the quantity of interest since it is proportional to the internal length in continuum models (Mazars and Pijaudier-Cabot 1996) and to the parameter d0 obtained from Bazant's size effect analysis (Le Belh~go et al. 2003a).
An useful approach, well suited to measure the crack band width, is to divide the specimen into an array of rectangular elements and to count the AE events located within each element.
entire record during the experiment, is plotted as a function of its horizontal position x for various vertical positions y over the depth of the specimen. Then, the crack band width is defined as the length of the segment of a horizontal straight line placed at 20% of the maximum number of counts (Nbmax), which intersects the average distribution of AE events (see Haidar et al. 2003 for more details). These values are about 50, 67 and 85 mm for the material densities 2.3, 2.0 and 1.8 respectively.
IlL · s: "11'1":
·- igtu,re 1.3.. utnu.~ativ·- locati.on of A . ,nt 1 mat ria.l den ··ty 2.3)~
We have also studied the case where the horizontal straight line intersects the vertical axis at the value = 10 % of Nbmax, and we have observed that the evolution of the width of the FPZ,
as a function of the polystyrene content g, is the same.
2.5 2 05 ~ft _._Gf' .. . ~ dO . - • E ~FPZ(20%) •· -c-.. -FPZ {10%} 0+---~----~---~~~~ 0,00 010 020 0,40 0,50
Polyst ..
r··ene
content . · : ol.o/o
Figure 14 shows the evolution of the width of the FPZ defined according to this criterion with the mass density of the specimens. On the same graph, the evolution of d0, of the fracture
energy G1, of the tensile strength};, and of the Young's modulus E are also plotted. Note that there is a very good agreement between the evolution of d0 and the evolution of the width of
the FPZ.
. idth f FPZ (nm)
0.3 0.7 pe.atk 0.7· 0.3 load
Figure 15. Evolution of the width of the fracture process zone v.s. the applied load for the two material densities. The load on the horizontal axis is increasing and then decreasing in the post peak regime.
This technique allows the determination of the shape of fracture process zone in its final stage, but incremental counts (in between two loading stages) provide also the evolution of the FPZ as the failure process develops. Such an evolution of the width of the FPZ is shown in Fig. 15. The width of the FPZ enlarges in the course of damage progression. Furthermore, the width is larger for the porous material compared to the reference one (without inclusions). 9.3 .1.3 Correlation with the internal length
We are going now to compare the experimental quantities determined in the previous section, namely the width of the FPZ and the parameter d0, with the internal length in a continuum
model. The non local version of the isotropic damage model is used
The internal length is obtained with the help of inverse finite element analysis, following the procedure described by Le Bellt~go et al. (2003a). The calibration procedure is based on a simultaneous fit of the numerical and experimental load deflection curves for the four sizes of spec1mens.
· oa I f ·) 1000 - ,experience s 1 11 lation
00
600 400 200 0 0 0.04 0.1 2 0~ 6 efl • ·n ( m)Figure 16. Prediction of the response of mortar beam with the material density 2.3.
Figure 16 shows the fits obtained for the reference material. The internal lengths and the other model parameters obtained as a result of these fits are reported in Table 5 for all the mass densities. Density le (mm) Ko At Bt 2.3 34.4 4.61 10-5 0.79 9836 1.8 51.5 4.66 10-5 0.65 9220 1.4 64.2 4.79 10-5 0.52 7893
Table 5. Set of model parameters resulting from optimised fits.
Same as for the acoustic emission tests we have also measured the width of the FPZ obtained in the numerical analyses. It is 75 mm for the reference material, 120 mm for material density 1.8, and 139 mm for the lowest material density. These values are 40 percent greater than the experimental ones but the ratio between the computed and measured widths of the FPZ is constant whatever the mass density of the material as shown in Fig. 17. In the same figure, we have plotted also the evolution of Bazant' s size effect parameter d0 and of the
internal length with the mass density of the specimens. The respective variations of these parameters are very similar, which is quite remarkable. This is also in good agreement with the numerical result obtained by Bazant and Pijaudier-Cabot ( 1988), where the width of the zone of localised damage was shown to be proportional to the internal length of the material. These results yield two conclusions: firstly there are evidences taht the internal length should evolve during the fracture process; secondly if the variation of the mass density of the material is
intended to simulate ageing due to calcium leaching, it is clear that the observed increase of the internal length is not consistent with data obtained from accelerated ageing where this parameter is shown to decrease. The reason for this discrepancy is probably that the model material simulates a decrease of the material viewed as a homogeneous one while in reality material dissolution is selective, each phase having different mechanical properties.
c
=
25 2,,0 ... ~ 15 I - l=
>
1,0 ...._dO ...,._ FPZ (e·xp.) FPZ (num.) le 0,5 -r----""""'1""'---r---r-... ---.. __ 0,0 0 1 0.2 0,3 0,4 05Figure 17. Evolution of d0, FPZ (experimental), FPZ (numerical) and le with polystyrene content.
9.4.
Damage and non linear creep
In common practice, it is usually assumed that concrete exhibits a linear visco-elastic response for low load levels and that the instantaneous mechanical response of concrete is elastic. For high load levels, deviation from linearity of the creep behaviour of concrete is expected. Under high sustained loads, cracks grow and interact with visco-elasticity. Some experimental and analytical results concerning non-linear creep can be found in the literature (see among others Bazant, 1988, Gettu and Bazant 1992, Mazzotti and Savoia 2003, Rtisch et al. 1957, Rtisch 1958) but much remains to be learned.
Modelling non linear creep of concrete is of fundamental importance for severely loaded structures as creep may decrease the material strength with increasing time. 1'he evaluation of the residual carrying capacity of structural components is a problem of growing importance for civil engineering structures such as nuclear power plants. Actually, these structures are often exposed to high stresses for a long time, due to what damage develops. Therefore, the results arising from short time tests cannot be considered a sufficient basis for judging the safety of such structures and it is of great interest to devise methods for evaluating their residual capacity. This problem has drawn the attention of some authors, among them Rtisch and eo-workers (1957, 1958), who have carried out the first experiments in order to determine the
effect of continuous loading duration on the resistance and deflections of concrete specimens under compression tests. They found that the capacity of a structure subjected to creep loads seems to be 70 to 80% of that observed in short time compression tests.
In this section, the main results of a set of experimental creep tests on concrete three points bend specimens at different load levels are presented. The objective is to investigate the ranges of variation of the time response under constant load due to variations of the load level. For each creep test, a different load level has been applied, starting from low levels (36% of peak load) where linear visco-elasticity applies, to high levels (80% of peak load) where tertiary creep causing failure at a finite time can be observed. Concrete B 11 used for the construction of the Civaux power plant in France and tested by Granger ( 1995) is being used in this experimental program. The specimens were made with this mix which consisted of ordinary Portland cement CPA-CEMII 42.5, fine sand with a maximum size of 5 mm, crushed gravel of size 5 to 25 mm, a superplasticizer a gent (Glenium 21) and water. This mixture is characterised by a water-cement ratio of0.56 and a slump of 4 cm.
9.4.1.1 Fracture tests
Three different types of tests were performed in order to determine the mechanical characteristics of concrete. Six cylindrical concrete specimens of diameter 16 cm and length 32 cm were used for compressive and splitting tests. The compression tests were performed using 300 KN capacity hydraulic testing machine at a loading rate of 0.5 MPa/s until failure.
The third kind of tests consisted on three points bend size effect experiments on prismatic geometrically similar notched beams. Three different sizes were used, the depths were D 1 = 10cm, D2= 20cm, and D3= 40 cm with respective lengths 35, 70, and 140 cm while the thickness was kept constant for all the specimens b = 1 0 cm. The span to depth ratio was 1/D = 3 for all specimens. One notch of depth 0.15D and thickness 3 mm (same for all dimensions) was performed in each specimen by placing a plastic plate at the midpoint perpendicular to the long direction of the mould before casting. Nine prismatic specimens were cast, three for each
SIZe. 3,0E 4 2,5E+4 2,01Elh4 -z
-~:1 ,5E+4 ·0 ...,.o~+-4
I -1)3 ooQ--02 - [)1 O,OE+O~~~or----=:::::==:~~~~~~=
O,OE+O 5·,0E-5 1,0E-4 1 ;5~-4 2,0E-4 2 5EDefilection (m}
Figure 18 shows the average responses for all dimensions. Curing conditions for all specimens were 28 days at 50% RH and controlled temperature of 20° C. Mean values of physical and mechanical properties are summarised in table 6.
Another set of three points bending tests was carried out on beams of size D2: 1 Ox20x70 cm without notches. These tests were aimed at determining the maximum load of unotched beams in order to calibrate the applied load in the creep tests, where beams having the same geometry have been used. The average maximum load determined from flexural tests on three specimens is about 2409 daN.
Properties Mean values
fc (MPa) 41.25
ft
(MPa) 3.48 Edyn (MPa) 39000 Dl : Fmax (daN) 863.42 crN (MPa) 5.61 D2: Fmax (daN) 1401.13 crN (MPa) 4.42 D3 : Fmax (daN) 2377.31 crN (MPa) 4.81 Gr(N/m) 180Table 6. Mechanical properties of concrete B 11.
9.4.1.2 Creep tests
The creep tests were performed on frames designed at R&DO which apply a constant load on flexural beams. The frames have a capacity ranging from 5 to 50 KN and can accommodate geometrically similar specimens of three different sizes. The load is applied by gravity with a weight and counter-weight system which enables a fine tuning of the load. Figure 19 shows a general view of these creep frames.
The specimens tested have the same thickness of 10 cm. The smallest D 1 is 1 0 cm high and 35 cm long. The medium D2 is 20 cm high and 70 cm long and the largest D3 is 40 cm high and 140 cm long. Two kinds of creep tests have been performed. The first one is intended to study the influence of the load level on creep. In the second kind of test (which is still in progress), the interaction between creep and fracture of concrete is considered via the associated size effect in structures and the decrease of the fracture energy due to creep. The applied loads in the creep tests have been determined from the previous fracture tests on the same material and the same geometry.
Twelve prismatic beams were used. For each creep test, a different load level has been applied, starting from low levels to very high levels. The applied loads are given in table 7.
Apphed load notched notched unotched
beams beams beams
D1- daN D2- daN D2- daN
36% Fneak 313
-
-50% Foeak
-
119860% Foeak 510 746 1444
70% Foeak
-
-
167880% Fneak 672 1033 1940
Table 7. Applied loads in creep tests.
1 ai lnr~ - 16.0% - SOCYo
20 1
0+·---~--~--~--~~~~~~-0 5 10 15 20 25 30 35 40 Time 1{d'ays)Figure 20. Deflection of unotched beams 02 for different load levels.
The first set consists of 4 unotched beams of dimension D2 loaded at 50%, 60%, 70% and 80% of the maximum load. These tests are performed at 20°C and 50% RH and the specimens are not protected. Therefore, basic creep and drying creep occur at the same time. The age of
concrete at the beginning of the creep tests is 28 days. Figure 20 presents the total displacement (creep displacement plus instantaneous displacement) measured on the specimens versus time for the first three loading levels. These curves indicate that for all load levels, creep kinetics are comparable with the exception of the specimen loaded at 70% from peak load, where failure due to tertiary creep occurs after 8 days. In this test, we observed an important acceleration of creep and then failure. Concerning the specimen loaded at 80% from peak load, total failure occurred 2 minutes after applying the load.
The second test series consists of two notched beams of dimension D 1 loaded at 60% and 36% of the maximum load and one notched beam of dimension 02 loaded at 60% of the maximum load. These tests were followed by a third set consisting of two notched beams of dimension 02 and three notched beams of dimension 0 1 loaded at 80% of the peak load. One of these beams failed after 4 days from loading, and results obtained for this test are not reported here. Specimens in the second and third test series were protected from desiccation by a double layer of self-adhesive aluminium paper. Hence basic creep was considered only. The experimental measurement of basic creep of concrete requires also that drying shrinkage be prevented. The curing conditions (3 months at 100% RH and 20°C) guaranteed to avoid early age autogeneous shrinkage so that basic creep could be measured only. The basic creep displacement was determined by subtracting the instantaneous elastic displacement from the total displacement. Figure 21 compare the displacements due to basic creep for the smaller specimens (size 01 ). It shows the influence of the load level on the basis creep evolution versus the elapsed time.
40 --80PMQ!1 - 6(lro/o-01 36%--01 10 0 10 20 30 40 50 60 70 80 Time (days)1
Figure 21. Basic creep displacement of notched beams D 1 for 36o/o , 60o/o , and 80o/o of peak load.
As expected, increasing the applied load increases the basic creep magnitude. Moreover, creep develops very fast in the first days of loading and stabilises after a few weeks for the two lower loading levels. The specimens loaded at 36% and 60% of the maximum load were cast from the same batch. The results show a variation of the amplitude of basic creep of the 36% and 60% loaded specimens, which increases and decreases again between 40 days and 50 days
climate control system and which lead to this elevation of the magnitude of deflections measured on loaded specimens. The specimen loaded at 80% is part of the third set of creep tests. It was made from another batch but followed the same curing conditions. For this specimen, basic creep increases rapidly.
Figure 22 presents a comparison between basic creep displacements obtained on two specimens of size D 1 and D2, both of them loaded at 60% from their corresponding maximum load. These results show that the basic creep kinetic for dimension D2 is greater than that of dimension D 1. This difference is more obvious in the case of a 80% loading level as seen in figure 23. On this plot, we show also the results obtained for the two specimens of each size subjected to the same creep load. The reproducibility of the test is quite satisfactory.
40 ~---~
35
5
16()0~02
~ ,60'0/o-01
Figure 22. Basic creep displacement of notched beams D 1 and 02 loaded at 60o/o of peak load.
1~~ ~~~~~---~----~~~~~ 110 ~00 90
"E
ao I A Q. 70 4l ! 60 u u 50 ·;; m ,40 il l 30 20 -10 -D2-spec1 - ID2-spec2 - D1.,spec1 ll , h M , _. 0+---~~~--~--~ 20 40 160 80 Time (days}19.4.1.3 Acoustic Emission in basic creep tests
We applied the AE technique to the creep tests presented above. Transducers were placed around the expected location of the process zone, on one side of the specimen, and in a linear array.
The primary aim is to correlate the evolution of basic creep with the total number of acoustic events. In other terms, this study is intended to clarify the qualitative relationship between basic creep strain and damage occurring inside the material. More accurate analyses might be performed which include acoustic event localisation in order to visualise the locations of damage. Such tests which require a large number of transducers placed on the same beam will be performed in future experiments. Figure 24 presents the total number of acoustic events versus time and figure 25 shows the corresponding basic creep evolution occurring at the same time.
Figure 24. Total number of AE events versus time for the 80o/o basic creep loaded specimen 02.
60
-10
O L---~
OE+O 1E+5 2E+5 3E 5 4E 5 BE+5 6E+5 7E+5
Tin• (sec)
We may observe that the number of AE events increases as basic creep develops. The evolution of the AE number is almost linear. There is a change of slope of the curve, which seems to correspond to a small peak in Fig. 25. This peak is due again to a slight defect in the room temperature control. If one admits that AE events are due to microcracking, these results show clearly that there is a coupling between creep and damage. It follows that the mechanical responses of beams subjected to creep compared to those not subjected to creep, ought to exhibit a difference due to initial damage accumulated during creep loads. A reduction of the residual carrying capacity due to basic creep has to be expected in particular.
9 .4.1.4 Residual capacity tests
In order to investigate the variation of the residual capacity due to creep, comparison specimens cast at the same time than those subjected to creep were kept under the same conditions of temperature and relative humidity. Three points bending experiments till failure were carried out on the creep loaded and on the comparison specimens. Results deals with unotched beams under combined drying and basic creep. After 40 days of loading, beams of dimension D2 subjected to loads of 50% and 60% of the maximum load were removed from the creep frames and then immediately subjected to three point bending loading up to failure with a constant loading rate .
. 2500 .. ---~ 2000 z m . -1500 "a
-"a ~ 1000 ....1 500 0 100 ... without: c11eep - after ·creep at 60% ~ after creep at 50% 200 300 400 D.isp acetnent: (- · ·) 500Fig,u re 26. R. · . · ~d ual ~capac lty of unot~ch · . .d bea m· of dimen .·.·ion 02.
The chosen rate of loading is 0, 1J.un/s, which is the same rate used as in the flexural experiments intended to determine the average maximum load for this kind of specimens. Figure 26 displays the load-displacement curves obtained for the specimens after creep load and for the unloaded comparison specimens. The maximum carrying force of the specimens subjected to creep initially is reduced of about 20% in comparison to those of the unloaded specimens. Furthermore, it is found that there is no significant impact of the loading level on the response of beams. The 50% and 60% loaded specimens have approximately the same peak load. The results obtained on notched specimens of dimension D 1 loaded at 36% and
60% of the maximum load during 60 days (basic creep tests) did not exhibit such a decrease of the maximum load. This underlines the importance of drying creep, at least for low load levels. 9.4.1.5 Damage coupled to creep: preliminary constitutive modelling
We consider here basic creep only. It is modeled with visco-elasticity, in the form of a generalized Maxwell chain (Fig. 27). The constitutive law is written with the help of a relaxation function R:
t
a 1 ( t) = R ( t 0 , t) .& ( t 0 )
+
J R ( r, t) ·i (
r) · d r (12) toat
is the effective stress applied to the Maxwell chain, t0 is the age of loading. Note that theformulation is purely one-dimensional here. The relaxation function is:
n
R ( r, t)
=
E0 ( r)
+
I
E ( r). exp( - r ( t - r))JL=1 JL JL
(13)
tJ.t and EJ.t are the relaxation time and the modulus of elasticity of each branch Jl in the generalized Maxwell model respectively. In general EJ.t( to) can be calculated by the method of least squares. As for the parameters tJ.t, however, they cannot be calculated from measured creep data but must be suitably chosen in advance (Bazant, 1988).
-ig11re 27. G~eneraHzed axw ·l model.
In order to incorporate damage, which is a degradation of the overall elastic stiffness, into the time dependent creep functions, we use the effective stress approach (Omar et al. 2003).
(14) It is a classical approach, in which we consider a time independent growth of damage. Mechanical damage is controlled by the total strain. We have used this formulation to compute two examples. The first one is a creep test of a tensile bar. Figure 28 shows the results. Note
that tertiary creep can be described, including failure after some load duration. Such a result cannot be obtained in a series arrangement between visco-elasticity and damage or plasticity. The second case corresponds to experiments in which beams are subjected to a constant displacement at mid-span for a given period of time, and then loaded up to complete failure. This test is aimed at obtaining the influence of creep on the capacity of bending beams. Figure 29 shows the model predictions for several values of the internal length.
OJHH2 0,00]
=
.c·o,ooo ·
e
o!!ooo6
~ ~ QJ• 0 0004=
~ u 0 _J 00002 0 0 ~000 2000 3000 4000 5000 000 'T'im.e (da s). ig r~e 28 ..
er,·.
epl ~oading of a tensile bar.-6E-05 -4E-05 m::·· ao -Lc-8 ·ctn - LCi-'-4 om -1Lc- .2om -1,0E. 03 ~·.OE+&3 -2,SE+03 I IO"sp acement (rn)
Figure 29. Influence of the relaxation on the residual capacities of beams for several internal lengths.
Again, the internal length has a great influence on the model predictions, which underlines the necessity of an accurate determination of this model parameter, and a good knowledge of its variation due to creep. According to experiments by Gettu and Bazant ( 1992), the size of
the fracture process zone decreases as the loading is slowed down. If this decrease results in a decrease of the internal length, it would mean that due to creep, the capacity of structural elements might be overestimated if the internal length is assumed to remain constant.
9.5.
Discussion and closure
The test data shown for calcium leaching and for model materials show that there is a strong correlation between the internal length in non local damage models and the evolution of microstructure due to ageing. The evolution of this parameter is pretty difficult to measure experimentally and it requires combination of several tests, including size effect test with inverse analysis based on non linear computations. Variations of this length should not be neglected. As seen in the calcium leaching case, a decrease of the internal length induces a material that is more brittle, more prone to sudden failure. Neglecting such a decrease places the design on the unsafe side as the capacity of the structure is over estimated.
Similar effect are expected for creep fracture interaction. For high load level, tertiary creep i.e. a visco-elastic response of the material coupled with an evolution of damage, occurs. Basic creep on bending beams seems to be size dependent. For two geometrically similar specimens (sizes Dl and D2), the displacement due to creep is neither equal nor multiplied by two (which is the ratio between the sizes of the two beams). Residual capacity tests show that drying creep has a great influence on the residual carrying capacity of the beams. For the tests presented, which are limited to low creep levels ( 50o/o and 60% of the maximum load), basic creep does not influence the structural strength of the beam.
New constitutive relations with evolving internal length, and coupled creep damage effects, ougth to be devised in order to capture these phenomena. They can be inspired from simplified micromechanics (Pijaudier-Cabot et al. 2003) but they remain to be compared with experiments. For such a purpose, model materials such as those presented in this chapter may be of great help.
Acknowledgments:
Financial support from the European Commission through the MAECENAS project (FIS5-2001-00100), through the DIGA RTN network (HPRN-CT-2002-00220), and from the partnership between Electricite de France and the R&DO group through the MECEN project are gratefully acknowledged. The study on calcium leaching would not have been possible without the cooperation of Bruno Gerard and Caroline le Bellego from EDF. The first author is very grateful to them.
9.6.
References
Bazant Z.P. 1988, Mathematical modeling of creep and shrinkage of concrete, John Wiley & Sons Ltd.
Bazant Z.P., 1994, Nonlocal Damage Theory based on Micromechanics of Crack Interactions, ASCE Journal of Engineering Mechanics, 120, 593-617.
Bazant Z.P. and Planas J., 1998, Fracture and size effect in concrete and other quasibrittle materials", CRC press, Boca Raton and London, 1998.
Bazant Z.P. and Pijaudier-Cabot G., 1988, Nonlocal Continuum D~mage, Localization
Instability and Convergence, Journal of Applied Mechanics, ASME, 55, 287-294.
Carde C., 1996, Characterization and mode ling of the alteration of material properties due to leaching of cement-based materials, Ph.D. thesis, Universite Paul Sabatier, Toulouse, France, 218p. (in French).
Carde C. and Francois R., 1997, Effect of Leaching of Calcium Hydroxyde from Cement Paste on Mechanical and Physical Properties, Cement and Concrete Res., 27, 539-550.
Diez, P., Arroyo, M., Huerta, A., 2002, Adaptive Simulation of the Coupled Chemo-Mechanical Concrete Degradation, Proceedings of the Fifth World Congress on Computational Mechanics (WCCM V), July 7-12, 2002, Vienna, Austria, Editors: Mang, H.A.; Rammerstorfer, F.G.; Eberhardsteiner, J., Publisher: Vienna University of Technology, Austria, ISBN 3-9501554-0-6, http://wccm.tuwien.ac.at.
Gettu, R., Bazant, Z.P ., 1992, Rate effects and load relaxation: static fracture of concrete. ACI Materials J. 89 (5), 456-468.
Gerard, B., 1996, Contribution of the mechanical, chemical, and transport couplings in the long-term behavior of radioactive waste repository structures, Ph.D. Thesis, Departement de Genie Civil, Universite Laval, Quebec, Canada I Ecole Normale Superieure de Cachan, France, 278p. (in French).
Gerard B., Pijaudier-Cabot G. and La Borderie C., 1998, Coupled Diffusion-Damage Modelling and the Implications on Failure due to Strain Localisation, Int. J. Solids &
Structures, 35, 4105-4120.
Gerard B., Pijaudier-Cabot G., and Le Bellego C., 1999, Calcium Leaching of Cement Based
Materials: a Chemo-Mechanics Application, Construction Materials - Theory and
Application, Hans - Wolf Reinhardt Zum 6 Geburstag, R. Eligehausen Ed., ibidem, 313-329.
Goncalves A., Rodrigues X., 1991, The Resistance of Cement to Ammonium Nitrate Attack, Durability of concrete, 2nd International Conference, Montreal, Canada.
Granger L.; 1995, Comportement differe du beton dans les enceintes de centrales nucleaires (analyse et modelisation). These de doctorat de l'ENPC.
Haidar K., Pijaudier-Cabot G., Dube J.F. and Loukili A., 2003, Correlation Between the Internal Length, the Fracture Process Zone and Size Effect in Mortar and Model Materials. Submitted for publication to Concrete Science and Engineering.
Kuhl D., Bangert F., and Meschke G.,2000, An Extension of Damage Theory to Coupled Chemo-Mechanical Processes, Proc. ECCOMAS 2000, Barcelona, Sept.
Le Bellego C., Gerard B., and Pijaudier-Cabot G., 2000, Chemomechanical Effects in Mortar Beams Subjected to Water Hydrolysis, J. Engrg. Mech. ASCE, 126, 266-272.
Le Bellego C., 2001, Couplages chimie-mecanique dans les structures en beton attaquees par l'eau : Etude experimentale et analyse numerique, Ph.D. Dissertation, Ecole Normale Superieure de Cachan, France, 236p.
Le Bellego C., Dube J.F., Pijaudier-Cabot G., and Gerard B., 2003a, Calibration of Non Local Damage Model from Size Effect Tests, Eur. J. of Mechanics A/Solids, 22, 33-46.
Le Bellego C., Pijaudier-Cabot G., Gerard B., Dube, J.F. and Molez L., 2003b, Coupled Chemical and Mechanical Damage in Calcium Leached Cementitious Structures, ASCE J. Engrg. Mech., 129, 333-341.
Mazars J., 1984, Application de la mecanique de l'endommagement au comportement non lineaire et
a
la rupture de beton de structure, these de Doctorat d'Etat, Universite Paris VI, France.Mazars J., Pijaudier-Cabot G., 1996, From Damage to Fracture Mechanics and Conversely: a Combined Approach, Int. J. Solids & Structures, 33, 3327-3342.
Mazzotti C. and Savoia M., 2003, Nonlinear creep damage model for concrete under uniaxial compression, J. Engrg. Mech. ASCE, 129, 1065-1075.
Meftah, F., Nechnech, W., and Reynouard, J.M., 2000, An Elasto-Plastic Damage Model for Plain Concrete Subjected to Combined Mechanical and High Temperature Loads, Proc. EM2000, edited by J. L. Tassoulas, University of Austin, Texas.
Omar M., PijaudierCabot G., and Loukili A., 2003, Etude du couplage endommagement -fissuration, Revue Fran<;aise de Genie Civil, in press.
Pijaudier-Cabot G. and Bazant Z.P., 1987, Nonlocal Damage Theory, J. of Engrg. Mech., ASCE, 113, 1512-1533.
Pijaudier-Cabot G., Haidar K., and Dube J.F., 2003, Non Local Damage Model with Evolving Internal Length, Int. J. Num. Anal. Meths. Geomech., in press.
RILEM Draft Recommendations, 1990, Size effect method for determining fracture energy and process zone size of concrete, 23, 461-465.
Rodriguez-Ferran, A. and Huerta A. , 2000, Error Estimation and Adaptivity for Non Local Models, Int. J. Solids & Struct., 37,7501-7528.
Riisch H., 1957, Versuche zur Bestimmung des Einflusses der Zeit auf Festigkeit and Verformung, (Experimental Determination of the effect of the Duration of Loading on Strength and Deformation), Final Report, Fifth Congress, International Association for Bridge and Structural Engineering, Portugal, 237-244.
Riisch H., Sell R., Rasch C., Stockl S., 1958, Investigations on the Strength of Concrete under Sustained Load, RILEM Symposium on the Influence of Time on the Strength and Deformation of concrete, Munich.
Saetta, A., Scotta, R. and Vitaliani, R., 1999, Coupled Environmental-Mechanical Damage Model of RC Structures, J. Engrg. Mech. ASCE, 125, 930-940.
Schneider U. and Chen S. W ., 1998, The Chemomechanica1 Effect and the Mechanochemical Effect on High-Performance Concrete Subjected to Stress Corrosion, Cement and Concrete Research, 28, 509-522.
Schneider U. and Chen S. W., 1999, Behavior of High-Performance Concrete under Ammonium Nitrate Solution and Sustained Load, ACI Materials Journal, 96, 47-51.
Stabler J. and Baker G., 2000, On the Form of Free Energy and Specific Heat in Coupled Thermo-Elasticity with Isotropic Damage, Int. J. Solids Struct., 37, 4691-4713.
Ulm F.J. and Coussy 0., 1996, Strength Growth as Chemo-Plastic Hardening in Early Age Concrete, J. ofEnrg. Mech. ASCE, 122, 1123-1132.
Ulm F.J., Torrenti J.M., and Adenot F., 1999, Chemoporoplasticity of Calcium Leaching in Concrete, J. ofEngrg. Mech. ASCE, 125, 1200-1211.
Ulm F.J, Heukamp F.H. and Germaine J.T., 2001, Durability Mechanics of Calcium Leaching of Concrete and Beyond, Proc. of Framcos 4, R. de Borst et al. Eds, Balkema Pubs.,