HAL Id: hal-01324486
https://hal-univ-rennes1.archives-ouvertes.fr/hal-01324486
Submitted on 6 Jun 2016HAL is a multi-disciplinary open access
archive for the deposit and dissemination of sci-entific research documents, whether they are pub-lished or not. The documents may come from teaching and research institutions in France or abroad, or from public or private research centers.
L’archive ouverte pluridisciplinaire HAL, est destinée au dépôt et à la diffusion de documents scientifiques de niveau recherche, publiés ou non, émanant des établissements d’enseignement et de recherche français ou étrangers, des laboratoires publics ou privés.
Method for material characterization in a non-anechoic
environment
Laura Pometcu, Ala Sharaiha, Ratiba Benzerga, Razvan Tamas, Philippe
Pouliguen
To cite this version:
Laura Pometcu, Ala Sharaiha, Ratiba Benzerga, Razvan Tamas, Philippe Pouliguen. Method for material characterization in a non-anechoic environment. Applied Physics Letters, American Institute of Physics, 2016, 108, 108 (16), pp.161604. �10.1063/1.4947100�. �hal-01324486�
_____________________________
a) Author to whom correspondence should be addressed. Electronic mail: [email protected].
Method for Material Characterization in a Non-Anechoic Environment
L. Pometcu,1,a) A. Sharaiha,1 R. Benzerga,1 R. D. Tamas,2 P. Pouliguen,3 1
Institute of Electronics and Telecommunications of Rennes, 263 street Général Leclerc, 35042, Rennes, France
2Maritime University of Constanta, 104 street Mircea cel Batrân, 900663, Constanta, Romania 3Research and scientific innovation department of DGA, 7-9 street Mathurins, 92221, Bagneux, France
This paper presents a characterization method for extracting the reflection coefficient of materials and the real part of their permittivity. The characterization is performed in a real environment, as opposed to the classical measurement methods that require an anechoic chamber. In order to reduce the effects of the multipath propagation, a free space bistatic measurement was performed at different distances Material-Antennas in far field. By using a Teflon sample and a commercial absorbing material sample, measurements have been performed in order to validate the characterization technique.
I. INTRODUCTION
Numerous methods of obtaining the dielectric properties of materials at microwave frequencies have been proposed in the past. The standard measurement methods are the co-axial probe, transmission line, cavity, free space methods, and so on1-7. Nonetheless, these methods have their advantages and disadvantages depending on the application. Waveguide methods are popular, where the sample is precisely machined to fit inside the waveguide. Both rectangular and coaxial waveguides are used, rectangular samples are easier to produce than coaxial ones, however they can only be used over a limited frequency range. A coaxial waveguide allows for extremely wide-band measurements but the sample preparation is difficult. Free-space techniques8-11 circumvent the problem of the sample fit precision and are nondestructive to the sample. A major disadvantage of the free-space method is that it is not done in an enclosed space, and therefore a greater sample surface needs to be fabricated to avoid diffraction effects around the sample edges.
2
Some reductions of the required sample size for free space microwave measurements have been demonstrated by incorporating spot-focusing horn antennas,8, 12 but this technique is limited in bandwidth due to the focusing nature of the lenses.
As opposed to the classical techniques that use an anechoic chamber, measuring the reflection
coefficient for a material sample in a non-anechoic environment should take into consideration a multipath transmission scenario (including reflection scattering and diffraction on the walls and on other objects encountered)13.
A post processing after the measurement is necessary in order to extract accurately the reflection coefficient of the material sample under test. This is called a "de-embedding" technique14. In literature, most of the characterization methods require a sample of a size much greater than the antenna aperture to be used, as most of the wave front surface should be incident on the material sample8, 15.
For characterizing a material sample with small dimensions and at low frequencies (where the size of the antennas is very important) the classical "de-embedding" method cannot be applied8, 16.
In this paper we propose a method for measuring the reflection coefficient of materials that does not require large material samples and is done in a non-anechoic environment. It is based on combining the "de-embedding" and the average value techniques for several sample distances, resulting in the elimination of unwanted multiple diffractions and reflections for the environment. The material's properties can then be deduced from the reflection coefficient. This coefficient is extracted from the transmission between two antennas through a bistatic reflection method17.
3
II. PROPOSED APPROACH AND MEASUREMENT SETUP
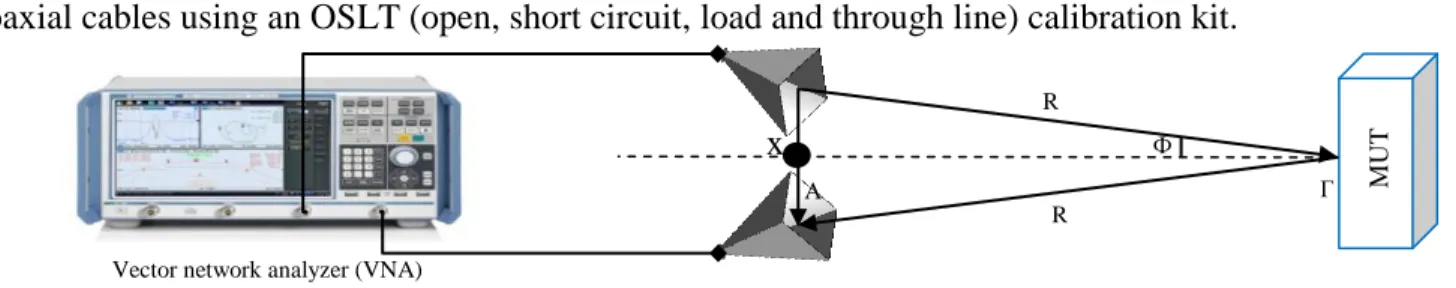
A schematic diagram of the bistatic microwave measurement system is given in Fig. 1. The transmitting and receiving antennas are focusing broadband horn antennas QWH-SL-2-18-N-HG-R18. They are placed side by side and oriented towards a Material Under Test (MUT). A vector network analyzer is used for this type of measurements. The size of the MUT depends on the desired frequency range. At low frequencies we would need large samples and smaller distances between the antennas and the samples in order to eliminate the unwanted reflections. The calibration has been done only for the coaxial cables using an OSLT (open, short circuit, load and through line) calibration kit.
FIG. 1. Measurement configuration with the horn antennas.
Since the antennas are close one to the other the angle between the material sample and the two antennas Ф is close to 00
. Thus, we can do the approximation that the transmission coefficient S21 measured with the VNA corresponds to the reflection coefficient of the MUT but at the reference point X. We need the reflection coefficient at the surface of the material, in Fig.1 referred to as Γ. The parameter S21 can be obtained by calculating the ratio between the reflected electric field over the incident electric field on the MUT of a planar wave at a distance R from the MUT in far field19, 20, such as:
(1)
where A is the mutual coupling between the two antennas and the medium itself, B the amplitude of the incident wave21, k0 the wave number, R the distance between the antennas and the sample and ΓMUT
is the reflection coefficient of the Material.
M UT R Ф A R x Γ
4
The interest is focused on the reflection coefficient of the material, ΓMUT that will be extracted
using equation (4).
A measurement with a metallic plate in front of the antennas that replaces the material sample and another measurement with the antennas alone (without the material sample or the metallic plate) are performed. These two other measurements are necessary in order to establish a reference. For these two cases, the transmission coefficients are:
(2) and
, (3) respectively.
From equations (1) - (3) we can extract the exact reflection coefficient of the MUT using the following formula: (4)
This formula can be considered as the "de-embedding" process.
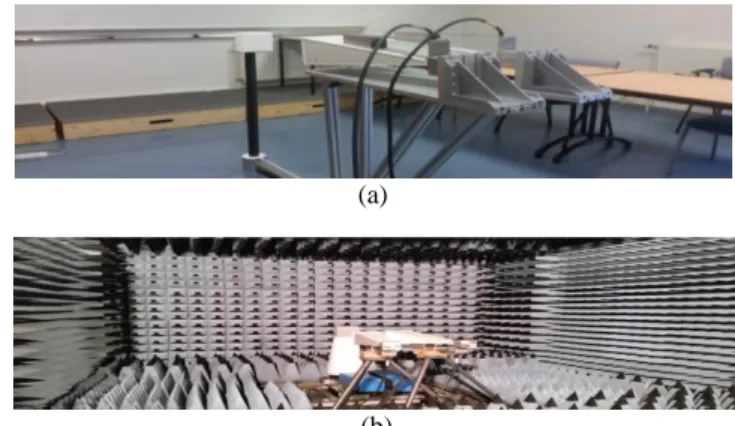
The characterization is performed in the frequency range 2 - 18 GHz in a multipath environment and in an anechoic chamber, respectively. Fig. 2 shows the measuring setup in a non-anechoic environment (Fig. 2(a)), using two horn antennas with an aperture size of 16.5 by 16.5 cm²,18 and the setup used for measuring inside an anechoic chamber (Fig. 2(b)) with the same broadband horn antennas. The measurements in the anechoic environment have been performed only at one distance where the material is placed in the far field (Fraunhofer)region from the antenna which corresponds to 75 cm at the lowest frequency, 2 GHz.
In a multipath environment, an absorbing material sample can be placed between the antennas in order to reduce the mutual coupling between them. The mutual coupling impacts on the accuracy of the
5
measurements, resulting in an incorrect extraction of the phase. Another method to reduce the coupling between the antennas,22 consists in placing the antennas as far as possible one from the other22. The optimal distance between the antennas is 2D2/λ at the lowest frequency. This represents the beginning of the far field region.
(a)
(b)
FIG. 2. Measurement configurations in (a) a multipath environment and (b) in anechoic chamber.
In order to remove any unwanted residual reflections and refractions left after the "de-embedding" process, six different distances Antennas - Material between 75 cm (2D2/λ at 2 GHz is 72.6 cm) and 125 cm were used23. At each distance, four transmission coefficients were measured i.e., for the antennas alone, for a metallic plate, for a material sample, and for a material sample with a metallic plate placed on its back.For each distance we apply the "de-embedding" process7, 16, 19 and we obtain a corresponding reflection coefficient . The average reflection coefficient is then deduced by applying the mean value of all the like this: .
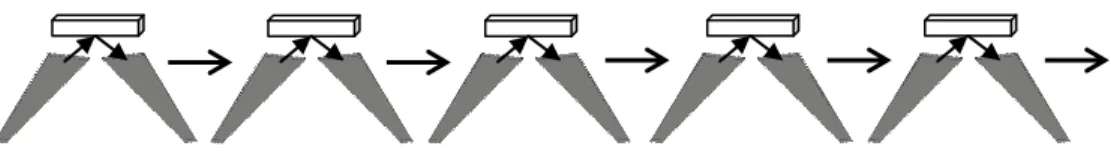
In order to enhance the elimination of the scattering effects of the environment, another technique is applied. In this case, we have moved the measurement configuration to the left and to the right by keeping the same distance between the antennas and the MUT for each distance as shown in Fig. 3. This type of measurement is actually similar to those used for RCS (Radar Cross - Section) measurements and allows reducing the environment's scattering by averaging the mobile echoes24.
6
It is necessary to move the entire measurement setup at least in two positions in order to reduce the effect of the multipath transmissions.
FIG. 3. Reduction of the effect of moving items in a non-anechoic environment: the entire setup is moved but keeping the same distance between the antennas and the sample.
III. RESULTS AND DISCUSSION A. Teflon
In order to validate the characterization method in a multipath environment, a known dielectric material with very low losses (Teflon25 sample) was measured.
Based on the radiation pattern and on the first measurement distance, the optimal thickness, length and width of the sample can be found, in order to reduce the effect of the scattering on its edges for broadband studies.
The optimal thickness of the material sample should be at least λ/4 at the lowest frequency i.e., at 2 GHz.
The distance between the antennas and the sample in far field at 2 GHz is 75 cm. The antennas18
have a -3dB beamwidth of 590 (1.03 radians) at 2 GHz, of at least 11.50 (0.2 radians) at 10 GHz and of 80 (0.14 radians) at 18 GHz, respectively.
The size of the sample can be approximated to the arc length on the wave front. At 10 GHz we have an arc length of 15 cm for the first distance of 75 cm. Since at 2 GHz the size of the sample would have been very big (77.25 cm) and because our technique is used to reduce the effects of the multipath transmission in an ordinary room, we proposed 15 cm for the length and width of the MUT, which is the arc length for the middle frequency, 10 GHz.
7
The final size of the sample is 15cm x 15cm x 6cm (Large x width x height). With this dimensions we proved that the accurate reflection coefficient can be extracted by applying our mean value method on the measurements at different distances.
Theoretically, the Material Under Test, here Teflon, has a permittivity of 2.1 and a loss tangent of 0.0003 at 10 GHz.
Two types of measurements have been done. One using the MUT alone showing that we have transmission through it and another measurement for the MUT backed by a metallic plate. This second measurement has been performed because it gives us the absorption of the material and also because it is necessary for the permittivity extraction method.
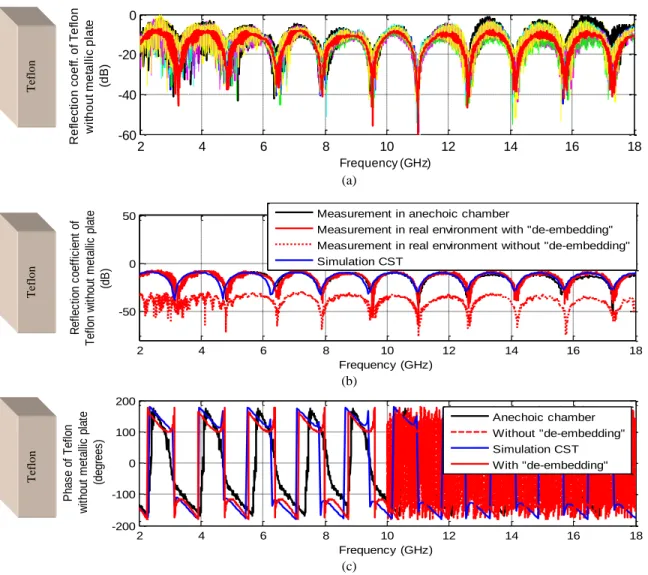
Fig. 4(a) shows the average reflection coefficient obtained from all 30 measurements (6 different antenna-material distances and 5 different displacements of the measurement setup) after applying the "de-embedding" method for the Teflon sample.
Fig. 4(b) shows the reflection coefficient, simulated using 3D CST Microwave Studio and measured for the Teflon sample. We can see that the measured result (dotted red curve) is very different from the one obtained by simulation; when applying the "de-embedding" procedure and the mean value method we can extract an exact result (solid red curve) similar to the simulation and to the measurement in the anechoic chamber.
The phase measured in the multipath environment without "de-embedding" is represented from 10 GHz and is fluctuating dramatically (Fig. 4(c)) over the entire frequency range and therefore it cannot be compared with the theoretical phase. The only reason to depict the phase variation in Fig. 4(c) was to better understand why the "de-embedding" procedure and the mean value are so important for the determination of the correct reflection coefficient of a material. The phase extracted from the same
8
measurement, after the "de-embedding" and applying the average value is confirmed correct by comparison with the measurement in the anechoic chamber as well as from simulation. (see Fig. 4(c)).
(a)
(b)
(c)
FIG. 4. Measurement and simulation results of the reflection coefficient (a) mean value in red and the superposition of all measurements (b) magnitude and (c) phase for a Teflon sample.
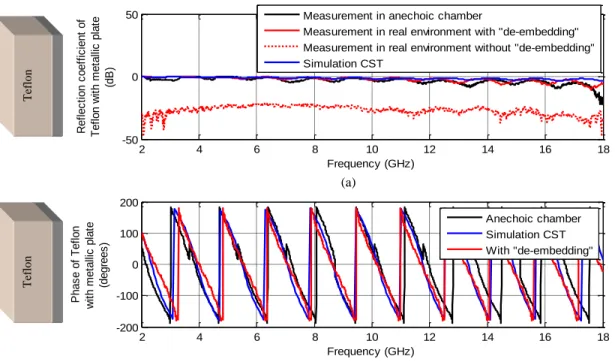
Now, we consider the Teflon sample backed by a metallic plate (Fig. 5). Fig. 5(a) compares the average values of the reflection coefficient obtained in the real environment with and without "de-embedding", with the results obtained in an anechoic chamber and with the CST simulation results.
The phase measured without "de-embedding" and without averaging has the same variation as the one shown in Fig. 4(c). The phase extracted by applying the "de-embedding" and by averaging the
2 4 6 8 10 12 14 16 18 -60 -40 -20 0 Frequency (GHz) R e fl e c ti o n c o e ff . o f T e fl o n w it h o u t me ta ll ic p la te (d B) 2 4 6 8 10 12 14 16 18 -50 0 50 Frequency (GHz) R e fl e c ti o n c o e ff ic ie n t o f Te fl o n w it h o u t m e ta lli c p la te (d B )
Measurement in anechoic chamber
Measurement in real environment with "de-embedding" Measurement in real environment without "de-embedding" Simulation CST 2 4 6 8 10 12 14 16 18 -200 -100 0 100 200 Frequency (GHz) P h a s e o f Te fl o n w it h o u t m e ta lli c p la te ( d e g re e s ) Anechoic chamber Without "de-embedding" Simulation CST With "de-embedding" Te fl o n Te fl o n Te fl o n
9
measured results in a multipath environment is close to that obtained in the anechoic chamber and to the simulation as can be seen in Fig. 5(b).
(a)
(b)
FIG. 5. Measurement and simulation results of the reflection coefficient (a) magnitude and (b) phase for a Teflon sample backed with a metallic plate.
B. Absorbing material
We have also measured a commercial absorbing material named ECCOSORB LS 2226. This
material is a polyurethane foam loaded with carbon powder. From the material characteristics26, we can note that for the frequency range 2 GHz to 18 GHz, the permittivity is varying from 2.6 to 1.4 and the loss tangent is decreasing from 1.8 to 0.6. A sample with a size of 15 cm x 15 cm x 5 cm was characterized.
As before, we measured at several distances four transmission coefficients: with the antennas alone, with a metallic plate, with a material sample, and with a material sample backed with a metallic plate. We extracted from the measured data all the reflection coefficients and the real part of the permittivity for our material.
2 4 6 8 10 12 14 16 18 -50 0 50 Frequency (GHz) R e fl e c ti o n c o e ff ic ie n t o f Te fl o n w it h m e ta lli c p la te (d B )
Measurement in anechoic chamber
Measurement in real environment with "de-embedding" Measurement in real environment without "de-embedding" Simulation CST 2 4 6 8 10 12 14 16 18 -200 -100 0 100 200 Frequency (GHz) P h a s e o f Te fl o n w it h m e ta lli c p la te (d e g re e s ) Anechoic chamber Simulation CST With "de-embedding" Te fl o n Te fl o n
10
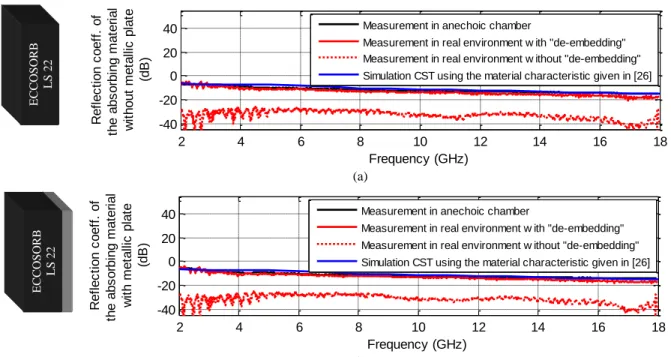
In Fig. 6(a) we compared the simulation results with the measurement results in the anechoic chamber and in the non-anechoic environment for the absorbing material alone.
(a)
(b)
FIG. 6. Measured and simulated results for the reflection coefficient of (a) ECCOSORB LS 22 without a metallic plate and (b) ECCOSORB LS 22 backed with a metallic plate.
The results from the measurement are close to those achieved from simulation. By measuring the reflection coefficient of the material sample backed by the metallic plate, (Fig. 6(b)) we can find the absorption coefficient and assess whether or not the material can be considered lossy. Nevertheless, we could have an idea on how high the losses are by using an optimization algorithm under CST for the reflection coefficient obtained by measurement. We applied the technique described by Fenner et al.6 to extract the real part of the permittivity from measurement. For the simulation we use this real part of the permittivity and proposed an initial value for the imaginary part of the permittivity that is optimized in CST Microwave Studio. Thus, the optimization finds an imaginary part of the permittivity that gives us the complex εr used to determinate the reflection coefficient simulated that is as close as possible with the measurement results.
2 4 6 8 10 12 14 16 18 -40 -20 0 20 40 Frequency (GHz) R e fl e c ti o n c o e ff . o f th e a b s o rb in g m a te ri a l w it h o u t m e ta lli c p la te ( d B )
Measurement in anechoic chamber
Measurement in real environment w ith "de-embedding" Measurement in real environment w ithout "de-embedding" Simulation CST using the material characteristic given in [26]
2 4 6 8 10 12 14 16 18 -40 -20 0 20 40 Frequency (GHz) R e fl e c ti o n c o e ff . o f th e a b s o rb in g m a te ri a l w it h m e ta lli c p la te ( d B )
Measurement in anechoic chamber
Measurement in real environment w ith "de-embedding" Measurement in real environment w ithout "de-embedding" Simulation CST using the material characteristic given in [26]
EC C O S O R B LS 2 2 EC C O S O R B LS 2 2
11 C. Permittivity extraction
The method used for extracting the permittivity is that described by Fenner et al.6, 27. The
equations used are shown below:
- TE polarization (5)
(6)
(7)
(8)
where Z2 is the transverse impedance and ZA and ZB are the wave impedances of the material
sample, respectively backed by the metallic plate (MUT - MP) and alone (MUT). Since the measurements have been done in free space, the wave impedance is Z0 = 377 Ω.
Our materials used are non-magnetic, thus the permeability is μ = μ0. This method uses the
impedance for the extraction of the material's properties. The phase reference for this technique has to be at the front surface of the material, this is why the "de-embedding" process is very important. Because we have used a bistatic technique the angle of incidence Ф is 6.310 for a distance of 75 cm between the antennas and the material and gets smaller the further we go in far field.
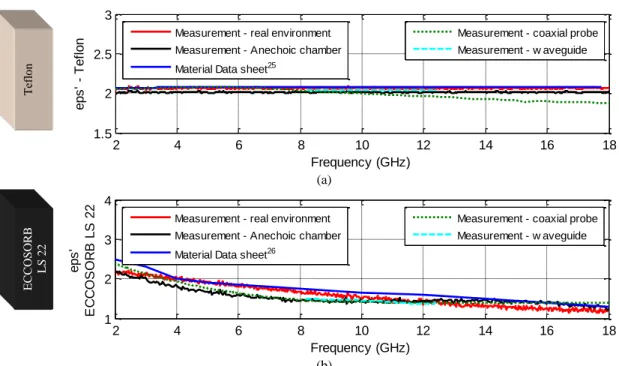
Fig. 7 shows the real part of permittivity for a Teflon sample and for the absorbing material, extracted from the measurements in the frequency range 2-18 GHz. For the Teflon sample (Fig. 7(a)) the mean value for the permittivity in this frequency range is 2.06. This result is comparable to the theoretical value (obtained by applying (5) - (8) on the reflection coefficients obtained from simulation) and to the result obtained from the measurement in the anechoic chamber. Note that in CST we used a permittivity of ɛ’ = 2.1 at 10 GHz. In CST we are considering an ideal environment with no outside interference and simulate using the sample block as an infinite structure having the same thickness as in
12 the measurement.
Moreover, in Fig. 7(a) we have presented measured results in the X band for a Teflon sample in a waveguide. This result obtained using the Nicolson - Ross - Weir method28, 29 is close to that obtained in a multipath environment, to the theoretical value in CST, coaxial probe measurement30 and anechoic chamber.
(a)
(b)
FIG. 7. Permittivity of (a) Teflon and (b) ECCOSORB LS 22 loaded with carbon powder.
Fig. 7(b) presents the measured results for the real part of the permittivity of the loaded polyurethane foam ECCOSORB LS 22. The result obtained in a multipath environment is very close to the value given by the fabricant. The results obtained in a waveguide, coaxial probe and anechoic chamber confirm also the exactitude of our method in a real environment.
CONCLUSION
We have developed a method for material characterization in a multipath environment. The proposed measured method does not require an anechoic chamber and allows the extraction of the material's complex reflection coefficient and real part of the permittivity. Thus, measurements can be
2 4 6 8 10 12 14 16 18 1.5 2 2.5 3 Frequency (GHz) e p s ' - Te fl o
n Measurement - real environment
Measurement - Anechoic chamber Material Data sheet25
Measurement - coaxial probe Measurement - w aveguide 2 4 6 8 10 12 14 16 18 1 2 3 4 Frequency (GHz) e p s ' E C C O S O R B L S 2 2
Measurement - real environment Measurement - Anechoic chamber
Material Data sheet26
Measurement - coaxial probe Measurement - w aveguide EC C O S O R B LS 2 2 Te fl o n
13
performed into an ordinary room, by using the distance averaging method, in order to reduce the effects of the multipath propagation. The reflection coefficient that we found for a Teflon sample or a lossy material commercial sample is close to the simulated one, as well as to the reflection coefficient measured in an anechoic chamber. By using this parameter, the real part of the permittivity was obtained. This value is close to the theoretical value and to that obtained in waveguide and anechoic chamber.
ACKNOWLEDGMENTS
The authors would like to thank the Direction Générale de l'Armement (DGA) for its financial support.
1
L. F. Chen, C. K. Ong, C. P. Neo, V. V. Varadan, V. K. Varadan, in Microwave Electronics: Measurement and Materials Characterization, pp.37-134, England, Wiley (2004).
2
F. Fiorillo in Metrologia 47, pp. 114-142, IOP Publishing, March (2010). 3
J. Baker-Jarvis, M. D. Janezic, B. F. Riddle, R. T. Johnk, P. Kabos, C. L. Holloway, R. G. Geyer, C. A. Grosvenor, , NIST Technical Note 1536 (2005).
4
Application Note, "Basics of measuring the dielectric properties of materials", Agilent Literature Number 5989-2589EN (2006), see http://cp.literature.agilent.com/litweb/pdf/5989-2589EN.pdf.
5
H. E. Bussey, Proceeding of the IEEE 55, 1046 (1967). 6
R. A. Fenner, E. J. Rothwell, L. L. Frasch, Radio Science 47 (2015). 7
J. Y. Chung, Dissertation thesis, Ohio State University, USA (2010). 8
N. Gagnon, J. Shaker, P. Berini, L. Roy, A. Petosa, IEEE Transactions on Instrumentation and Measurement 52, 333 (2003).
9
14
Impedance Analyzers", Agilent Literature Number 5980-2862EN, see http://cp.literature.agilent.com/litweb/pdf/5980-2862EN.pdf.
10
J. W. Schultz, S. P. Blaloch, E. J. Hopkins, Georgia Tech Research Institute, Atlanta, USA. 11
I. Zivkovic, A. Murk, Progress In Electromagnetics Research B 33, 277 (2011). 12
A. Brancaccio, G. D. Alerio, E. De Stefano,L. Di Guida, M. Feo, S. Luce, IEEE Metrology for Aerospace, 423 (2014).
13
J. Baker-Jarvis, E. J. Vanzura, W. A. Kissick, IEEE Transactions on Microwave Theory and Techniques 38, 1096 (1990).
14
F. H. Wee, P. J. Soh, A. H. M. Suhaizal, H. Nornikman, A. A. M. Ezanuddin in International Microwave and Optoelectronics Conference, SBMO/IEEE MTT-S International, pp. 183-187 (2009). 15
D. Ghodgaonkar, V. Varadan, Instrumentation and Measurement, IEEE Transactions 39, 38 (1990). 16
G. W. Hanson, J. Grimm, D. Nyquist, Instrumentation and Measurement, IEEE Transactions 42, 740 (1993).
17
M. H. Umari, D. K. Ghodgaonkar, V. V. Varadan, V. K. Varadan, IEEE Transaction on Instrumentation and Measurement 40, 19 (1991).
18
See http://www.steatiteqpar-antennas.co.uk/products/horn-antennas.html for more information about the broadband horn antennas; (last accessed December 22, 2015).
19
C. A. Balanis, Antenna Theory Analysis and Design Third Edition, pp. 28-96 (2005). 20
C. A. Balanis, Advanced Engineering Electromagnetics, pp. 182-207 (1989). 21
H. Xu, E. Kasper in Silicon Monolithic Integrated Circuits in RF Systems, New Orleans, Los Angeles, pp. 37 - 40 (2010).
22
J. W. Schultz in Focused beam methods: Measuring microwave materials in free space, pp. 36-41, Atlanta, USA (2012).
23
15 (2014).
24
R. B. Dybdal, IEEE journals and magazines 75, 498 (1987). 25
See http://www.approflon.com/en/telechargement-fiches-techniques/ for more information about the Teflon sample; (last accessed April 5, 2016).
26
See http://www.eccosorb.com/products-eccosorb-ls.htm for more information about the polyurethane absorber ECCOSORB LS 22; (last accessed Mars 24, 2016).
27
J. Krupka, Measurement Science and Technology 17, R55 (2006). 28
A. M. Nicolson, G. F. Ross, IEEE Transactions on Instrumentation and Measurement 19, 377 (1970). 29
W. B. Weir, Proceedings of the IEEE 62, 33 (1974). 30
See http://www.keysight.com/en/pd-304506-pn-85070E/dielectric-probe-kit for more information about the coaxial probe used; (last accessed April 5, 2016).