HAL Id: hal-00845463
https://hal.archives-ouvertes.fr/hal-00845463
Submitted on 17 Jul 2013
HAL is a multi-disciplinary open access
archive for the deposit and dissemination of
sci-entific research documents, whether they are
pub-lished or not. The documents may come from
teaching and research institutions in France or
L’archive ouverte pluridisciplinaire HAL, est
destinée au dépôt et à la diffusion de documents
scientifiques de niveau recherche, publiés ou non,
émanant des établissements d’enseignement et de
recherche français ou étrangers, des laboratoires
Real-time suppression of turbidity of biological tissues in
motion by three-wave mixing phase-conjugation
Fabrice Devaux, Éric Lantz
To cite this version:
Fabrice Devaux, Éric Lantz. Real-time suppression of turbidity of biological tissues in motion by
three-wave mixing phase-conjugation. Journal of Biomedical Optics, Society of Photo-optical
Instru-mentation Engineers, 2013, 18, pp.111405. �hal-00845463�
Real time suppression of turbidity of biological tissues in
motion by three-wave mixing phase conjugation
Fabrice Devaux and Eric Lantz
Institut FEMTO-ST, D´epartement d’Optique P. M. Duffieux, UMR 6174 CNRS
Universit´e de Franche-Comt´e - 16 route de Gray, 25030 Besan¸con - France
ABSTRACT
We show that phase conjugation by three-wave mixing allows turbidity suppression through biological tissues with thicknesses up to 5 mm, at a near infrared wavelength included in the therapeutic window. Because of the ultra-fast character of the imaging process, a motion of the tissue, that mimics in vivo imaging, can be exploited to improve significantly the signal to noise ratio and the resolution of the restored images.
(190.4410) Nonlinear optics, parametric processes (190.5040) Phase conjugation (100.3200) Inverse scattering.
1. INTRODUCTION
Biological media scatter and diffuse light, with negligible absorption at red and near infra-red wavelengths in the optical therapeutic window. Until the 90’s, optical imaging in these media was performed with two distinct groups of methods. First, coherent methods, like optical coherence tomography [1], used ballistic light, i.e light scattered one time at most. These coherent methods are limited to depths smaller than two millimeters, because for greater depths all light is multiply scattered and no interferometric signal remains for image reconstruction. Second, for thicker tissues various incoherent methods were developed which use the scattered light, like diffuse imaging, i.e. reconstruction by computation from diffused waves [2], time gating to isolate the less diffused photons [3], acousto-optic methods [4,5,6] and imaging by two-photon absorbtion [7].
In recent years, this distinction has vanished by considering scattering in a static medium as a deterministic phenomenon that can be reversed. It was demonstrated 40 years ago [8] that a wave scattered by a ground glass slide can be recovered and restored to its initial state by applying optical phase conjugation and back propagation through the same slide. A recent experiment by Yaqoob et al. showed that such a scheme can also be applied to a biological medium [9], though not in vivo. An image transmitted through chicken breast was recorded as
Further author information: (Send correspondence to F. Devaux)
a hologram in a photorefractive crystal, and then restored by back propagation of the phase-conjugated wave through the same biological medium. Since the position of the scatterers did not change between forward and backward propagation, the image resolution was preserved. Because of the strong absorption of the 532 nm wavelength used in the experiments, the thickness was limited to 0.7 mm, and the acquisition time in the minute range did not allow studying in vivo biological media, which typically have a decorrelation time of 0.1 ms [10]. In later experiments, a collimated beam (no image) was reconstructed either through 7 mm of the thickness of the chicken breast [11] or the ear of a living rabbit [12]. More recent works proposed schemes of time reversal of ultrasound-encoded light, which combine optical phase conjugation with ultrasound encoding. In such devices, the phase conjugation process is ensured either by a spatial light modulator [13] or by a gain medium [14].
Several years ago, we showed that non linear χ(2) imaging by three-wave mixing (i.e. optical parametric
amplification of images) allows instantaneous phase-conjugation of a near-infrared image and its restoration when the image is distorted by an aberrant plate [15]. This method is one of the numerous methods that allows the ultrafast suppression of image distortions by phase conjugation, for example through a clear plastic using a hybrid amorphous silicon/ferroelectric-liquid-crystal device [16], through turbulent atmosphere using sodium vapor [17], or through textured plastic sheets using stimulated Brillouin scattering [18]. In all these experiments, the distorting medium was transparent and our own experiments with such a type of medium (aberrant glass plate) showed that depolarization of light is negligible even in situations where direct imaging is impossible.
In this paper, we make use of three-wave mixing phase-conjugation (TWMPC) to recover infrared images transmitted through biological tissues with thicknesses up to 5 mm. We propose to take advantage of a motion of the diffusing medium to improve significantly the signal to noise ratio and the resolution of the restored images, because of the almost instantaneous character of the non linear process. Moreover, we show that the strong depolarization of light due to the scattering process does not prevent image restoration.
2. EXPERIMENTAL RESULTS
2.1 Principle and experimental setup
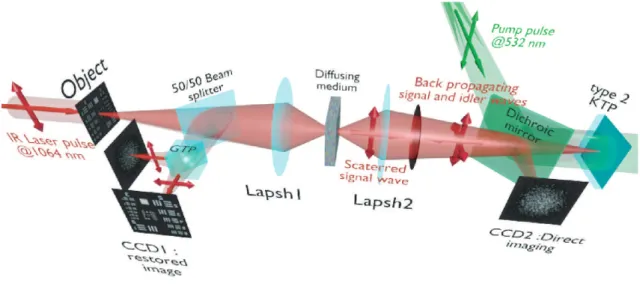
The experimental setup is depicted in fig. 1. The signal pulses at λs = 1.064 µm are delivered by a partially
frequency-doubled Q-switched mode-locked Nd:YAG laser (PL2250 Series from EKSPLA). The nearly T EM00
infrared (IR) pulses have a 20 ps duration (FWHM), a time-bandwidth product close to 1 and a 10 Hz repetition rate. The pump pulses at λp=λ2s = 0.532 µm are provided by partial frequency-doubling of the IR radiation in a
Potassium Dihydrogen Phosphate crystal (KDP). The remaining infrared light is separated from the green light by a dichroic mirror and then attenuated and vertically polarized. The infrared pulses illuminate a resolution
Figure 1. Experimental setup.
target, whose the image is formed inside the diffusing medium (biological tissues or translucent adhesive ribbon) with a magnification of 1/20 by means of an aspherical lens with a focal lens of 8 mm and a numerical aperture of 0.5. During the imaging process, the diffusing medium can be moved either in the transverse plane or along the propagation axis. The output scattered light is then collected with a second identical aspherical lens that conjugates the image plane of the first lens with the input face of the non linear crystal. The total magnification of the imaging system between the object and the crystal is close to 1. The 5 × 5mm2 wide and 2.5mm long
potassium Titanyl Phosphate (KTP) crystal from Cristal Laser SA is cut for degenerate type 2 collinear phase-matching [19] and its 20 mrad phase-phase-matching angular range is adapted to the numerical aperture of the imaging system. The neutral axes of the crystal are oriented respectively along the vertical and the horizontal direction. The pump pulse reflected by a dichroic mirror is mixed with the IR scattered signal wave in the KTP crystal. A small amount of the scattered light reflected by the dichroic mirror is used to observe directly the light transmitted through the diffusing medium. Direct imaging through the diffusing medium is performed with a CCD camera (CCD2) placed in the image plane of the second aspherical lens.
In a degenerate three-wave-mixing interaction, the idler wave is generated at the same wavelength as the signal and with a transverse wave-vector opposite to that of the signal (Fig. 2a), giving forward phase conjugation [19](Fig. 2b). In this work, like in reference [15], the idler wave is back reflected by the coated exit face of the crystal (high reflection coating at 1.064 µm), resulting in reversing the longitudinal component of the idler wave vector that leads to full phase conjugation (Fig. 2c). The reflected waves (amplified signal and idler) back-propagate towards the diffusing medium. The phase conjugated (PC) image is formed by the idler wave at a symmetric position of the object with respect to the 50/50 beam-splitter and recorded on a low noise CCD
(a)
(b)
k
pk
sk
i(c)
Figure 2. (a) k-wavevector diagram for non colinear three-wave-mixing. (b) Principle of forward TWMPC imaging. (c) full phase conjugation by three-wave-mixing. The horizontal and vertical arrows represent the crossed polarization directions of the signal and idler waves in a type 2 interaction. For the sake of clarity, the pump plane wave is not represented.
camera (CCD1 : Spec-10 400B from Princeton Instruments). A Glan-Taylor polarizer placed in front of CCD1 rejects the vertically polarized distorted signal wave and transmits the horizontally polarized idler wave carrying the PC image. We assume here that the PC image keeps its horizontal polarization while back-propagating in the diffusing medium. This not trivial issue will be discussed in the next section. The signal amplification gain
Gs, defined as the ratio between the signal pulse energies with and without amplification, has been measured,
giving a value close to 2. Because the added power on the signal is, for identical signal-idler wavelengths, equal to the generated idler energy, the gain of phase conjugation GP C, defined as the ratio between the incident signal
energy and the energy of the phase conjugated wave, is given by GP C = (Gs− 1).
2.2 Diffusing media
In these experiments, two kinds of diffusing media are studied. The first one consists in a translucent adhesive ribbon fixed on a 1 mm thick microscope slide. The value of the ribbon thickness is a few decades of microns and the light traversing the rough surface evolves in a fully developed speckle. From measurements of the size of the speckle halo, the mean size of the diffusing grains is estimated to 1 µm. The degree of polarization of the scattered light is given by the ratio Ik
I⊥ where Ik and I⊥ are respectively the energies of the scattered light,
measured in the parallel and orthogonal polarization directions with respect to the polarization direction of the incident light. A ratio of 385 ± 35 is measured while this ratio is 500 through the clean microscope slide. 35% of loss due to scattering is also measured by comparing the energies transmitted through the imaging system with and without the diffusing medium. These results indicate that, with this kind of medium, most of the light
(a) (b) (c)
(d) (e) (f)
Figure 3. Results of direct imaging results through different media : (a) the clean microscope slide. (b and c) one layer of translucent adhesive ribbon when the image of the object is formed on the diffusing medium and when the diffusing medium is placed before the image plane, respectively. (d) two layers of adhesive ribbon on both faces of the microscope slide. (e and f) biological tissues : 0.7 mm thick Parma ham slice and 5 mm thick chicken breast, respectively.
is scattered in the forward direction and the scattering process is almost polarization independent. With such a thin scattering medium, direct imaging is possible with a good signal to noise ratio (SNR) when the object is imaged at the surface of the diffusing medium (Fig. 3b), because of the so-called shower curtain effect [20]. A SNR close to 2 is deduced from the peak value of the normalized covariance function covmax [21] between
the image obtained through the clean microscope slide (Fig. 3a) and the image obtained through the diffusing medium (Fig. 3b) such as :
SN R = covmax
1 − covmax (1)
In the direct imaging configuration, the image resolution is limited by the size of the speckle grains. When the diffusing medium is placed before or after the image plane, the image of the object is completely blurred and the object can no more be recognized (Fig. 3c). For the sake of comparison, a second layer of adhesive ribbon was fixed on the other face of the microscope slide. In this case, direct imaging is impossible even when the object is imaged on the first adhesive ribbon layer (Fig. 3d) and whatever the position of the image plane with respect to the diffusing medium.
The second kind of diffusing media that we studied consists in two different biological tissues. The first one is formed with slices of Parma ham with thicknesses from 0.7 to 2.1 mm and the second one is a 5 mm thick piece of chicken breast. The tissues are maintained between two microscope slides. With a standard scattering coefficient µs = 100 cm−1 and an anisotropy coefficient g = 0.9, the reduced scattering coefficient is µ0
scattering mean free paths (mf p0), lie in the range 0.7 to 5 mf p0. As well as for the translucent adhesive ribbon,
we measured the degree of polarization and losses through the two kinds of biological tissues. Average degrees of polarization of 20, 10 and 2, losses of 50%, 90% and 97% have been measured, respectively for 0.7 and 2.1 mm thick slices of Parma ham and a 5 mm thick piece of chicken breast. It should be stressed that the studied biological tissues (consisting of muscle fibers and fats) are very inhomogeneous. Therefore, these measurements fluctuate with large amplitudes depending on the area crossed by the light. Finally, we verified that direct imaging is impossible through biological tissues (Fig. 3 e and f) whatever the position of the diffusing medium with respect to the intermediate image plane.
2.3 Image restoration by three-wave mixing phase conjugation
In this section we present the results of image restoration by backward propagation of the phase conjugated idler wave through diffusing media. We have investigates the resolution limits in restored images as well as the consequences of a motion of the diffusing medium motion during the acquisition time. Fig. 4a shows the limits of
0.2 0.4 0.6 0.8 (a) (b) (c) (d) (e) covmax=0.85
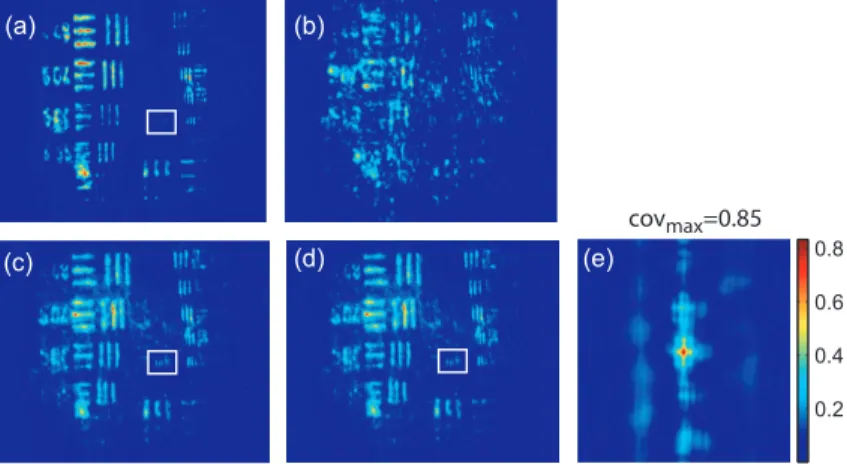
Figure 4. Resolution limits through translucent adhesive ribbon. (a) PC image through the clean microscope slide , (b) PC image through a static single layer of translucent adhesive ribbon. PC images when the diffusing medium is moved (c) along the transversal axis (Y) and (d) along the propagation axis (Z) during the acquisition time. White rectangles
surround the 16 mm−1 lines group. (e) Normalized covariance between PC images (a) and (d).
resolution in images formed by the backward phase conjugated wave propagating through the clean microscope slide. In this image, the line group 16 mm−1 of the USAF resolution chart is resolved. Since the magnification
of the imaging system between the object and the type 2 KTP crystal is close to 1, it corresponds also to a resolution of 16 mm−1 in the crystal, which is in good agreement with the theoretical resolution given by the
phase matching conditions [22]. Fig. 4b shows the PC image obtained through one static layer of translucent adhesive ribbon positioned such as direct imaging is impossible. In the restored image, the resolution and the SNR are seriously degraded by the speckle noise. The 5.04 mm−1 line group can be recognized and a SNR equal
to 2 is measured. Because with a static diffusing medium, the speckle noise patterns are strongly correlated from one laser shot to another, the SNR in PC images can be seriously improved if the diffusing medium moves during the acquisition time. Indeed, in this case, uncorrelated speckle noise patterns are summed by the CCD1 during the acquisition time. This speckle averaging reduces the noise fluctuations and therefore improves the SNR of the PC images. In these experiments the acquisition time is 1 s, corresponding to the acquisition of 10 laser shots. Fig. 4c and d clearly show the SNR and resolution improvement when the diffusing medium is moving. These figures correspond to the PC images obtained when respectively the medium is moved along the transversal axis (Y) and along the propagation axis (Z). In both cases, the diffusing medium is translated with an amplitude of ±50 µm around its initial position during the exposure time of CCD1. In PC images, the 16 mm−1 line group of the USAF resolution chart is now resolved and a SNR equal to 4 is deduced from the
normalized covariance function (Fig. 4e) calculated between images 4a and 4d.
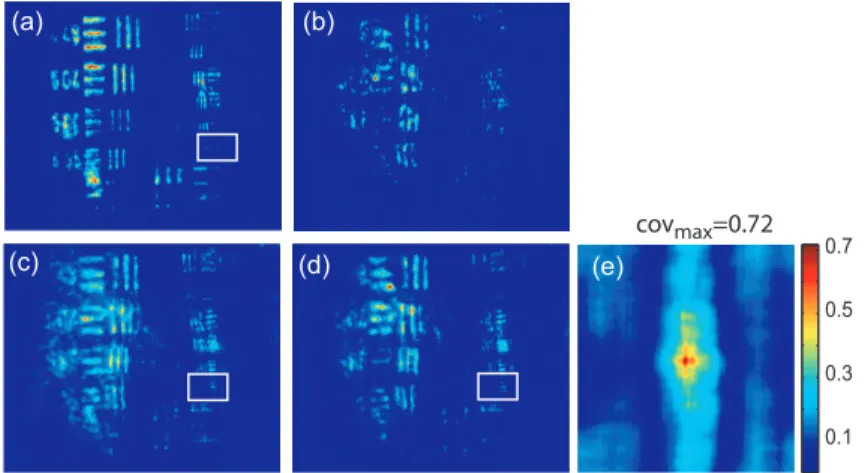
0.1 0.3 0.5 0.7 (a) (b) (e) (d) (c) covmax=0.72
Figure 5. Resolution limits through 0.7 mm thick Parma ham slice : (a) PC image through the clean microscope slide, (b) PC image through static biological tissue. PC images when biological tissue is moved (c) along the transversal axis
(Y) and (d) along the propagation axis (Z) during the acquisition time. White rectangles surround the 14.24 mm−1 lines
group. (e) : normalized covariance between PC images (a) and (d)
The same experiments were performed with a 0.7 mm thick biological tissue. Fig. 5 shows these results with a static medium and a medium in motion. Although the biological tissue is much thicker than the translucent adhesive ribbon, similar performances are obtained : the 14.24 mm−1lines group is resolved and a SNR equal to
2.6 is measured. We would like to stress that in the intermediate image plane, the resolution is 285 mm−1
accord-ing to the 1/20 magnification of the first aspherical lens. Moreover, surprisaccord-ingly, we observed that the restored image is linearly polarized in a crossed polarization direction with respect to the incident signal polarization direction. It shows that the process of image restoration by TWMPC does not require that the back-propagating phase conjugated wave has the same polarization state as the scattered signal wave emerging from the scattering
medium. This particular point will be discussed in section 3.
(a)
(c)
(g)
(d)
(h)
(e)
(i)
PC images through static media(b)
(j)
(f)
PC images through moving media PC images through clean slideScattering medium thickness increasing
Figure 6. Image restoration through 0.7 to 5 mm thick biological tissues. (a) and (b) reference PC images of 1.41 mm−1
and 2.83 mm−1 lines group of the USAF obtained through the clean microscope slide. (c to f) respectively PC images
obtained through static biological media with 0.7, 1.4 and 2.1 mm thicknesses (Parma ham) and 5 mm thickness (piece of chicken breast). (g to j) PC images obtained through the same biological tissues moving along Y axis.
The last experiment consists in image restoration through biological tissues with different thicknesses. Re-spectively 0.7, 1.4 and 2.1 mm thick Parma ham slices and a 5 mm thick piece of chicken breast were used. Fig. 6 shows the PC images of the 1.41 mm−1 and 2.83 mm−1 line group of the USAF target obtained through the
Parma ham and chicken breast samples, respectively. Fig. 6a and b correspond to the PC images of the two line groups obtained through the clean microscope slide. Fig. 6c to f correspond respectively to the PC images obtained through static biological tissues with increasing thicknesses. Because the PC images are seriously de-graded by the speckle noise, the initial object is more and more difficult to recognize when the thickness of the biological tissue increases. When biological tissues are moved during the acquisition time of CCD1, the SNR of PC images is improved significantly like in previous experiments (Fig. 6g to j). While motion of biological media seriously improves the resolution of PC images, the SNR clearly decreases when the thickness of the biological tissues increases. Indeed,losses also increase with the thickness. Thus the phase conjugate image is progressively drowned in the background noise, mainly because of the back scattered light. Experimentally, increased losses are compensated partially by increasing the amplification gain of the non linear TWM process (i.e. by increasing the pump pulse energy).
3. DISCUSSION
In section 2.2 we report measurements of the degree of polarization of the scattered light by the different media. We show that, unlike for a thin diffusing medium, the light transmitted through biological tissues is strongly depolarized. As it is explained in section 2.1, in a type 2 TWM interaction the signal wave is usually polarized along one neutral axis of the non linear birefringent crystal (for example the ordinary polarization direction). Because of the type 2 phase matching conditions, the generated idler wave is polarized in the crossed direction (i.e. the extraordinary polarization direction). Then in our experiment a Glan-Taylor polarizer placed in front the CCD1 allows detection of the idler wave carrying PC images and rejects the signal wave. When the scattering process is more or less polarization independent like through a translucent adhesive ribbon, image restoration can be obtained with a phase conjugated wave with an another polarization direction than that of scattered light. Through biological tissues where light is strongly depolarized, we clearly observed that restored images carried by the PC idler wave are linearly polarized in a perpendicular direction with respect to the polarization direction of the incident signal light.
This surprising result can be explained using the scattering model of a plane wave light by a dielectric sphere [23]. In our model, we have chosen dielectric spheres in water with a refractive index of 1.588 at 1.064 µm and a diameter of 1.4 µm, such that the anisotropy coefficient g given by the Mie theory[23] is equal to 0.91. With this model, (−→Eksc,−→E⊥sc), the electric field components of the scattered light expressed in the parallel and perpendicular directions of the scattering plane, can be calculated for every scattering direction. The scattering directions are characterized by the usual polar angles (θ, φ), where the angle θ is randomly calculated with a probability distribution deduced from the Henvey-Greenstein phase function [24] and the angle φ is randomly selected in the range [0 − 2π] rad with a uniform probability distribution. Only the output scattered fields with propagation directions included in the numerical aperture of 0.5 of our imaging system, which is limited by the phase matching angular acceptance of the non linear crystal, are phase conjugated. The proportion of realizations that do not fit this criterion gives approximately the losses due to scattering in our model. Fig. 7a shows typical scattering paths for a set of 20 realizations when 5 scattering events are considered.
After one or several scattering events, the output scattered field−→Esc(Fig. 7a) is calculated in the (−→ex, −→ey)
basis (corresponding to the neutral axes of the non linear crystal) and is phase conjugated following the coupled-waves equations of type 2 TWM interaction:
EP Cx ∝ −iE ∗ scy EP Cy ∝ −iE ∗ scx . (2)
5 scattering events 10 scattering events
z
x
y
kincE
inc kscE
scE
sc //(a)
(c)
(d)
Q U V LVP HVP L+45 RCP LCP L- 45*
Incident field Output scattered field Back scattered PC field1 scattering event
(b)
*
*
*
Figure 7. (a) Typical scattering paths when 5 scattering events are considered. (b to d) Representations of the normalized Stokes parameters [Q, U, V ] on the Poincar´e sphere of the output scattered fields (yellow stars) and the back-scattered phase conjugated fields (red crosses) when 1, 5 or 10 scattering events are considered. The black star denotes the vertical polarization state of the incident light.
mirror (PCM) of constant reflectivity for all input directions and polarizations to capture the entire scattered wavefront. In practice, such a mirror is difficult to achieve and often only a small portion of the wavefront of a single polarization can be captured and time reversed like with PCM based on four wave-mixing processes. Therefore, we would like to emphasize that with type 2 TWMPC all polarization directions are phase conjugated. The polarization state of light at each step of the process is characterized by its Stokes parameters [I, Q, U, V ] that can be positioned on the Poincar´e sphere. Fig. 7b-d depict the polarization state of the output scattered fields (yellow stars) and the back-scattered phase conjugated fields (red crosses) when 1, 5 or 10 scattering events
Number of scattering events Losses in % Q U V 1 10 −1.000 ± 0.001 0.00 ± 0.02 0.00 ± 0.03
5 60 −1.00 ± 0.09 0.0 ± 0.3 0.0 ± 0.2
10 80 −0.9 ± 0.2 0.0 ± 0.4 0.0 ± 0.4
Table 1. Losses and mean values of the normalized Stokes parameters [Q, U, V ] of the back scattering phase conjugated fields for 1, 5 and 10 scattering events. Calculation are made with sets of 500 realizations.
are considered. The incident light is here vertically polarized. Each yellow star and red cross correspond to one realization. With this model, Fig. 7b-d show that the polarization directions of the back-propagating PC waves that retrace the scattering path are more or less horizontally polarized, i.e. in a direction perpendicular to the initial polarization direction of the incident light. When the number of scattering events increases, the dispersion of the polarization states of the PC fields around the horizontal polarization direction increases as well as losses estimated by the proportion of realizations that do not fit the criterion related to the numerical aperture of the imaging system. Hence, the realizations that fit this numerical aperture correspond also to nearly horizontally polarized light. Table 1 summarizes the losses and the mean values of the normalized Stokes parameters [Q, U, V ] of the back scattering phase conjugated fields calculated for 1, 5 and 10 scattering events with sets of 500 realizations.
Although biological tissues are more complex media than dielectric spheres, this demonstration is consistent with our experimental observations.
4. CONCLUSION
We have developed an ultra-fast method of near infrared imaging through biological tissues by compensation of the turbidity of these media. This method is based on instantaneous phase conjugation by three waves mixing in a type 2 non linear quadratic crystal. Imaging through biological tissues with thickness up to 5 mm has been performed. Furthermore we showed that this method works either with static or with moving scattering media, with in this latter case a significant improvement of the signal to noise ratio and of the resolution. Finally, we have shown that a type 2 TWM process leads to a polarization rotation of the PC wave with respect to the incident wave that does not preclude the image restoration process.
Acknowledgments : This work has been supported by the Agence Nationale de la Recherche (ICLM : Imagerie Coh´erente de Lumi`ere Multidiffus´ee, project ANR-2011-BS04-017-03) and the Conseil R´egional de Franche-Comt´e.
REFERENCES
1. D. Huang, E. A. Swanson, C. P. Lin, J. S. Schuman, W. G. Stinson, W. Chang, M. R. Hee, T. Flotte, K. Gregory, C. A. Puliafito, J. G. Fujimoto, “Optical Coherence Tomography,” Science 254(5035), 1178–1181 (1991).
2. A.H. Gandjbakhche, ” Diffuse optical imaging and spectroscopy in vivo ,” C.R. Acad. Sci. Paris ser IV, 2 1073-1089, (2001), and references therein
3. G. Le Tolguenec, F. Devaux, E. Lantz, ” Two-dimensional time-resolved direct imaging through thick biological tissues : a new step toward noninvasive medical imaging,” Opt. Lett. 24(15), 1047–1049 (1999) 4. L. Wang, S.L. Jacques, and X. Zhao, “Continuous-wave ultrasonic modulation of scattered laser light to image objects in turbid media”, Opt. Lett. 20(28), 629–631 (1995)
5. M. Atlan, B. C. Forget, F. Ramaz, A. C. Boccara, and M. Gross, ”Pulsed acousto-optic imaging in dynamic scattering media with heterodyne parallel speckle detection,” Opt. Lett., 30(11), 1360–1362 (2005) 6. E. Benoit a la Guillaume, U. Bortolozzo, J. P. Huignard, S. Residori, and F.Ramaz, ”Dynamic ultrasound modulated optical tomography by self-referenced photorefractive holography,” Opt. Lett. 38(3), 287–289 (2013)
7. F. Helmchen ,W. Denk, ”Deep tissue two-photon microscopy,” Nat. Methods 2(12), 932-940 (2005) 8. E. N. Leith and J. Upatneiks, “Holographic imagery through diffusing media,” J. Opt. Soc. Am. 56(4), 523 (1966).
9. Z. Yaqoob, D. Psaltis, M. S. Feld, C. Yang, “Optical phase conjugation for turbidity suppression in biological samples,” Nature Photon. 2(2), 110–115 (2008).
10. N. Bazulev, N. Fomin, C. Fuentes, T. Hirano, E. Lavinskaya, S. Martemianov, T. Mizukaki, A. Nakagawa, S. Rubnikovich, J.-B. Saulnier, K. Takayama, and J.-L. Tuhault, “Laser monitor for soft and hard biotissue analysis using dynamic speckle photography,” Laser Physics 13(5), 786–795 (2003).
11. E. J. McDowell, M. Cui, I. M. Vellekoop, V. Senekerimyan, Z. Yaqoob and C. Yang, “Turbidity suppression from the ballistic to the diffusive regime in biological tissues using optical phase conjugation,” J. Biomed. Opt. 15(2), 025004 (2010).
12. M. Cui, E. J. McDowell, and C. Yang, “An in vivo study of turbidity suppression by optical phase conjugation (TSOPC) on rabbit ear,” Opt. Express 18(1), 25–30 (2010).
13. Y.M. Wang, B. Judkewitz, C.A. DiMarzio, and C. Yang, “Deep-tissue focal fl uorescence imaging with digitally time-reversed ultrasound-encoded light,” Nat. Commun. 3, 928–936 (2012)
14. B. Jayet, J.P. Huignard, and F. Ramaz, “Optical phase conjugation in Nd:YVO4 for acousto-optic detection in scattering media”, Opt. lett. 38(8), 1256–1258 (2013)
15. F. Devaux, E. Guiot and E. Lantz, “Image restoration through aberrant media by optical phase conjugation in a type II three-wave mixing interaction,” Opt. Lett. 23(20), 1597–1599 (1998).
16. M. Johnson, C. C. Mao, G. Moddel, M. A. Handschy and K. Arnett, ” High-speed, low-power optical phase conjugation using a hybrid amorphous silicon/ferroelectric-liquid-crystal device”Opt. Lett. 15(20), 1114–1116 (1990).
17. V.S.Sudarshanamand, M.Cronin-Golomb, P.R.Hemmer and M.S.Shahriar, ”Turbulence aberration correction with high-speed high-gain optical phase conjugation in sodium vapor”, Opt. Lett. 22(15), 1141–1143 (1997).
18. D.C. Jones and K.D. Ridley, ”experimental investigation by stimulated Brillouin scattering of incomplete phase conjugation”, J. Opt. Soc. Am. B 14(10), 2657–2663 (1997).
19. F. Devaux, G. Le Tolguenec, and E.Lantz, ”Phase conjugate imaging by type II parametric amplifica-tion”, Opt. Comm. 147(4-6), 309–312 (1998)
20. I. Dror, A. Sandrov and N. S. Kopeika, “Experimental investigation of the influence of the relative position of the scattering position of the scattering layer on image quality: the shower curtain effect,” Appl. Opt. 37(27), 6495-6499 (1998).
21. M. Guillerm, F. Devaux, L. Froehly, L. Furfaro, and E. Lantz, “Ultrafast turbidity compensation in the optical therapeutic window by three-wave mixing phase conjugation”, Journal of Optics 15(5), 055204 (2013)
22. F. Devaux, and E.Lantz, “Transfer function of spatial frequencies in parametric image amplification: experimental analysis and application to picosecond spatial filtering”, Opt. Comm. 114(3), 295–300 (1995) 23. C.F. Bohren and D.R. Huffman, “Absorption and Scattering of Light by Small Particles,” John Wiley & Sons (New York) Chap. 4, pp. 82–129 (1983).
24. A. Ishimaru, ”Diffusion of light in turbid material”, Appl. Opt. 28(12), 2210–2215 (1989)
List of Figures
1 Experimental setup. . . 3 2 (a) k-wavevector diagram for non colinear three-wave-mixing. (b) Principle of forward TWMPC
imaging. (c) full phase conjugation by three-wave-mixing. The horizontal and vertical arrows represent the crossed polarization directions of the signal and idler waves in a type 2 interaction. For the sake of clarity, the pump plane wave is not represented. . . 4
3 Results of direct imaging results through different media : (a) the clean microscope slide. (b and c) one layer of translucent adhesive ribbon when the image of the object is formed on the diffusing medium and when the diffusing medium is placed before the image plane, respectively. (d) two layers of adhesive ribbon on both faces of the microscope slide. (e and f) biological tissues : 0.7 mm thick Parma ham slice and 5 mm thick chicken breast, respectively. . . 5 4 Resolution limits through translucent adhesive ribbon. (a) PC image through the clean microscope
slide , (b) PC image through a static single layer of translucent adhesive ribbon. PC images when the diffusing medium is moved (c) along the transversal axis (Y) and (d) along the propagation axis (Z) during the acquisition time. White rectangles surround the 16 mm−1 lines group. (e)
Normalized covariance between PC images (a) and (d). . . 6 5 Resolution limits through 0.7 mm thick Parma ham slice : (a) PC image through the clean
mi-croscope slide, (b) PC image through static biological tissue. PC images when biological tissue is moved (c) along the transversal axis (Y) and (d) along the propagation axis (Z) during the acqui-sition time. White rectangles surround the 14.24 mm−1 lines group. (e) : normalized covariance
between PC images (a) and (d) . . . 7 6 Image restoration through 0.7 to 5 mm thick biological tissues. (a) and (b) reference PC images of
1.41 mm−1and 2.83 mm−1 lines group of the USAF obtained through the clean microscope slide.
(c to f) respectively PC images obtained through static biological media with 0.7, 1.4 and 2.1 mm thicknesses (Parma ham) and 5 mm thickness (piece of chicken breast). (g to j) PC images obtained through the same biological tissues moving along Y axis. . . 8 7 (a) Typical scattering paths when 5 scattering events are considered. (b to d) Representations
of the normalized Stokes parameters [Q, U, V ] on the Poincar´e sphere of the output scattered fields (yellow stars) and the back-scattered phase conjugated fields (red crosses) when 1, 5 or 10 scattering events are considered. The black star denotes the vertical polarization state of the incident light. . . 10
List of Tables
1 Losses and mean values of the normalized Stokes parameters [Q, U, V ] of the back scattering phase conjugated fields for 1, 5 and 10 scattering events. Calculation are made with sets of 500 realizations. 11


![Figure 7. (a) Typical scattering paths when 5 scattering events are considered. (b to d) Representations of the normalized Stokes parameters [Q, U, V ] on the Poincar´e sphere of the output scattered fields (yellow stars) and the back-scattered phase conju](https://thumb-eu.123doks.com/thumbv2/123doknet/8001790.268155/11.892.139.778.113.682/scattering-scattering-considered-representations-normalized-parameters-scattered-scattered.webp)
![Table 1. Losses and mean values of the normalized Stokes parameters [Q, U, V ] of the back scattering phase conjugated fields for 1, 5 and 10 scattering events](https://thumb-eu.123doks.com/thumbv2/123doknet/8001790.268155/12.892.175.758.115.224/table-losses-normalized-stokes-parameters-scattering-conjugated-scattering.webp)
