Université de Montréal
Impacts de l'urbanisation sur la diversité spécifique et
fonctionnelle dans les forêts riveraines
par
Marie-Hélène Brice
Département de Sciences biologiques Faculté des arts et des sciences
Mémoire présenté à la Faculté des études supérieures en vue de l'obtention du grade de
Maître ès sciences (M. Sc.) en Sciences biologiques
Juin 2015
Résumé
L'urbanisation représente une menace majeure pour la biodiversité. Ce mémoire de maîtrise vise à comprendre ses effets sur la composition fonctionnelle et l'homogénéisation biotique dans les forêts riveraines. Des inventaires floristiques ont été réalisés dans 57 forêts riveraines de la région de Montréal.
Afin d'étudier la variation de la composition fonctionnelle avec l'urbanisation, des moyennes pondérées de traits par communauté ont été calculées pour les arbres, arbustes et herbacées. Chaque forêt a été caractérisée par des variables relatives au paysage urbain environnant, aux conditions locales des forêts et aux processus spatiaux. Les conditions locales, notamment les inondations, exerçaient une pression de sélection dominante sur les traits. L'effet du paysage était indirect, agissant via l'altération des régimes hydrologiques. La dispersion le long des rivières était aussi un processus important dans la structuration des forêts riveraines.
Les changements dans la diversité β taxonomique et fonctionnelle des herbacées ont été étudiés entre trois niveaux d'urbanisation et d'inondation. Alors que l'urbanisation a favorisé une différenciation taxonomique, les inondations ont favorisé une homogénéisation taxonomique, sans influencer la diversité β fonctionnelle. L'urbanisation était l'élément déclencheur des changements de la diversité β, directement, en causant un gain en espèces exotiques et une diminution de la richesse totale dans les forêts très urbanisées, et, indirectement, en entraînant un important turnover d'espèces par l'altération des régimes hydrologiques.
activités anthropiques est le principal moteur de changements dans les communautés riveraines urbaines.
Mots-clés : Analyses spatiales (AEM et MEM), Communautés riveraines, Dispersion,
Diversité alpha et beta, Espèces exotiques, Homogénéisation biotique, Inondation, Moyennes pondérées de traits par communauté (CWM), Traits fonctionnels, Urbanisation
Abstract
Urbanization is a major threat to biodiversity worldwide. This thesis aims at understanding its effects on plant functional composition and biotic homogenization in riparian forests. Floristic inventories were carried out in 57 riparian forests of the Montreal area.
To investigate changes in functional composition with urbanization, community weighted means were computed for trees, shrubs and herbs using eight functional traits. Each forest was characterized by variables related to the surrounding urban landscape, local forest conditions and spatial processes. The relative importance of these three subsets on the functional composition was quantified by variation partitioning using redundancy analyses. Local conditions, especially flood intensity, exerted an overriding selection pressure on riparian functional communities. The effect of the landscape was suspected to be indirect, acting on trait patterns likely through alteration of hydrological disturbances in riparian forests. In addition to environmental filtering, dispersal along rivers was also an important process structuring riparian forests.
Changes in taxonomic and functional β-diversity for herb species were studied between three urbanization and flood levels. While urbanization led to taxonomic differentiation, flood intensity fostered taxonomic homogenization, both without influence on functional β-diversity. Urbanization was the main trigger for all β-diversity changes, as it directly caused a gain in exotic species and a net species loss in highly urban forests, and indirectly fostered an important species turnover through alteration of the hydrological regime.
Overall, these results suggest that the alteration and interruption of natural landscape-scale processes by human activities are major mechanisms underlying changes in urban riparian
communities.
Keywords : Alpha and beta diversity, Biotic homogenization, Community weighted means of
traits (CWM), Dispersal, Exotic species, Flood, Functional traits, Riparian plant communities, Spatial eigenvector analysis (AEM and MEM), Urbanization
Table des matières
Résumé ... i
Abstract ... iii
Liste des tableaux ... viii
Liste des figures ... ix
Liste des annexes ... xi
Remerciements ... xiii
Chapitre 1 ... 1
Introduction ... 1
Les filtres écologiques dans les milieux urbains ... 2
Urbanisation et homogénéisation biotique ... 4
Historique de perturbations et héritage écologique dans les villes ... 6
Les forêts riveraines ... 7
Impact de l'urbanisation sur les forêts riveraines ... 10
Objectifs ... 12
Chapitre 2 ... 14
Environmental filtering and spatial processes in urban riparian forests ... 14
Abstract ... 15
Introduction ... 17
Methodology ... 20
Study area ... 20
Vegetation sampling ... 22
Environmental data sampling ... 22
Data analysis ... 25
Results ... 29
Directional vs non-directional spatial patterns ... 29
Scales of spatial variation ... 31
Partitioning trait variation between environmental filtering and spatial processes ... 31
Discussion ... 35
The interplay between local, landscape and spatial filters ... 35
Shift of plant traits along an urban–rural gradient ... 37
Shift of plant traits along a human-induced successional gradient ... 38
Conclusion ... 39
References ... 41
Chapitre 3 ... 47
Does urbanization lead to taxonomic and functional homogenization in riparian forests? ... 47
Abstract ... 48
Introduction ... 50
Methodology ... 53
Study area ... 53
Site selection and vegetation sampling ... 54
Urbanization and flooding intensity ... 56
Functional traits ... 57
Results ... 62 Discussion ... 68 Conclusion ... 75 References ... 77 Chapitre 4 ... 84 Conclusion ... 84 Annexes du chapitre 2 ... i
Liste des tableaux
Chapitre 2
Table 2.1. Description of all explanatory variables characterizing the 57 riparian forests of the
Greater Montreal region. ... 23
Table 2.2. Description of the selected functional traits used in analyses. ... 25
Chapitre 3
Table 3.1. Number of forest patches and class ranges for the different levels of
urbanization and flood intensity... 57
Table 3.2. Description of the selected functional traits used to measure functional
β-diversity changes in urban riparian forests ... 58
Table 3.3. Results of permutational test of multivariate dispersion and
permutational MANOVA between urbanization and flood levels for
Liste des figures
Chapitre 2
Figure 2.1. Location map of the 57 riparian forests sampled in the Greater
Montreal region. ... 21
Figure 2.2. Variation partitioning of trait composition explained by the subsets of
selected AEM and MEM variables ... 30
Figure 2.3. Maps of selected AEM functions, reflecting patterns at different
spatial scales, for tree, shrub and herb CWM data along des Mille Îles and des
Prairies rivers ... 31
Figure 2.4. Variation partitioning and ordination diagrams of CWM explained by
the subsets of local, landscape and spatial variables ... 35
Chapitre 3
Figure 3.1. Location map of the 57 riparian forests sampled in the Greater
Montreal region ... 55
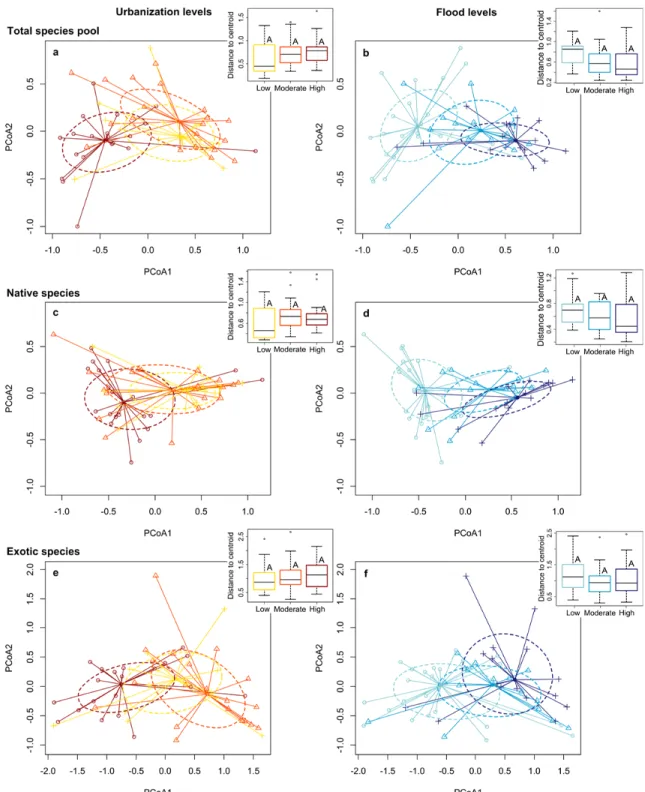
Figure 3.2. Taxonomic β-diversity. Influence of urbanization and flood levels on
the multivariate dispersion of species composition in the forest patches for
total, native and exotic species ... 64
Figure 3.3. Functional β-diversity. Influence of urbanization and flood levels on
the multivariate dispersion of trait composition in the forest patches for total,
Figure 3.4. PCoA biplot of all forests based on total species functional
composition matrix. Functional traits were projected on the PCoA ordination
to show their contribution to β-diversity ... 67
Figure 3.5. Correlations between total species richness, exotic proportion,
taxonomic β-diversity and functional β-diversity for the total species pool ... 69
Figure 3.6. Differences in taxonomic and functional β-diversity caused by exotic
Liste des annexes
Chapitre 2
Table S2.1. Number of patches selected for each range of the selection criterion: patch area,
patch position, proportion of flooded forest area, and proportion of surrounding
impervious surfaces. ... ii
Table S2.2. Pearson correlation coefficients between all explanatory variables from the local and landscape subsets ... iii
Table S2.3. Species functional trait matrix for trees, shrubs and herbs ... iv
Table S2.4. Comparison of weights based on RDA models of CWM ... xx
Table S2.5. Selected explanatory variables using the forward selection procedure ... xxi
Figure S2.1. Connectivity diagram, based on the current direction, used to generate the AEM and the dbMEM eigenfunctions. ... xvii
Chapitre 3
Table S3.1. Number of patches selected for each range of the selection criterion:
patch area, patch position, proportion of flooded forest area, and proportion of
surrounding impervious surfaces ... xxiii
Remerciements
Un mémoire de maîtrise n'est pas une réalisation individuelle, mais plutôt le fruit d'un travail collectif. Par leurs idées, leurs conseils ou leur support moral, plusieurs personnes ont contribué de près ou de loin à l'achèvement de ce mémoire.
Je souhaite tout d'abord remercier ma directrice de recherche, Stéphanie Pellerin, de m'avoir soutenue et encouragée tout au long de ce projet, mais aussi depuis ma première année au baccalauréat. Sa grande disponibilité, son indéfectible optimisme et sa confiance en mes capacités ont contribué à la fois au succès de mon projet de maîtrise et au développement de mes aptitudes en recherche. Je tiens également à remercier ma codirectrice, Monique Poulin. Bien que loin physiquement, ses suggestions, ses idées, ses remises en question et ses encouragements m'ont apporté une aide précieuse durant ces deux années.
Je remercie Pierre Legendre, Daniel Borcard et Étienne Laliberté pour leur patience et leurs judicieux conseils qui ont permis d'enrichir ce mémoire.
J'aimerais aussi remercier les personnes qui se sont mouillé les pieds et sali les mains lors de l'échantillonnage sur le terrain, de même que celles qui m'ont assistée dans le travail de laboratoire: Andréa Richer, Annabelle Langlois, Jean-Sébastien Mignot, Salomé Pasquet et Youri Tendland. Merci également à Geoffrey Hall et Stuart Hay, pour leur collaboration dans l'identification de spécimens de plantes vasculaires. Merci également à mes collègues du laboratoire Pellerin autant pour les nombreuses discussions scientifiques que pour le soutien moral.
Je remercie tout particulièrement ma famille, votre soutien inconditionnel tout au long de mes études a rendu possible l'achèvement de ce travail. Ils ont eu confiance en moi quand j'anticipais l'échec; ils sont parvenus à me motiver quand j'étais désabusée et me détendre quand j'étais angoissée; et ils ont su trouver les mots justes autant pour me féliciter de mes réussites que me consoler dans les moments de déceptions.
En terminant, je souhaiterais remercier le Conseil de recherche en sciences naturelles et en génie du Canada (CRSNG), le Fonds de recherche du Québec – Nature et technologies (FRQNT), le Centre de la Science de la Biodiversité du Québec, l'Université de Montréal et l'Institut de recherche en biologie végétale de m'avoir octroyé une aide financière.
Chapitre 1
Introduction
L'urbanisation représente une menace majeure pour la biodiversité (Grimm et al., 2008). Dans les forêts urbaines, les conditions environnementales sont souvent radicalement modifiées par les activités anthropiques, menant ainsi à l'extinction locale d'espèces sensibles aux perturbations au profit d'espèces plus résistantes (McKinney, 2006). En effet, l'environnement urbain agit comme une succession de filtres écologiques qui exercent une forte pression de sélection sur les traits fonctionnels des espèces (Williams et al., 2008), de façon analogue à la sélection naturelle, ce qui altère les processus d'assemblage des communautés. L'altération des règles d'assemblage modifie les patrons de distribution des traits fonctionnels dans le paysage (Knapp et al., 2009; Vallet et al., 2010a; Duncan et al., 2011; McCune & Vellend, 2013; Williams et al., 2015) et peut également mener à une homogénéisation biotique des communautés due à une sélection artificielle biaisée vers un nombre restreint d'espèces ou de traits (McKinney, 2006; La Sorte et al., 2007, 2014; Aronson et al., 2014a). Par conséquent, la distribution des espèces dans les écosystèmes urbains est en général gouvernée par des facteurs anthropiques (e.g., Godefroid & Koedam, 2007; Knapp et al., 2008; Čepelová & Münzbergová, 2012), tandis que les facteurs biotiques et abiotiques naturels jouent un rôle secondaire. Toutefois, dans les forêts riveraines, l'intensité des perturbations naturelles pourrait davantage complexifier l'impact de l'urbanisation sur les communautés végétales. Les forêts riveraines sont soumises à de fréquentes inondations qui peuvent interagir avec les filtres anthropiques associés à l'urbanisation. De plus, comme les
inondations agissent directement sur la survie des individus, en particulier par l'anoxie (Blom & Voesenek, 1996; Parent et al., 2008), leurs effets pourraient outrepasser ceux des filtres urbains. Pourtant, l'importance relative des filtres urbains et naturels sur les communautés riveraines a été peu explorée jusqu'à récemment (e.g., Burton et al., 2009; Sung et al., 2011). Ce mémoire de maîtrise étudie donc les impacts de l'urbanisation sur les forêts riveraines et tente de démêler les effets des filtres urbains et naturels, d'une part sur la composition fonctionnelle (chapitre 2), et d'autre part, sur l'homogénéisation biotique (chapitre 3) des communautés végétales. Dans le présent chapitre, le concept des règles d'assemblage des communautés permet d'examiner comment l'urbanisation et les conditions riveraines, notamment les inondations, agissent sur les traits fonctionnels des plantes et, par conséquent, sur la distribution de la diversité.
Les filtres écologiques dans les milieux urbains
La perte et la fragmentation d'habitats, conséquences inhérentes de l'urbanisation, sont les principaux filtres écologiques déterminant les patrons de végétation dans les villes (Williams et al., 2008). Les milieux urbains sont des paysages très fragmentés où ne subsistent souvent que de petits vestiges de forêts, isolés les uns des autres par une matrice humanisée. Alors que la perte d'habitat cause l'extinction de nombreuses populations d'espèces, plus particulièrement les espèces spécialistes (McKinney & Lockwood, 1999; Sax & Gaines, 2003; Van der Veken et al., 2004), la fragmentation réduit la probabilité de colonisation des habitats isolés, favorisant entre autres les espèces ayant une grande capacité de dispersion, telles que celles ayant recours à l'anémochorie et la zoochorie (Moffatt et al., 2004; Knapp et al., 2009; Marini et al., 2012; Penone et al., 2012).
Cette fragmentation du paysage crée également des lisières dans les forêts, où les facteurs abiotiques sont altérés par la matrice environnante. Comparativement à l'aire centrale des forêts, les lisières sont soumises à des conditions environnementales hostiles pour les espèces forestières, notamment à des conditions de luminosité et de température plus élevées, une plus faible humidité du sol et des perturbations plus fréquentes (Murcia, 1995; Vallet et al., 2010b). Ces conditions favorisent ainsi l'établissement d'espèces annuelles, à croissance rapide et tolérantes aux perturbations (Godefroid & Koedam, 2003; Guirado et al., 2006; LaPaix & Freedman, 2010). Les lisières sont aussi vulnérables à l'introduction de plantes exotiques dans les forêts (Cadenasso & Pickett, 2001; Guirado et al., 2006), car, en plus de leur offrir des conditions environnementales propices, elles subissent une pression de propagules d'espèces ornementales provenant des jardins et des parcs aménagés dans leur voisinage (Williams et al., 2008; Kowarik, 2011). En outre, la plupart des forêts urbaines, étant soumises à un usage récréatif intense (Moffatt et al., 2004; Duguay et al., 2007), sont traversées par de multiples sentiers qui perturbent le sous-bois (Godefroid & Koedam, 2004) et facilitent la percolation des espèces de lisières dans l'aire centrale des forêts (Guirado et al., 2007; LaPaix et al., 2012).
L'urbanisation entraîne aussi une augmentation des surfaces imperméables au détriment du couvert végétal. Cette transformation du sol modifie les conditions environnementales dans les habitats résiduels, en particulier en altérant les conditions hydrologiques. Les surfaces imperméables sont aussi associées à la formation d'îlots de chaleur urbains, lesquels provoquent un stress thermique et hydrique qui favorise les espèces tolérantes à la sécheresse (Williams et al., 2015). Dans les régions froides, les îlots de chaleur urbains peuvent également prolonger la saison de croissance (Imhoff et al., 2000) et ainsi
favoriser l'établissement des espèces ayant des exigences thermophiles, comme de nombreuses plantes rudérales et exotiques introduites à partir de régions plus chaudes (Knapp et al., 2008, 2009; Čepelová & Münzbergová, 2012; Penone et al., 2012). De plus, les surfaces imperméables limitent l'infiltration des eaux pluviales dans le sol et la recharge de la nappe phréatique (Walsh et al., 2005; White & Greer, 2006), exerçant un stress hydrique supplémentaire sur la végétation (Groffman et al., 2003; Sung et al., 2011). Il en résulte aussi une augmentation du ruissellement de surface (Paul & Meyer, 2001; White & Greer, 2006) qui peut accumuler les polluants urbains et contaminer les habitats résiduels (Kaye et al., 2006) et ainsi favoriser les espèces ayant une préférence pour les sols alcalins et fertiles (Godefroid et al., 2007; Vallet et al., 2010b).
Urbanisation et homogénéisation biotique
L'urbanisation entraîne des changements non aléatoires dans la distribution des espèces, créant des patrons complexes de biodiversité à travers différentes échelles spatiales (Grimm et al., 2008; Williams et al., 2015). Bien que les perturbations humaines aient causé un déclin de la biodiversité mondiale en raison des extinctions, à l'échelle locale, l'introduction d'espèces exotiques semble généralement compenser la perte d'espèces indigènes et enrichir la diversité locale α (Sax & Gaines, 2003). De plus, indépendamment de la diversité α, l'extinction des espèces indigènes spécialisées couplée à l'invasion par des espèces exotiques cosmopolites peut mener à une homogénéisation de la composition des communautés (diminution de la diversité β; McKinney & Lockwood, 1999; McKinney, 2006). Toutefois, ce processus par lequel les communautés deviennent de plus en plus similaires les unes par rapport aux autres dépend de nombreux facteurs, principalement de l'échelle (Olden & Poff,
2003), du type d'habitat (Qian & Guo, 2010; Gong et al., 2013) et du temps de résidence des espèces exotiques (Kühn & Klotz, 2006; Lososová et al., 2012). Par exemple, l'homogénéisation a surtout été observée entre différentes villes à l'échelle planétaire ou continentale (Baiser et al., 2012; Aronson et al., 2014a; La Sorte et al., 2014). Alors qu'à l'échelle locale, le long d'un gradient urbain à rural dans les régions métropolitaines, certaines études tendent à montrer que l'urbanisation peut provoquer une différenciation taxonomique plutôt que l'homogénéisation prédite (Kühn & Klotz, 2006; Aronson et al., 2014b; Bossu et al., 2014). D'ailleurs, bien que l'homogénéisation à l'échelle planétaire soit imputée à l'expansion des espèces exotiques, à l'échelle locale, celles-ci semblent généralement accroître la diversité β dans les écosystèmes perturbés par l'humain (Kühn & Klotz, 2006; Abadie et al., 2011; Lososová et al., 2012; Aronson et al., 2014b), tandis que les espèces indigènes semblent favoriser l'homogénéisation (McCune & Vellend, 2013; Johnson et al., 2014; Li & Waller, 2015).
Comme les espèces ne sont pas sélectionnées au hasard, mais selon leurs traits fonctionnels, une homogénéisation ou une différenciation taxonomique devrait se traduire en une homogénéisation ou une différenciation fonctionnelle (Olden et al., 2004). Cependant, les preuves empiriques d'une relation entre la diversité β taxonomique et fonctionnelle sont inconsistantes et contradictoires (Smart et al., 2006; Abadie et al., 2011; Naaf & Wulf, 2012; Sonnier et al., 2014), probablement parce que cette relation dépend notamment de la redondance des traits entre les espèces (Baiser & Lockwood, 2011), de même que de la composition en espèces et des conditions environnementales initiales (Fukami et al., 2005; Smart et al., 2006). Par exemple, l'absence d'homogénéisation fonctionnelle malgré une homogénéisation taxonomique dans le temps reflète un haut niveau de redondance
fonctionnelle entre les communautés, i.e. le remplacement des espèces par d'autres espèces ayant des traits similaires (Sonnier et al., 2014). Inversement, une diminution de la richesse locale suivie d'une différentiation taxonomique et d'une homogénéisation fonctionnelle indique que la perte d'espèces entraîne une convergence des traits, tout en maintenant la distinction historique des espèces entre les communautés (Smart et al., 2006). Par conséquent, il demeure incertain si une homogénéisation taxonomique implique réellement une homogénéisation fonctionnelle.
Historique de perturbations et héritage écologique dans les villes
La réponse des écosystèmes à l'urbanisation est complexe, car l'historique de perturbations et d'utilisation du sol continue à influencer les écosystèmes, en laissant un héritage écologique qui persiste longtemps, parfois pour plusieurs décennies ou siècles (Foster et al., 2003; Kuussaari et al., 2009; Wulf & Kolk, 2014). L'influence de cet héritage du passé sur les composantes biotiques et abiotiques des écosystèmes dépend principalement du type de perturbations. Par exemple, l'héritage de l'agriculture persiste longtemps dans les caractéristiques des sols, lesquels ont généralement un pH et des concentrations en nutriments plus élevés ainsi qu'une plus faible teneur en matière organique que les sols forestiers (Flinn & Vellend, 2005). Ainsi, une perturbation majeure influence directement la composition des plantes qui viendront coloniser l'habitat une fois la perturbation terminée en léguant des conditions environnementales modifiées. À l'opposé, certaines perturbations, comme la fragmentation, présentent plutôt une réponse décalée dans le temps, car les espèces peuvent survivre à la perturbation, mais disparaître beaucoup plus tard. Cette dette d'extinction se produit en raison d'un décalage temporel entre la perturbation et la réponse des espèces(Kuussaari et al., 2009; Ramalho et al., 2014). Ainsi, les petits vestiges de forêts peuvent parfois contenir une plus grande richesse que prédit par la relation aire-espèces, car de nombreuses espèces y sont établies depuis longtemps et leurs populations peuvent s'y maintenir localement par reproduction végétative ou par la dispersion sur de courtes distances (Vellend et al., 2006; De Sanctis et al., 2010; Wulf & Kolk, 2014). Les décalages temporels sont plus importants dans les fragments plus grands et plus connectés, et pour une perte d'habitat plus sévère, laquelle engendre une dette d'extinction plus grande. De plus, les espèces avec un cycle de vie long, comme les plantes vivaces ou ligneuses, ont une réponse plus lente aux perturbations que les espèces annuelles (Kuussaari et al., 2009).
Les forêts riveraines
Les forêts riveraines sont particulièrement fragiles aux transformations du paysage. Or, dans un contexte urbain, elles revêtent une grande importance pour la conservation (Kominoski et al., 2013) étant donné qu'elles soutiennent une grande diversité d'espèces végétales uniques qui assurent de multiples fonctions écosystémiques essentielles. Ces forêts jouent des rôles écologiques cruciaux pour le maintien de la qualité de l'eau et pour de nombreux processus hydrologiques, tels que la filtration des contaminants et des sédiments, la stabilisation des rives, l'atténuation de l'intensité des crues et la régulation thermique des cours d'eau (Tabacchi et al., 2000; Paul & Meyer, 2001; Décamps et al., 2004; Naiman et al., 2005). De plus, étant soumises à un régime de perturbations sévères, les forêts riveraines arborent des assemblages floristiques distincts des habitats terrestres adjacents et contribuent ainsi à augmenter la biodiversité régionale (Sabo et al., 2005).
Le régime de perturbations hydrologiques, soit les inondations, les sécheresses et les fluctuations de la nappe phréatique, gouverne la dynamique végétale et structure les patrons de distribution d'espèces dans les forêts riveraines (Tabacchi et al., 1998; Richardson et al., 2007). Les inondations, dont l'intensité et la fréquence varient selon la distance à la rive et la topographie, éliminent partiellement ou totalement la végétation en place, rendent disponibles les ressources (e.g., nutriments, lumière), déposent de nouveaux sédiments et créent des espaces vacants pour la colonisation (Jansson et al., 2005; Moggridge et al., 2009). Cette réinitialisation périodique de la succession végétale crée une mosaïque d'habitats hétérogènes, complexes et dynamiques favorisant la coexistence de nombreuses espèces (Tabacchi et al., 1998, 2005). Toutefois, la survie dans un milieu aussi dynamique requiert diverses stratégies de réponse aux perturbations et au stress (Violle et al., 2011) puisque les espèces riveraines sont confrontées de manière récurrente non seulement aux inondations, mais aussi à l'anoxie, l'érosion, l'abrasion et la sécheresse.
Dans les milieux riverains, l'anoxie au niveau de la rhizosphère quand le sol est inondé est certainement la contrainte la plus importante pour la survie et la croissance des plantes. Pour y faire face, les plantes ont développé différentes adaptations permettant la diffusion de l'oxygène à partir des parties aériennes de la plante vers les racines, notamment la production de tissus aérenchymateux dans les racines et les tiges, ainsi que la croissance de racines adventives (Lytle & Poff, 2004; Parent et al., 2008). En réponse aux fluctuations extrêmes allant d'un surplus à un manque d'eau, certaines plantes peuvent persister dans le sol sous forme d'une banque de graines et attendre que les conditions deviennent favorables à leur germination et leur croissance (Gurnell et al., 2006; Moggridge et al., 2009). Outre le stress physiologique, les inondations exercent aussi des stress physiques sur les plantes par l'érosion,
qui rend le sol instable, ainsi que par l'action abrasive du courant et des débris transportés. Ces stress physiques peuvent favoriser des plantes ayant des branches flexibles, qui leur confèrent une protection contre les cassures, ou encore ayant la capacité de se reproduire végétativement à partir de fragments arrachés par le courant (Karrenberg et al., 2002; Lytle & Poff, 2004).
En plus de structurer les patrons de végétation par les perturbations hydrologiques, le cours d'eau représente un important vecteur de dispersion pour la colonisation des communautés végétales riveraines, particulièrement lors de la crue printanière où la plupart des propagules sont dispersées et déposées (Jansson et al., 2005; Moggridge et al., 2009). Ce processus de dispersion unidirectionnel suivant le courant structure les patrons de distribution de ces communautés (Levine, 2003), par exemple, en créant un gradient de richesse croissant d'amont en aval, autant en espèces indigènes qu'exotiques (Planty-Tabacchi et al., 1996; Tabacchi et al., 2005). Johansson et al. (1996) ont d'ailleurs trouvé une relation positive entre la flottabilité des propagules et la fréquence des espèces dans la végétation riveraine. L'hydrochorie, soit la dispersion par l'eau, peut aussi agir comme un mode de dispersion secondaire sur de très longues distances pour un grand nombre de propagules d'espèces non spécialisées, entre autres pour les espèces catégorisées comme principalement anémochores (Tabacchi et al., 2005; Seiwa et al., 2008; Säumel & Kowarik, 2010) et même zoochores (Hampe, 2004). En facilitant ainsi la dispersion, le cours d'eau maintient une grande connectivité entre les forêts riveraines, atténuant possiblement les effets délétères de la fragmentation du milieu terrestre. L'urbanisation pourrait toutefois perturber tous ces importants processus hydrologiques naturels.
Impact de l'urbanisation sur les forêts riveraines
Contrairement aux perturbations hydrologiques naturelles qui font partie intégrante des écosystèmes riverains, les perturbations anthropiques n'ont pas un effet revitalisant, mais plutôt un effet affaiblissant et détériorant (Naiman et al., 2005). Les conséquences des activités anthropiques sur les écosystèmes riverains sont complexes, car ces perturbations modifient et interagissent avec les processus naturels, et se répercutent à de multiples échelles spatio-temporelles (Naiman et al., 2005; Thorp et al., 2008). De plus, historiquement, les milieux riverains ont toujours été des foyers pour l'occupation humaine et l'agriculture (Groffman et al., 2003), laissant un héritage de perturbations disproportionnellement lourd à ces écosystèmes. Les pressions anthropiques sur les communautés riveraines découlent directement de la destruction des habitats riverains, mais aussi indirectement de la transformation du sol dans le bassin versant et de la modification des régimes hydrologiques par diverses constructions le long des rivières (e.g., les barrages et digues).
Les forêts riveraines en milieu urbain sont soumises aux mêmes pressions de sélection que les autres forêts (isolation, effet de lisière, îlots de chaleur, etc.). Cependant, étant étroitement associées aux conditions hydrologiques, les forêts riveraines sont particulièrement affectées par les transformations du sol découlant de l'urbanisation. Par exemple, les surfaces imperméables, en plus d'entraîner la création d'îlots de chaleur, l'abaissement de la nappe phréatique et la pollution des sols, engendrent une augmentation du débit et de l'amplitude des crues suite à l'augmentation du ruissellement de surface, ce qui endommage et érode les rives (Walsh et al., 2005; White & Greer, 2006). Ainsi, en général, les bassins versants urbains présentent des régimes hydrologiques plus contrastés, marqués par des crues plus intenses et
des débits de base plus faibles. De plus, diverses structures artificielles, typiques des milieux humanisés, telles que les systèmes de canalisation, les murs de soutènement, les barrages et les ponts, aggravent ces perturbations au régime hydrologique naturel (Paul & Meyer, 2001; Groffman et al., 2003; Walsh et al., 2005). Ces changements hydrologiques d'origine anthropique entraînent une homogénéisation des régimes d'inondations à l'échelle régionale (Poff et al., 2007), ce qui pourrait conduire à une homogénéisation taxonomique plus rapide dans les communautés riveraines que dans les milieux terrestres (Johnson et al., 2014). En outre, ces changements hydrologiques ont été reconnus comme le moteur principal des changements de végétation observés dans les forêts riveraines en favorisant les espèces terrestres tolérantes aux sécheresses (Groffman et al., 2003; Burton et al., 2009; Pennington et al., 2010; Sung et al., 2011) et en facilitant les invasions par les espèces exotiques (Stromberg et al., 2007; Mortenson & Weisberg, 2010; Catford et al., 2011). Les forêts riveraines sont d'ailleurs parmi les écosystèmes les plus vulnérables aux invasions biologiques (Hood & Naiman, 2000; Renöfält et al., 2005; Richardson et al., 2007), ce qui pourrait exacerber les processus d'homogénéisation biotique en milieu riverain par rapport au milieu terrestre. En effet, tandis que la matrice urbaine exerce une pression de propagules d'espèces exotiques constante (Williams et al., 2008; Kowarik, 2011), les rivières leur servent de corridors de dispersion vers les sites en aval, où, après une inondation, ces espèces peuvent profiter de l'absence de compétition et exploiter les ressources (Jansson et al., 2005; Sabo et al., 2005; Tabacchi et al., 2005).
Comprendre et anticiper la réponse des forêts riveraines à l'urbanisation est essentiel afin de préserver leur intégrité écologique. Cependant, l'identification d'un filtre spécifique responsable des changements dans la répartition des espèces est difficile, car les effets de
multiples filtres sont souvent confondus et en interaction (Williams et al., 2008). La force des filtres liés à l'urbanisation et aux inondations et le rôle attendu de la rivière comme corridor de dispersion font des forêts riveraines urbaines un système modèle idéal pour étudier les effets indépendants et synergiques des filtres naturels et anthropiques sur la composition des communautés, et pour isoler les effets de ces filtres environnementaux de ceux des processus de dispersion. L'utilisation de traits fonctionnels permet de révéler les mécanismes clés sous-jacents à l'assemblage des communautés en comblant le fossé entre les changements de composition et les changements environnementaux (Lavorel & Garnier, 2002; Mayfield et al., 2010).
Objectifs
Dans ce contexte, l'objectif global de ma maîtrise est de comprendre les effets de l'urbanisation sur les patrons de diversité et de composition des forêts riveraines. La première étude (chapitre 2) examine les changements de composition fonctionnelle en réponse aux filtres anthropiques et hydrologiques ainsi qu'aux processus de dispersion et aborde les questions suivantes:
(1) Quels sont les filtres environnementaux clés qui structurent la composition fonctionnelle des communautés riveraines dans les villes?
(2) Quelle est l'importance relative des processus de dispersion par la rivière et par voie terrestre dans la distribution des traits, dans un contexte de forêts à la fois fragmentées par l'urbanisation et connectées via le réseau hydrologique?
La seconde étude (chapitre 3) explore les effets de l'urbanisation et des inondations sur l'homogénéisation taxonomique et fonctionnelle dans les forêts riveraines. Plus précisément, les questions suivantes sont abordées:
(1) L'urbanisation et les inondations entraînent-elles une tendance d'homogénéisation ou de différenciation des espèces et des traits dans les communautés forestières riveraines?
(2) Cette tendance est-elle associée à un changement de la composition en espèces ou en traits, de la richesse locale, ou de la dominance des espèces exotiques?
Chapitre 2
Environmental filtering and spatial processes in urban
riparian forests
Marie-Hélène BRICE1,2, Stéphanie PELLERIN1,2* & Monique POULIN2,3
(1) Institut de recherche en biologie végétale, Université de Montréal and Jardin botanique de Montréal, Montréal, Qc, Canada;
(2) Québec Centre for Biodiversity Science, McGill University, Montréal, Qc, Canada (3) Université Laval, Department of Phytology, Québec, Qc, Canada
Submitted to Journal of Vegetation Science
MHB (75%) is the primary author on all the papers and conducted the fieldwork, data analysis, and wrote the initial drafts. Co-authors SP and MP (25%) have provided valuable advice on data analysis, contributed with ideas, and final text editing.
Abstract
Questions This project aims to understand the effects of urbanization on plant functional
composition in riparian forests, and addresses the following questions: What are the key environmental filters shaping riparian communities in cities? How important is dispersal by water currents in functional composition patterns relative to overland dispersal?
Location Montréal, Quebec, Canada
Methods Fifty-seven riparian forest patches were inventoried and community weighted means
(CWM) were computed using eight functional traits. Forests were characterized by a subset of local variables describing their physical features, hydrological regime and historical disturbances, and a subset of landscape variables describing surrounding land use. To assess direction of spatial processes in structuring riparian communities, two subsets of spatial variables, Moran's eigenvector maps (MEM) and asymmetric eigenvector maps (AEM) were compared, and the best spatial model was used in subsequent analyses. The relative importance of these three subsets on tree, shrub and herb functional composition was quantified by variation partitioning using redundancy analyses.
Results Functional patterns in riparian forests resulted primarily from environmental filtering
(local and landscape variables), but also from dispersal processes. Local conditions, especially flood intensity, exerted an overriding selection pressure on functional communities. However, urbanization seemed to act indirectly on trait patterns through the alteration of hydrological disturbances in riparian forests caused by ongoing and historical land transformation. Dispersal along rivers was also a structuring force in riparian forests, and was more important than overland dispersal.
Conclusions Alteration and interruption of natural landscape-scale processes by human activities are major mechanisms underlying changes in urban riparian communities. Furthermore, the influence of dispersal along rivers highlights the role of river connectivity for biodiversity in fragmented urban landscapes.
Keywords Asymmetric eigenvector maps (AEM); Community weighted means of traits
(CWM); Dispersal spatial processes; Ecological filters; Flood; Moran's eigenvector maps (MEM); Plant functional traits; Riparian plant communities; Urbanization
Introduction
Urbanization is a driver of global change and a major threat to biodiversity worldwide (Grimm et al., 2008). In urban ecosystems, both human and natural filters influence the composition of communities through the selection of certain species with specific traits (Williams et al., 2015). Human filters acting on species distribution include habitat transformation and fragmentation, alteration of local conditions and horticultural human preferences (Williams et al., 2008). Urbanization changes the quality and spatial configuration of habitats as well as the regional pool of species, which in turn alter natural environmental filtering and dispersal-based processes of community assembly. Consequently, species distributions in urban ecosystems are generally prevailingly structured by anthropogenic (Godefroid & Koedam, 2007; Knapp et al., 2008), rather than by natural biotic and abiotic factors. In contrast, riparian forests are subject to frequent flooding, which may override the effects of the above mentioned anthropogenic filters associated with urbanization. Yet, the relative importance of both urban and natural filters on riparian communities has been overlooked until recently (e.g., Burton et al., 2009; Sung et al. 2011).
In riparian forests, floods constitute both a destructive and regenerating force that strongly structures plant communities (Naiman et al., 2005). Riparian species have developed numerous adaptations to waterlogging, fluctuating water levels and physical stress from currents. For example, the production of aerenchyma and growth of adventitious roots are traits that enable species to survive anoxia resulting from prolonged waterlogging (Lytle & Poff, 2004; Parent et al., 2008). In response to extreme fluctuations ranging from water excess to water shortage, some plants persist as soil seed bank and wait for favorable conditions
(Gurnell et al., 2006; Moggridge et al., 2009). Stress from floods and sediment erosion/deposition can favor plants with flexible branches or capable of vegetative reproduction from ripped off fragments (Karrenberg et al., 2002; Lytle & Poff, 2004). In addition to strongly influencing local conditions, rivers structure riparian communities by acting as an important upstream to downstream dispersal vector (Moggridge et al., 2009; Nilsson et al., 2010), especially for species with high seed buoyancy (Johansson et al., 1996). Urbanization can, however,disrupt these natural hydrological processes.
Dispersal is an important mechanism of community assembly that structures diversity and induces spatial patterns (Logue et al., 2011). While riparian forests are highly connected through the river network (Nilsson et al., 2010), urban forests are highly isolated by habitat fragmentation (Williams et al., 2008). These contrasting contexts impede the extension of traditional predictions about terrestrial remnants to riparian remnants in urban areas, but they provide an opportunity to study the importance of different dispersal processes in community assembly. Although dispersal is expected to mainly occur in a downstream direction (Nilsson et al., 2010), this directional process may not be as effective in a fragmented landscape, and urban riparian communities may also be influenced by other long-distance overland dispersal vectors, such as animal or human (e.g., Knapp et al., 2009). In addition, hydraulic structures on rivers (e.g., dams and dikes) disrupt upstream-downstream connectivity (Jansson et al., 2000; Merritt et al., 2010) as well as lateral connectivity, which can lead to a terrestrialization of riparian communities by allowing upland species to invade the formerly dynamic riparian habitat (Ward & Stanford, 1995). Spatial modeling methods (Dray et al., 2006) can be used to shed light on the pathways of dispersal processes in riparian plant communities and assess the importance of spatial processes relative to local and landscape factors.
This study aims to investigate the effects of urbanization on riparian forest communities. Identifying a specific filter as the cause of changes in species distribution is challenging, since the effects of multiple filters often interact and are therefore easily confounded (Williams et al., 2008). Given the strong structuring forces of urbanization and flooding, and the expected role of the river as a dispersal corridor, urban riparian forests are an ideal model system to study the independent and synergistic effects of natural and anthropogenic filters on community composition, and to further unravel the role of these environmental filters from that of dispersal processes. The use of functional traits can further reveal the key mechanisms underlying community assembly by bridging the gap between shifts in community composition and environmental changes (Lavorel & Garnier, 2002; Mayfield et al., 2010). Using a trait-based approach, we address the following questions: In the context of forests both fragmented by urbanization and connected through the hydrological network, how is functional trait composition spatially structured and how important is dispersal by river currents in compared to overland dispersal? What are the key filters (local conditions, landscape context or spatial processes) that shape the functional composition of riparian forest communities in cities? We hypothesize that (1) directional dispersal by river currents will be more important in structuring community trait composition than overland dispersal by other vectors given the importance of hydrochory in riparian habitats; (2) urbanization and hydrological disturbances will lead to opposing trait patterns, with urbanization favoring high dispersal ability and light demanding species, and hydrological disturbances favoring flood tolerance and waterborne dispersal; and (3) hydrological disturbances will exert the strongest selection pressure, as numerous biological adaptations are needed for plant establishment in floodplains.
Methodology
Study area
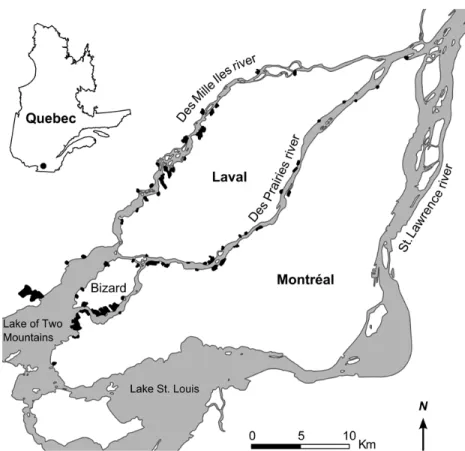
The study was conducted in riparian forests of the Greater Montreal region (Québec, Canada), principally along the shores of des Prairies and des Mille Iles rivers, as well as of the Lake of Two Mountains, a widening of the Ottawa River delta which split into distinct water masses that flow into both studied rivers (Fig. 2.1). These rivers flow from west to east and their flow is controlled by various dams, particularly during spring floods (CEHQ, 2014).
The study area is located within Canada’s second most populous metropolitan region, with a population of about 3.8 million inhabitants (Statistics Canada, 2015). The region was largely agricultural prior to the 1960s, especially along the shores. Urban development then began slowly, and from this period onwards farmland was converted to residential use. Currently, the area is dominated by impervious surfaces (59% of the area of the sampled municipalities, of which 41% is residential), but rural areas are still present (19%), especially along the north shore of des Mille Iles river, the east end of Laval Island, and on Bizard Island, while on the Island of Montreal rural areas are limited to a small portion of the north-west shores (Fig. 2.1).
Site selection and sampling design
Forests were selected using satellite imagery (1:5 000) and field reconnaissance surveys, according to forest size (area >0.4 ha) and vegetation structure (tree cover >80% and no turf). A total of 95 forests met these criteria, and 57 of these were selected (Fig. 2.1; see Table S2.1 in Supporting Information) to represent a gradient of size, spatial position (from
west to east), flood intensity (little to mostly flooded) and surrounding impervious surfaces (low to high; for methods, see the Environmental data sampling section below).
Within each selected forests, sampling plots were positioned along transects perpendicular to the shoreline. Each forest contained 2 to 4 transects according to the length of its shore to keep sampling effort similar among forests, namely: 2 transects for sites between 50 and 300 m long; 3 transects for sites between 301 and 500 m; and 4 transects for sites > 500 m. Each transect contained 2 or 3 plots, depending on the forest width. The first plot was located at the shore tree line and the second plot was located 10 m from the first. In forests wider than 90 m, a third plot was located farther from the shore, at about 50 m from the second. A total of 438 plots (from 4 to 12 per site) was sampled in the 57 forests.
Figure 2.1. Location map of the 57 riparian forests (in black) sampled in the Greater Montreal
Vegetation sampling
Field sampling was carried out from mid-July to mid-August 2013. Within forest patches, all plant species were identified within 100 m2 plots, 5 m × 20 m for the first plot (the length of the plot lying along the shoreline) and 10 m × 10 m for subsequent plots. Herbaceous and shrub species cover was assessed using seven classes: <1%, 1–5%, 6–25%, 26–50%, 51– 75% and 76–100%. The diameter at breast height (DBH) of each tree was estimated using the mid-range of four classes (10–20 cm; 21–30 cm; 31–40 cm; 41–50 cm) and measured directly for individuals > 50 cm. DBH values were used to calculate the total tree basal area in each plot.
Environmental data sampling
Local variables
All variables (Table 2.1) were extracted from satellite images and maps of the region using ArcGIS 10.1 software (ESRI, 2012). Each forest patch perimeter was delineated, and the area and perimeter:area ratio were calculated. A digital elevation model (1 m resolution; MMC, 2009) was used to estimate mean altitude and slope of each forest. The intensity of flooding was evaluated according to the proportion of the forest that is usually inundated during spring, using flood hazard maps of the area (MMC & CEHQ, 2005), a digital elevation model (1 m resolution; MMC 2009) and based on field surveys during spring floods (3 classes from little to mostly flooded; see Table 2.1).
The recent history of the studied forests was characterized through interpretation of aerial photos (1950–2010). Forest age was estimated as the time since the last major
disturbance. Past land use was categorized as either agricultural or human use, which included residences (that no longer exist), and wasteland (industrial wastelands, borrow pits or embankments). An index of forest area changes was compiled by averaging the ratio of all previous forest areas for each decade (1950 to 2010) relative to the current area. In general, forests were historically smaller than today, since most were once harvested in whole or in part.
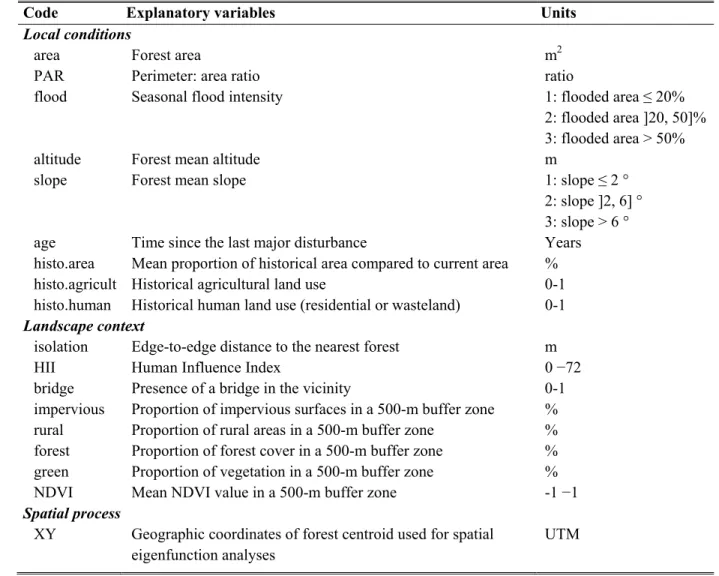
Table 2.1. Description of all explanatory variables characterizing the 57 riparian forests of the
Greater Montreal region (see Table S2.2 for correlations between variables).
Code Explanatory variables Units
Local conditions
area Forest area m2
PAR Perimeter: area ratio ratio
flood Seasonal flood intensity 1: flooded area ≤ 20%
2: flooded area ]20, 50]% 3: flooded area > 50%
altitude Forest mean altitude m
slope Forest mean slope 1: slope ≤ 2 °
2: slope ]2, 6] ° 3: slope > 6 °
age Time since the last major disturbance Years
histo.area Mean proportion of historical area compared to current area %
histo.agricult Historical agricultural land use 0-1
histo.human Historical human land use (residential or wasteland) 0-1 Landscape context
isolation Edge-to-edge distance to the nearest forest m
HII Human Influence Index 0 −72
bridge Presence of a bridge in the vicinity 0-1
impervious Proportion of impervious surfaces in a 500-m buffer zone % rural Proportion of rural areas in a 500-m buffer zone % forest Proportion of forest cover in a 500-m buffer zone % green Proportion of vegetation in a 500-m buffer zone %
NDVI Mean NDVI value in a 500-m buffer zone -1 −1
Spatial process
XY Geographic coordinates of forest centroid used for spatial eigenfunction analyses
Landscape variables
To assess the effect of the surrounding urban matrix on forests, the landscape was characterized in a 500 m buffer zone around each site (in accordance with Vallet et al., 2010) using land use maps (MMC, 2012). For each forest, we quantified the proportions of impervious surfaces (including transportation infrastructures and residential, commercial and industrial areas), green spaces (all vegetated areas including forests but excluding agricultural lands) and forests (areas dominated by trees). To assess vegetation density and quality near the studied forests, a Normalized Difference Vegetation Index (NDVI) was calculated using a satellite image (20 m resolution; Geobase, 2008). All pixel values (ranging from -1 to +1) in the buffer zone were average. Negative NDVI values indicate the absence or presence of sparse unhealthy vegetation, while positive values correspond to the presence of healthy vegetation. To include a more comprehensive measure of urbanization, we used the Human Influence Index (HII; WCS & CIESIN, 2005), which takes into account multiple human factors presumed to influence ecosystems (population density, roads, etc.). Using a map of the HII (1 km resolution), each forest was assigned the average index value of the pixels in the buffer zone. Finally, the edge-to-edge distance between each sampled forest and its nearest neighbor (> 0.5 ha) was measured to assess the degree of isolation.
Functional traits
Each species was characterized according to eight functional traits (Table 2.2; see Table S2.3 for raw data), which were selected to represent dispersal ability and tolerance to hydrological and anthropogenic disturbances. Some traits were selected to serve as surrogates of many others, e.g., the wetness coefficient substitutes several traits require to survive
waterlogging. Trait data were mainly extracted from the primary literature and published trait databases (Fitter & Peat, 1994; Kleyer et al. 2008; Michigan Flora 2011; Aubin et al. 2012).
Table 2.2. Description of the selected functional traits used in analyses.
Data analysis
Prior to analyses, species were separated into tree, shrub and herbaceous, to form three species-by-site matrices that were used individually. For each of the 57 forest patches, species importance values (IV), a measure of the relative dominance of a species in a community (Barbour, 1987), were computed. For trees, IVs were calculated as the mean of the relative
Functional traits Code Units/Scale Variable
Maximum height height cm Quantitative
Life cycle (herbs only) lifespan 0: annual 1: perennial
Nominal Shade tolerance shade 1: intolerant
2: mid-tolerant 3: tolerant
Ordinal
Wetness coefficient wetness 1: upland (almost never in wetlands)
2: facultative upland (occasionally in wetlands) 3: facultative (equally likely in wetlands and uplands) 4: facultative wetland (usually in wetlands)
5: obligate wetland (almost always in wetlands)
Ordinal
Seed weight seedWg ln(mg) Quantitative
Seed bank seedBk 1: transient
2: short-term persistent 3: long-term persistent
Ordinal
Vegetative reproduction veg 0: not possible 1: possible
Binary Dispersal vector endozoo
bird epizoo hydro anemo anthropo other
endozoochore (internal animal dispersal) bird dispersal
epizoochore (external animal dispersal) hydrochore (water dispersal)
anemochore (wind dispersal) anthropochore (human dispersal)
other (include unassisted, myrmechore, explosive)
density (number of individuals per forest relative to the total number of individuals of all species), relative frequency (number of plots per forest in which a species occurred relative to the total number of occurrences of all species) and relative dominance (basal area coverage per forest relative to the total basal area of all species). For herbs and shrubs, IVs were calculated as the mean of the relative frequency and the relative dominance (cover of a species per forest relative to the total cover of all species).
Mean functional traits for community
To assess the effects of environmental filters on functional composition, community weighted means of traits (CWM) were used in subsequent analyses (e.g., Garnier et al., 2004, 2007; Lavorel et al., 2008). Compiled in a site-by-trait matrix, CWM were obtained by matrix multiplication of the species-by-site matrix and the standardized species-by-trait matrix (trait standardization ensures equal weight for all traits, regardless of their units). Traits with less than 10% of occurrence for a specific plant form were discarded; for example, bird dispersal was not used for herbs. For continuous traits, CWM was the average value of a trait for all species in the community, weighted by their relative abundance. For ordinal and binary traits, CWM was the relative abundance of species for each trait state.
Modeling spatial structure
To assess the relative importance of non-directional and directional spatial processes in trait distribution, we compared two eigenvector-based spatial methods: distance-based Moran's eigenvector maps (dbMEM; Dray et al., 2006) and asymmetric eigenvector maps (AEM; Blanchet et al., 2008a). MEM analyses are meant to model symmetric spatial structures, which could emerge from non-directional plant dispersal (e.g., aggregation). In contrast, AEM are
explicitly designed to model directional patterns, which are expected in riparian ecosystems. Contrary to AEM, MEM analyses were carried out on detrended response variables, i.e., the significant linear trend in the direction of the hypothesized spatial process was removed prior to MEM calculation (Borcard & Legendre, 2002).
AEM and MEM eigenfunctions were computed using a connectivity matrix which summarizes the connections between the studied forests. The connection diagram was created based on interpretation of satellite imagery showing flow direction (see Fig. S2.1). Rivers in the study area, as well as prevailing summer winds, flow from the southwest to the northeast. Each river was treated as independent from the other. Forests located on the north shore of the Lake of Two Mountains were linked to those of des Mille Iles river, while forests on the south shore to those of des Prairies river. To properly model the distinction between both rivers, the AEM method of Blanchet et al. (2008a, 2011) was adapted (see Appendix S2.1).
For MEM, the connectivity matrix was weighted using between-site overland distances. For AEM, distances corresponded to watercouse distances, and a measure of river fragmentation associated with the presence of bridges and dams was also considered. The weighting functions were: (1) no weight (binary connection); (2) a linear function of the distances (f1 (dij) = 1 − (dij/max(dij))); (3) a concave-down function of the distances (f2 (dij) = 1 −
(dij/max(dij))2); and (4) river fragmentation (f = 1 - (0.2*nb of dams + 0.1*nb of bridges)). The
weight or combination of weights leading to the highest explained variation in the functional composition data was retained for further analyses. The best sets of AEM variables were produced considering a concave-down function of distances and river fragmentation for trees, a linear function of distances and river fragmentation for herbs and only river fragmentation for shrubs (see Table S2.4).
Only spatial functions modeling positive spatial correlation were used (selected using Moran’s I coefficients of spatial correlation). For each model, spatial variables were selected using a forward selection procedure (9999 permutations of residuals) based on two stopping criteria, the alpha significance level and the adjusted R2 of the global model including all explanatory variables of each subset, as proposed by Blanchet et al. (2008b). AEM and MEM models were then compared through variation partitioning to assess the directional and non-directional components of variation. Since AEM always yield a larger explained variation (see Results), they were used to model spatial processes in the subsequent analyses.
Partitioning environmental and spatial variation
The relative and unique importance of landscape context, local conditions and spatial processes in the variation of plant trait distribution was assessed by partitioning the variation explained by each subset using redundancy analyses (RDA; Borcard et al., 1992). First, to linearize the relationship between explanatory and response variables in the RDA models, explanatory variables were transformed when necessary (Table S2.5), after which they were standardized. Then, to obtain parsimonious RDA models for each of the three explanatory subsets, only variables selected using a forward selection procedure (9999 permutations of residuals) based on the two stopping criteria of Blanchet et al. (2008b) were retained (Table S2.4). Finally, variation partitioning analyses were computed from the parsimonious RDA for the three plant forms, and the significance of each unique fraction was obtained by 9999 permutations. In the analysis on shrubs, two forests were excluded, as their trait composition was highly divergent from that of other forests due to the concomitant dominance of an uncommon wetland species and the absence of an invasive species.
All statistical analyses were performed in the R environment (version 3.0.1; R Core Team, 2013). Canonical analyses, variation partitioning, and tests of significance of the fractions were computed using the ‘‘vegan’’ package. AEM eigenfunctions were created using the ‘‘AEM’’ package, while MEM were constructed using the ‘‘PCNM’’ package. Forward selection was computed using the ‘‘packfor’’ package.
Results
Directional vs non-directional spatial patterns
For tree and herb strata, only directional patterns were detected, explaining respectively 24% and 37% of the variation in functional composition (Fig. 2.2). For shrubs, both directional and non-directional significant patterns were found, explaining respectively 26% and 10% of the variation. However, the pure fraction of directional patterns prevailed (19%), while the non-directional patterns were nearly all confounded with the directional patterns.
Figure 2.2. Variation partitioning of trait composition (CWM) explained by the subsets of
selected AEM and MEM variables. Percentages in the partitioning are R2adj and P-values that were obtained through permutation tests (n=9999) of individual fractions.
Scales of spatial variation
Spatial structures were observed at broad, medium (except for herbs) and fine scales, the broad patterns usually being most important, as shown by their globally larger adjusted R2 (Fig. 2.3). The AEM6 (trees), AEM7 (shrubs) and AEM4 (herbs) functions all represented the distinction between the two rivers, and were the spatial patterns most correlated with plant trait variation. The first AEM function (AEM1) of the three plant strata models represented a strong gradient along des Prairies river, while the AEM6 of the shrub model represented a broad-scale gradient along des Mille Iles river. While spatial patterns, from broad to fine-scale, were exclusively found along des Prairies river for trees, they contributed equally to shrub trait variation along both rivers. For herbs, trait variations were identified primarily along des Prairies river (AEM1, 3 and 13), while fine-scale patterns were minor along des Mille Iles river (AEM15).
Partitioning trait variation between environmental filtering and spatial
processes
Local, landscape and spatial variables together explained about 40% of changes in the functional composition of trees and shrubs and about 51% of herbs (Fig. 2.4 a–c). Trait
Figure 2.3. Maps of selected AEM functions, reflecting patterns at different spatial scales, for
tree, shrub and herb CWM data along des Mille Iles (north) and des Prairies (south) rivers. The first functions model large-scale spatial structures, while the following functions model increasingly fine structures. Maps are organized to show similar patterns on each row. Square size is proportional to value; positive values are in black and negative values in white. The explanatory power of each function (R2adj) shows the relative importance of an individual
composition was primarily structured by local conditions (trees: 34%; shrubs: 23%; herbs: 41%), and mostly by seasonal flood intensity (flood), as this variable alone had the highest explanatory power among all variables (trees: 22%; shrubs: 12%; herbs: 28%; Table S2.5). Most of the variance explained by the local subset was shared with landscape, and particularly with spatial variables. The fraction shared by the three subsets had a strikingly high adjusted R2 compared with individual fractions, suggesting that local and landscape subsets together presented a strong spatial structure. Hence, although landscape context alone was less important in structuring functional composition, its influence was exerted through change in local conditions, especially for herbs. Still, the significance of the pure directional spatial fraction indicates that a directional process, other than the inherent spatial structure of the environment, acts on trait distribution. These pure spatial patterns were as important as local conditions (about 8%) in structuring shrub trait composition.
The first RDA axis of each plant form represents a flooding intensity gradient paralleled by an urban-to-rural gradient (Fig. 2.4 d-f). Forests associated with rural areas (right side of the plots) were associated with high vegetation cover (represented by forest, green or NDVI variables) and were subject to more severe flooding than urban forests. On the other end of the gradient (left side of the plots), urban forests were characterized by steep slopes, a high perimeter:area ratio (PAR), as well as a large proportion of impervious surfaces and a frequent occurrence of bridges in their vicinity. Along this gradient ranging from flooded rural forests to drier urban forests, AEM1 (modeling a linear gradient along des Prairies river for all plant groups) and AEM 6, 7 and 4 variables (modeling the distinction between both rivers for trees, shrubs and herbs respectively) were opposed to flooding intensity indicating that floods are more intense on des Mille Iles river and westward of des Prairies river.
As expected, flood intensity favored hydrochorous (hydro) wetland species (wetness) for all plant forms. In highly flooded forests located in rural areas, trees were taller (height) and mostly bird-dispersed, but also animal- (endozoo) and human-dispersed (anthropo). On the contrary, shrubs were taller and principally animal- or human-dispersed in drier urban forests. Dry forests in urban settings were dominated by annual herbs bearing wind-dispersed (anemo) or heavy seeds (seedWg), which were, as for shrubs, principally animal- (endozoo and epizoo) and human-dispersed. On the other hand, vegetative reproduction (veg) was favored in flooded rural forests.
Secondary to the urban-flooding gradient, a successional gradient also appeared in the three ordinations. Following the historical variables related to human activities (histo.human, which describes historically disturbed forests, and histo.area, which describes historically large forests), this gradient ranged from recently disturbed to old ‘pristine’ forests. This gradient contributed to the variance in the second axis and appeared perpendicular to the flood gradient (parallel to the second axis) for trees, crosswise for shrubs and almost parallel for herbs (almost parallel to the first axis). This decreasing distinctiveness of the successional gradient among the three life forms was also depicted by the decreasing variance explained by the second axis. Along this gradient, young, recently disturbed forests were dominated by human-dispersed (anthropo) trees, shrubs and herbs, wind-dispersed trees, and shrubs with a long-lived seed bank (seedBk). In contrast, old ‘pristine’ forests were dominated by shade-tolerant (shade) trees, shrubs and herbs, heavy-seeded (seedWg), animal-dispersed (endozoo) and long-lived seed banking trees, and perennial (lifespan) herbs.
Discussion
The interplay between local, landscape and spatial filters
In this study, we showed that under severe natural disturbance regimes, the effect of natural filters outweighed the negative effects of urban filters, since seasonal flood intensity was the most important variable in explaining plant trait community composition (Fig. 2.4 d–f, Table S2.5). Nonetheless, the antagonism between flood and urbanization variables in the ordinations, coupled with the important shared fraction between the local, landscape and spatial subsets, indicated that urbanization also played a significant role by indirectly influencing traits through alteration of the hydrological regime. Urbanization also likely fostered a successional gradient in more mesic riparian forests, since species traits, notably for trees, differed between young disturbed and old ‘pristine’ forests. This result suggests that as flood intensity decreases, its filtering effect is relaxed and other filters associated with succession induced by human disturbances become more important in community assembly.
Figure 4. Variation partitioning (a, b, c) and ordination diagrams (d, e, f) of CWM
explained by the subsets of local, landscape and spatial variables. Percentages in the partitioning are R2adj and circle sizes are their approximation. P-values were obtained by permutation tests of individual fractions. Grey vectors are the explanatory variables; round end vectors are for local variables; arrow end vectors are for landscape variables; vectors without an end mark are for spatial variables (AEM vectors were named by the numbers corresponding to those of Figure 3). Response variables (black crosses) should be interpreted as vectors. See Table 2 for trait codes. The square terms of polynomial transformed variables model the non-linear (quadratic) relationship between the response and explanatory variables.