1 Original article
1
DURATION OF XYLOGENESIS IN BLACK SPRUCE LENGTHENED BETWEEN 1950 2
AND 2010 3
Jacqueline Boulouf Lugo, Annie Deslauriers, Sergio Rossi* 4
Département des Sciences Fondamentales, Université du Québec à Chicoutimi, Chicoutimi, 5
Canada 6
*Corresponding author: Département des Sciences Fondamentales, Université du Québec à 7
Chicoutimi, 555 Boulevard de l'Université, Chicoutimi (QC), Canada G7H2B1. Email: 8
sergio.rossi@uqac.ca 9
Running title: trends in cambium phenology 10
2 ABSTRACT
12
Background and Aims Reconstructions have identified the 20th century as uniquely warm in 13
the last 1000 years. Changes in phenology of the primary meristems converged toward 14
increases in length of the growing season. Has the phenology of secondary meristem changed 15
during the last century, and to what extent? 16
Methods Timings of wood formation in black spruce [Picea mariana (Mill.) B.S.P.] were 17
monitored for nine years on a weekly time-scale at four sites in the boreal forest of Quebec, 18
Canada. Models for assessing xylem phenology were defined and applied to reconstruct 19
onset, ending and duration of xylogenesis between 1950 and 2010 using thermal thresholds 20
on chronologies of maximum and minimum temperatures. 21
Key Results All sites exhibited increasing trends of both annual and May-September 22
temperatures, with the greatest changes observed at the higher latitudes. Phenological events 23
in spring were more affected than those occurring in autumn, with cambial resumptions 24
occurring 0.5-0.8 days decade-1 earlier. Duration of xylogenesis has significantly lengthened 25
since 1950, although the models supplied wide ranges of variations, between 0.07 and 1.5 26
days decade-1, respectively. 27
Conclusions The estimated changes in past cambial phenology demonstrated the marked 28
effects of the recent increase in temperature on the phenological traits of secondary 29
meristems. In the long run, the advancement of cambial activity could modify the short time 30
window for growth of the boreal species and dramatically affect the dynamics and 31
productivity of trees in these temperature-limited ecosystems. 32
3 Keywords: boreal forest, cell differentiation, Picea mariana, threshold temperature, wood 33
formation, xylogenesis 34
4 INTRODUCTION
36
Hemispheric-scale reconstructions of surface temperature fluctuations over the last millennium 37
have identified the 20th century as uniquely warm (cf. Hughes, 2002). Although an increase in the 38
global temperature of between 1.4 and 5.8 °C is expected during the period 1990-2100, the 39
greater increases are predicted to occur at the higher latitudes of the northern hemisphere (IPCC, 40
2007). For the boreal forest of North-Eastern Canada, climatic models predict increases in 41
temperature of up to 3 °C over the next 50 years, with the largest increases occurring in winter 42
and spring, when plant growth resumes (Plummer et al., 2006). In cold ecosystems, the growing 43
season is strictly defined by the harsh winter temperatures (Rossi et al., 2008b, 2011b). Such 44
climate modifications could thus severely affect the growth timings and dynamics of the boreal 45
species, with consequent changes in productivity of biotopes that have obvious ecological 46
importance and economic potential. 47
The interest in the cold forests of high altitude and latitude is linked to various causes such as the 48
short growing season and high sensitivity of the species to climate changes (Körner, 2003a). 49
Plants of these ecosystems are assumed to be good indicators of changes in their environment 50
(Pisaric et al., 2003). With the current changes in temperature, possible variations in phenology – 51
the study of the timings of recurring seasonal biological events – have acquired particular 52
importance worldwide. According to Forrest and Miller-Rushing (2010), interest has been 53
focused on documenting the recurrent appearance of the first flower blossoms or bud bursts in 54
spring, the dates of animal migration, or timings of the first frost-damaged leaves in autumn. The 55
longest monitoring periods in plants are concentrated in the botanical gardens of temperate 56
Europe and concern the effects of such changes on the growth dynamics of the primary 57
5 meristems (buds, leaves and flowers). There is no historical documentation on the phenology of 58
the secondary meristem, the cambium, because it is not a macroscopically perceptible 59
phenomenon like leaf development or flower maturation. Cambial activity occurs beneath the 60
bark and, in high-latitude forests, produces a number of xylem cells that increases the stem 61
diameter annually by one tree ring, which integrates the effects of climatic events occurring 62
during the season when the cambium was active (Frankenstein et al., 2005). Tree rings have thus 63
been used as a tool to explore the long-term growth reactions to historical climate variations 64
(Huang et al., 2010). However, to our knowledge, retrospective studies concerning 65
reconstructions of cambium phenology are still lacking due to the very recent identification and 66
application of the standard procedures of analysis (Rossi et al., 2006a, 2006b; Seo et al., 2008; 67
Gričar et al., 2009). 68
Analyses on the variations in the concentrations of CO2 in the atmosphere showed that the
69
biospheric activity increased remarkably as a result of warming surface air (Myneni et al., 1997). 70
This implies that even small changes in global temperature may be reflected by disproportionate 71
responses at regional level that can markedly influence all biological processes, in particular 72
those concerning growth. Although several endogenous variables can influence the dynamics of 73
xylem formation (Marion et al., 2007; Rossi et al., 2008a; Rathgeber et al., 2011, Anfodillo et 74
al., 2012), temperature remains the main driving factor in cold environments. A local overheating 75
in spring can reactivate cambium, inducing the conversion of starch reserves into sucrose for the 76
activation of cell division and production of secondary xylem (Begum et al., 2007; Gričar et al., 77
2007). Deslauriers et al. (2008) observed that the higher temperatures occurring in spring 2003 78
led to earlier onsets of division and differentiation of xylem cells. The onset of xylogenesis 79
influences the number of cells produced by the cambium which, in turn, influences the ending of 80
6 cell differentiation (Lupi et al., 2010; Rossi et al., 2012). Several studies in cold environments 81
demonstrated that a certain temperature, in the form of heat sum or thermal threshold, is 82
necessary to enable the cambium to divide (Rossi et al., 2008b; Seo et al., 2008; Swidrak et al., 83
2011). Rossi et al. (2011b) simulated several warming scenarios to predict changes in xylem 84
phenology. The model predicted longer duration of xylem growth at higher temperatures, with 85
increases of 8-11 days/°C because of an earlier onset and later ending of growth. Twenty-five 86
percent longer durations of xylogenesis were predicted with an increase of 3 °C in the mean 87
annual temperature (Rossi et al., 2011b). 88
Although substantial increases in temperature were observed during the last 100 years, with the 89
mean surface temperature rising by 0.7 °C at global scale and by 0.5-1.5 °C across North 90
America since the late 19th century (Zhang et al., 2000; IPCC, 2007), the rate of warming over 91
the last 50 years (0.13 °C decade-1) is almost double that over the last 100 years (IPCC 2007). For 92
the northern regions of North America, McKenney et al. (2006) estimated increases attaining 93
0.26 °C decade-1 in the second half of the 20th century. The question is if and to what extent the 94
modifications in air temperature during this period have affected cambial phenology. The model 95
developed by Rossi et al. (2011b) simulated a potential xylem phenology under a possible and 96
simplified climate warming, represented by a uniform increase in air temperature. However, no 97
information was provided about changes in the timings of cambial growth occurring in the past. 98
Moreover, there is evidence of divergent effects of climate change on the seasonal temperatures, 99
with spring having the greater warming (Zhang et al., 2000). Improvements in the precision of 100
the models of cambial growth are thus expected to produce results consistent with the more 101
realistic climatic scenarios. 102
7 This paper aimed to reconstruct timings of cambium phenology over the last 60 years in Quebec, 103
Canada. This was done by (i) collecting and analyzing a dataset of cambium phenology and wood 104
formation in black spruce [Picea mariana (Mill.) B.S.P.] based on a weekly monitoring for 9 105
years in four permanent sites at different latitudes and altitudes, (ii) defining and validating a 106
phenological model of xylem based on the air temperature measured in the sites, and (iii) 107
applying the phenological model on the chronologies of air temperature generated for the period 108
1950-2004 by the ANUSPLIN model (McKenney et al., 2006). The effects of climate change on 109
plants have mainly been demonstrated by changes in the phenology of primary meristems, which 110
have revealed marked increases in length of the growing season (Menzel, 2000; Zhou et al., 111
2001; Sparks and Menzel, 2002; Badeck et al., 2004). Thus, according to the results provided on 112
primary meristems, the hypothesis that duration of xylogenesis has lengthened since 1950 was 113
tested by the model. 114
8 MATERIALS AND METHODS
116
Study area and xylem sampling 117
The study was conducted on black spruce in the Saguenay-Lac-Saint-Jean area, in the boreal 118
forest of Quebec, Canada. Four sites [Simoncouche (abbreviated as SIM), Bernatchez (BER), 119
Mistassibi (MIS) and Camp Daniel (DAN)] were identified in mature even-aged stands at 120
different altitudes and latitudes to obtain as wide as possible a range in the dynamics of tree 121
growth (Table 1). Details on site characteristics were provided by Rossi et al. (2011b). 122
In each site, tree-ring formation was studied from April to October during 2002-2010 in 5 (2002-123
2005) and 10 (2006-2010) trees. Wood microcores were collected weekly following a spiral 124
trajectory on the stem from 30 cm below to 30 cm above breast height (1.3 m) using surgical 125
bone sampling needles in 2002-2006 and Trephor in 2007-2010 (Rossi et al., 2006a). Samples 126
usually contained the previous 4-5 tree rings and the developing annual layer with the cambial 127
zone and adjacent phloem. Samplings were always taken at least 5 cm apart to avoid getting resin 128
ducts on adjacent cores. 129
The microcores were stored in ethanol solution (10% in water) at 5 °C to avoid tissue 130
deterioration. Microcores were dehydrated with immersions in ethanol and D-limonene and 131
embedded in paraffin (Rossi et al., 2006a). Transverse sections of 6-10 µm thickness were cut 132
from the samples with a rotary microtome, stained with cresyl violet acetate (0.16% in water) and 133
examined within 10−25 minutes under visible and polarized light at magnifications of 400−500× 134
to differentiate the developing and mature xylem cells. Occasionally, distorted rows of cells 135
9 prevented a adequate analysis of the sample. In these cases, the sections were gently stressed on 136
the slide with thin needles to better observe all cells of the developing tree ring. 137
Microscopic observations 138
In each sample, the radial number of cells in the cambial zone, radial enlargement phase, cell wall 139
thickening phase, and mature cells were counted along three radial rows. In cross section, 140
cambial cells were characterized by thin cell walls and small radial diameters (Rossi et al., 141
2006b). The dormant cambium was composed of 3-5 closely-spaced cells. At the onset of 142
cambial activity, the cambial zone began to widen rapidly as the number of cells increased, 143
revealing that cell division had started. During cell enlargement, the tracheids were composed of 144
a protoplast still enclosed in the thin primary wall but with radial diameter at least twice that of a 145
cambial cell. Observations under polarized light discriminated between enlarging and cell wall 146
thickening tracheids (Thibeault-Martel et al., 2008). Because of the arrangement of cellulose 147
microfibrils, the developing secondary walls were birefringent when observed under polarized 148
light. Instead, no glistening was observed in enlargement zones, where the cells were still 149
composed of just primary wall (Abe et al., 1997). Lignification was detected with cresyl violet 150
acetate by a color change from violet to blue. The color change over the whole cell wall revealed 151
the end of lignification and the tracheid reaching maturity (Gričar et al., 2005). 152
The cell number in the 3 rows was averaged for each tree and used to assess onset and ending of 153
xylogenesis. In spring, when at least one tangential row of cells was observed in the enlargement, 154
xylem formation was considered to have begun. In late summer, when no further cell was 155
observed in wall thickening and lignification, xylem formation was considered complete. The 156
10 duration of xylogenesis was assessed as the number of days occurring between onset and ending 157
of xylogenesis and was calculated as the average among trees for each studied site and year. 158
Datasets of air temperature 159
Two datasets of air temperature were used in this study and consisted of time series (i) measured 160
in the four sites and (ii) estimated by a climatic model. Measured and estimated temperatures 161
were used for the definition and application of the phenological model, respectively. For the first 162
dataset, a standard weather station was installed in 2001 in a forest gap on each site. Air 163
temperature data were collected at 3 m above ground level every 15 minutes and recorded as 164
averages every hour by means of CR10X dataloggers (Campbell Scientific Corporation, Canada). 165
Maximum and minimum values were later calculated from the 24 measurements per day. The 166
second dataset consisted of air temperatures generated at a daily resolution for the period 1950-167
2004 by the ANUSPLIN model of the Canadian Forestry Service. This model used a multi-168
variate non-parametric surface and point fitting approach to estimate the time series of maximum 169
and minimum temperature corresponding to the location of each site according to the algorithm 170
described by McKenney et al. (2006). To verify the consistency of the modeled time series, linear 171
regressions were performed between the measured and estimated temperatures for the 172
overlapping years (2002-2004). 173
Definition and validation of the phenological model 174
The model consisted in applying thermal thresholds for estimating xylem phenology using 175
logistic regressions to calculate the probability of xylem growth being active at a given measured 176
daily temperature. According to Rossi et al. (2011b), binary responses were coded as non-active 177
11 (value zero) or active (value 1) growth, and temperature thresholds were calculated when the 178
probability of xylem growth being active was 0.5. For each site and year, the model was fitted 179
with minimum and maximum temperature series and results from each site were compared by 180
analysis of variance (ANOVA) and Tukey’s test. None of the 72 estimated functions was 181
excluded because of lack of fit. Model validation was performed according to Legendre and 182
Legendre (1998) by comparing the observations with the predicted values calculated using the 183
estimated temperatures. A classification table was produced in the form of a contingency table, 184
which for each day compared the observed active or non-active xylem growth to that predicted by 185
the model. 186
Application of the phenological model 187
A quadratic logistic regression was applied on the time series of daily temperatures generated by 188
the ANUSPLIN model, with binary responses coded as 0-1 if temperatures were lower or higher 189
than the threshold, respectively. The two solutions of the quadratic regression corresponded to 190
the days of the year when the probability of temperature being higher than the threshold was 0.5, 191
and included the period of xylem growth (Rossi et al., 2011b). The phenological model was 192
iteratively applied to the temperature series of each site to estimate changes in the timings of 193
xylem growth. The resulting time series, which consisted of the dates of onset and ending of 194
xylogenesis from 1950 to 2010, were tested for the presence of autocorrelation until the fourth 195
order (McKenney et al., 2006). Since no autocorrelation was observed for the onset of 196
xylogenesis and the errors were only occasionally serially correlated at the second and third order 197
for ending and duration of xylogenesis, the long-term trends were analyzed by Analysis of 198
Covariance (ANCOVA). 199
12 RESULTS
201
Observed and modeled temperatures 202
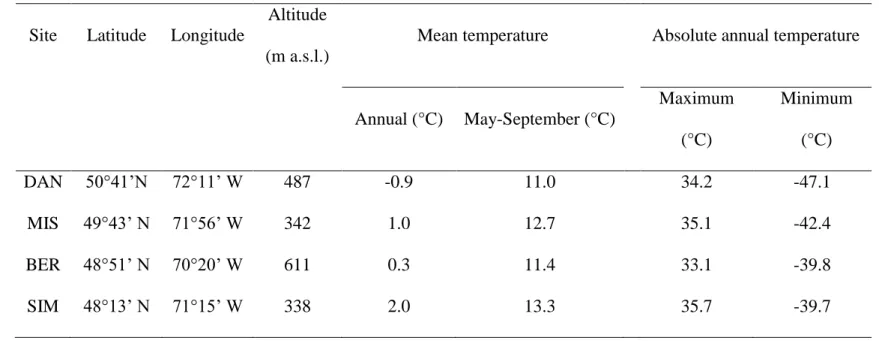
The region has a typical boreal climate with cold winters and cool summers (Table 1). The mean 203
annual temperature in the four study sites varied between -0.9 and 2.0 °C while May-September 204
temperature was 11.0-13.3 °C. The sites are characterized by long winters with temperatures 205
close to or below zero, with the coldest generally being measured in January and reaching -47.1 206
°C in DAN in 2009. The summers are short with absolute temperatures exceeding 30 °C in all 207
sites (Table 1). The warmest maximum temperatures were observed in 2002 in all sites. The 208
temperature patterns were synchronous across the four study sites, with the coldest being DAN 209
and BER, those located at the highest latitude and altitude, respectively. SIM was the warmest 210
site both for annual and May-September temperatures (Supplementary data Fig. S1). The hottest 211
year was 2010, which globally showed the highest annual temperatures, although high May-212
September maximum temperatures were also observed during 2005. The lowest maximum and 213
minimum temperatures were detected in 2004. 214
The regressions indicated correlations between measured and modeled temperatures with R 215
square varying between 0.56 and 0.94 (Supplementary data Table S1). The stronger relationships 216
were found for the annual maximum temperature, which on average showed an R square of 0.93. 217
SIM exhibited the lowest R square while DAN and MIS were the sites with the higher R square 218
for both the annual and May-September temperature. Overall, statistics confirmed that modeled 219
data could represent the temperatures occurring in the four study sites during 1950-2001. 220
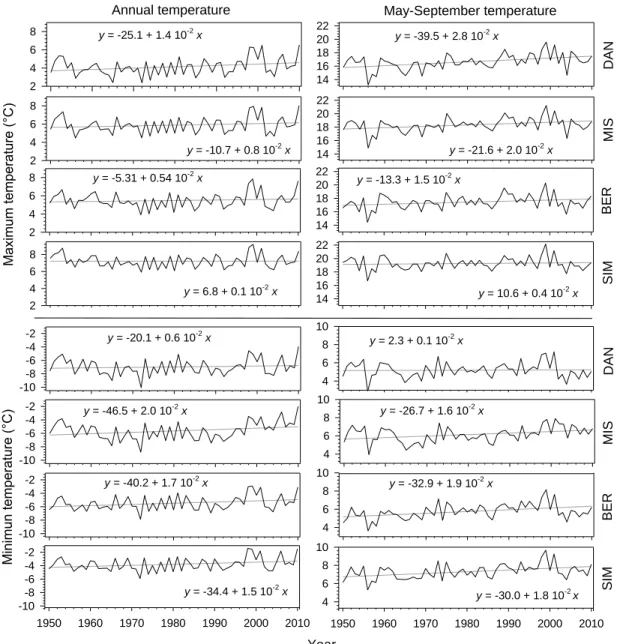
13 The positive slopes of the regressions performed on the temperature series for the period 1950-221
2010 indicated an increasing trend of both annual and May-September temperatures, although all 222
models showed p>0.05 (Fig. 1). The highest slopes were observed for maximum temperatures of 223
May-September with increases of 0.04-0.28 °C decade-1. Overall, lower slopes were estimated for 224
annual temperature than for May-September temperature except for the minimum temperature in 225
DAN and MIS. A clear pattern of change in the slopes with latitude was noticeable, with the 226
greater increases in maximum temperature being observed at the higher latitudes, although this 227
pattern was less obvious for minimum temperature. 228
The deviation from the 60-years average was calculated for the temperature series 229
(Supplementary data Fig. S2). The 1960s were characterized by below-average values of both 230
minimum and maximum temperatures of May-September. However, a similar pattern was not 231
detected for the annual temperature. From 1970 to 1998, values were located around the average. 232
After those years, both annual and May-September temperatures were clearly above the historical 233
average, with the greater deviations for the maximum temperature of May-September. 234
Model definition and validation 235
At the four sites, xylem growth lasted between 80 and 133 days, with SIM having the longest 236
duration (Fig. 2). Overall, the onset of xylem growth occurred from mid-May to mid-June (DOY 237
139-166), covering a range of c.a. one month. Later onsets of xylogenesis were detected in 2002 238
and 2009 and at the highest altitude and latitude, in BER and DAN, respectively. The ending of 239
xylem growth differed by more than one month between the end of August in BER, MIS and 240
DAN, and the beginning of October in SIM. 241
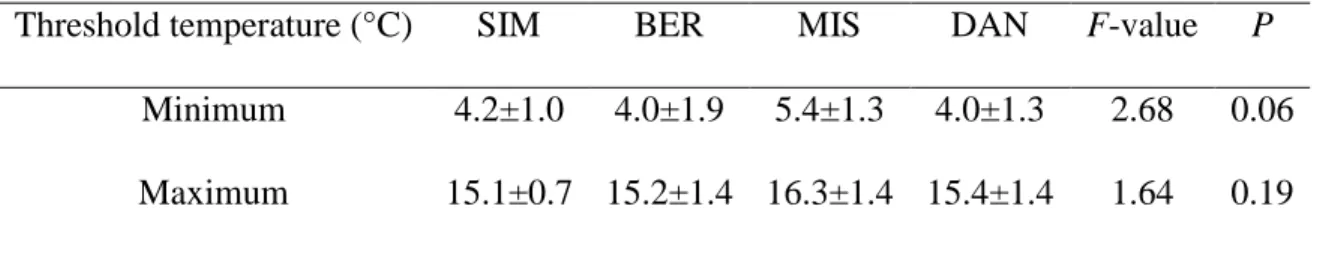
14 On average, the logistic regressions assessed the temperature thresholds at 4.4 and 15.5 °C for 242
minimum and maximum temperature, respectively (Table 2). For a temperature above the 243
calculated thresholds, xylem growth was more likely to be active than non-active. Although MIS 244
had slightly higher values compared with the other sites, no significant difference was detected 245
by ANOVA for either minimum or maximum temperature (P>0.05, Table 2). 246
The results generated by the logistic regressions were verified by forecasting the presence or 247
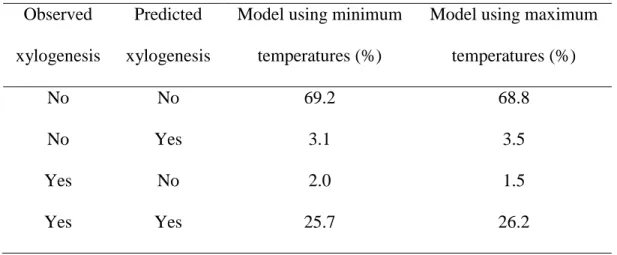
absence of xylem growth in the study sites and comparing results by means of a contingency 248
table (Table 3). Overall, observations showed that xylem growth was active during about one 249
third of the year and not active during 72.3% of the year. For minimum and maximum 250
temperatures, 94.9 and 95.0% of the predictions were confirmed by observations, respectively, 251
confirming that the model with both temperatures produced reliable estimations of the thresholds 252
and suitably predicted timings of the phenological phases of xylem. On average, not active and 253
active xylem growth was correctly predicted for 69.0 and 25.9% of days, respectively, while the 254
predictions were not confirmed for only 1.5–3.1% of days. 255
Model application 256
The model generated using the threshold temperatures was used for estimating chronologies of 257
cambium phenology (onset, ending and duration of xylogenesis) for the period 1950-2010 (Fig. 258
3). Long-term trends of all series were tested using ANCOVA, which calculated models with R 259
square ranging between 0.36 and 0.60 and significance p<0.0001 (Table 4). Predictions of the 260
models using both minimum and maximum temperatures showed significant negative trends in 261
all sites (p<0.05), revealing an earlier onset of xylogenesis that was estimated by the slope of the 262
regression at 0.5-0.8 days decade-1. Significant slopes for the ending of xylogenesis were detected 263
15 only with the model using minimum temperatures, which indicated a delay of 0.7 days decade-1 264
(Table 4). Longer durations of xylogenesis were predicted for the period 1950-2010, with the 265
higher (1.5 days decade-1) and lower (0.07 days decade-1) increases estimated by the model using 266
minimum and maximum temperatures, respectively. Significant differences among sites were 267
found for all phenological models (P<0.0001, Table 4), with SIM having earlier onsets, later 268
endings and longer durations of xylogenesis over all chronologies (Fig. 3). Differences in 269
cambial phenology among BER, MIS and DAN were less marked. No significant interaction 270
year×site was observed by ANCOVA (p>0.05, Table 4). 271
16 DISCUSSION
273
Compared with the primary meristems such as leaves and buds, analyses on the phenology of the 274
secondary meristem have only been emerging in the last decade. At the time of writing, the 275
chronologies of cambial phenology deriving from direct observations are spatially and temporally 276
fragmented (Rossi et al., 2008b; Moser et al., 2010; Rathgeber et al., 2011; Swidrak et al., 2011), 277
which prevents the understanding of long-term responses of the cambium to environmental 278
changes and any interpretation of the trends over time (Sparks and Menzel, 2002). This paper 279
thus aimed to reconstruct timings of cambium phenology of black spruce over the last 60 years to 280
test the hypothesis that duration of xylogenesis has lengthened since 1950. In the boreal forest, 281
wood formation is restricted within 3-4 months by thermal limits that characterize the change 282
between favourable and unfavourable periods for growth. In spring, cambial reactivation occurs 283
from mid-May to mid-June, when the temperatures allow snow to melt and soil to warm up 284
(Rossi et al., 2011a). Mature xylem is observed in September, when all cells have concluded 285
differentiation, which corresponds to nighttime temperatures of 4-5 °C, and maximum 286
temperatures reaching 15-16 °C. For the first time, long-term chronologies of cambial phenology 287
are provided, which allows investigation of the impact of past increases in temperature on wood 288
formation. The dynamics and periods of xylem growth and their eventual changes over time are 289
of particular interest for the global carbon budget as they define the period of main biomass 290
accumulation in wood, during which trees act as an important sink of the carbon sequestrated 291
from the atmosphere. An extending period of tree growth associated with warmer temperature 292
could allow cambial cells to divide more vigorously and longer, thus producing wider tree rings 293
and greater amounts of wood. 294
17 Trends of temperature and phenology
295
The chronologies generated by the ANUSPLIN model (McKenney et al., 2006) for the four study 296
sites exhibited increasing trends of both annual and May-September temperatures between 1950 297
and 2010. In some cases, the modeled climatic data were only partially correlated with 298
measurements, and this may be explained by the remote location of the sites and by the scarcity 299
of nearby weather stations used for the climatic modeling. The greatest changes were observed 300
for maximum temperature at the higher latitudes, attaining increases of up to 0.28 °C decade-1 in 301
DAN, the most northern site. For a similar period (1950-1998), Zhang et al. (2000) estimated that 302
the higher increases in temperature for this region occurred in summer, with values ranging 303
between 1.0 and 1.5 °C. Plummer et al. (2006) showed different trends for Quebec, with 304
temperature rising by up to 6 °C in all seasons except in early spring, before the observed onset 305
of xylogenesis. Our temperature chronologies exhibited a higher warming than the estimations of 306
Zhang et al. (2000) and were more conservative than those of Plummer et al. (2006). 307
Changes in phenology of the primary meristems represents one of the best-documented effects of 308
climate change on plants, with results converging toward increases in length of the growing 309
season (Zhou et al., 2001; Sparks and Menzel, 2002; Badeck et al., 2004). In Canada, Beaubien 310
and Freeland (2000) reported that the first flowering date of aspen poplar showed a marked trend 311
of earlier flowering with an advance of 26 days over the period 1900-1997. For the northern 312
hemisphere, Schwartz et al. (2006) estimated that during 1955-2002 the dates of first leaf and 313
first bloom have been 1.2 and 1.0 days decade-1 earlier. Greater advances of 2.1 days decade-1 314
were calculated between 1951 and 1996 for leaf unfolding in Europe (Menzel, 2000). Despite 315
similar lengths of the study periods, the results vary widely, which could be explained by the 316
18 complex origin (observations or estimations) and nature (leaf or flower buds) of the datasets and 317
species over the broad spatial scales of analysis. Moreover, a high heterogeneity in change of 318
temperature has been observed across North America, with lower effects of warming occurring in 319
the eastern part of the continent, where this work was carried out (Schwartz et al., 2006). Overall, 320
the hypothesis that duration of xylogenesis has lengthened over the last 60 years has been 321
confirmed, although the estimated increasing trends of cambial phenology exhibited lower slopes 322
than those observed in the primary meristems. 323
Does phenological cascade prevent estimating the end of xylogenesis? 324
In Europe, the beginning of the growing season has advanced by 2.7 days decade-1 in the last 30 325
years, while its ending showed smaller annual variations and has occurred just 1 day decade-1 326
later (Chmielewski and Rötzer, 2001). Sparks and Menzel (2002) definitely confirmed that earlier 327
events were more variable and changed faster than later events. This was consistent with our 328
results, which showed more marked changes in the spring onset than in late-summer ending of 329
xylogenesis, and contrasting slopes and significances were observed over the study period from 330
the trends of ending of xylogenesis. During development, the cambial derivatives (i.e. the cells 331
produced by cambial division) alter both morphologically and physiologically, progressively 332
assuming definite features. In other words, cells differentiate into the specific elements of the 333
stem tissues, represented by the phases of enlargement, wall thickening and lignification. 334
Investigations into xylem phenology and climate-growth relationships have focused mainly on 335
the onset of the growth process, i.e. onset of xylem production or differentiation, while the end of 336
growth still remains partly or completely unexplored (Gričar et al., 2007; Rossi et al., 2007; Seo 337
et al., 2008; Turcotte et al., 2009). According to our findings, this could essentially be due to a 338
19 greater number of significant responses being obtained between onset of growth and climate 339
rather than a mere lack of interest in the final phases of the growth process (Hänninen and 340
Tanino, 2011). 341
In cold environments, cell production is closely related to xylem phenology (Lupi et al., 2010; 342
Rossi et al., 2012). The date of onset of xylogenesis affects the number of cells produced by the 343
cambium which, in turn, influences the ending of cell differentiation. As a result, earlier cambial 344
resumptions lengthen the period available for cell division in the secondary meristem, increasing 345
the growth potential during the year (Gričar et al., 2005; Deslauriers et al., 2008). In conifers, 346
wider tree rings (i.e. with higher amount of cells) require a longer period for differentiating and 347
maturing the tracheids, which delays the ending of wood formation. Thus, any environmental 348
factor affecting the resumption of growth in spring could indirectly influence the production and 349
temporal dynamics of cell differentiation by affecting all successive phenological phases of 350
xylem (Rossi et al., 2006b). The hypothesis of an indirect effect of environment on the chain of 351
phenological events in the xylem provides valuable cues for identifying the relative importance of 352
the factors affecting timings and dynamics of xylem growth, and makes the relationships between 353
the temperatures occurring in late-summer and the date of ending of xylem growth more 354
complex. 355
Model and thermal predictors of xylogenesis 356
Several methods have been applied to investigate plant growth and its changes over time. 357
Definitions of the growing season differ according to plant species, and are calculated in different 358
ways, either directly (bud or cambial phenology), or indirectly (thermal sums, days with air and 359
soil temperatures above certain thresholds, freezing days) (Nizinski and Saugier, 1988; Körner 360
20 and Paulsen, 2004; Schwartz et al., 2006; Seo et al., 2008). In our reconstruction of past cambial 361
phenology, the applied temperature thresholds were not defined a priori. They were instead 362
statistically assessed on a wide dataset of observations collected weekly from four permanent 363
plots over nine years, by defining a binary response of presence or absence of growth, and 364
modeling the logistic response probability according to a vector of explanatory variable, either 365
minimum or maximum temperature. The resulting temperature thresholds have the advantage of 366
being objectively assessed and statistically validated, and are as close as possible to the biological 367
limits of the growth process in the stem. However, the definition of the model assumed a linear 368
response of cambial phenology to temperature, which is expected to occur only for narrow 369
thermal ranges. 370
In this study, the minimum and maximum temperature thresholds allowing xylogenesis ranged 371
between 4-5 °C and 15-16 °C, respectively, which confirm previous findings from other conifer 372
species of cold climates (Rossi et al., 2008b; Swidrak et al., 2011) but contrast with the 373
hypothesis of a cumulated effect of temperatures for cambial resumption (i.e. heat sums, Seo et 374
al., 2008; Swidrak et al., 2011). Cambium is a sink for carbohydrates, and its activity requires a 375
continuous supply of energy in the form of sucrose which, for the first cells to be formed, is 376
extracted from the storage tissues or produced by photosynthesis (Oribe et al., 2003; Deslauriers 377
et al., 2009). During cell maturation, trees assign a large amount of carbon obtained from 378
photosynthesis to the deposition of cellulose microfibrils in order to provide the developing cells 379
with secondary walls. The thresholds estimated in this paper could represent the critical 380
temperatures limiting the demand for photo-assimilates by the metabolic processes involved in 381
cell growth. Moreover, as xylogenesis is the most important net accumulation of biomass in 382
forest ecosystems, knowledge about the climatic factors on the verges of the growing season is 383
21 crucial to determine the time window during which the carbon sequestrated by the atmosphere is 384
permanently stocked in trees. 385
The models using maximum and minimum temperature produced similar results in terms of onset 386
of xylogenesis, but calculated different endings, and hence different durations of xylogenesis for 387
the last 60 years (Table 4). Both models provided equally reliable estimations of xylem 388
phenology, which prevented a definitive choice of the most suitable model. Unlike 389
photosynthesis that is able to maintain high assimilation rates even at temperatures below 5 °C, 390
xylem formation necessitates large amounts of available sucrose to be allocated in the growing 391
tissues to complete growth, which is a temperature-limited process (Körner, 2003a; Deslauriers et 392
al., 2009). Cell doubling time remains quite constant at temperatures of 10−25 °C, but triples 393
when temperatures fall from 10 to 5 °C, and cell division stops at 1−2 °C (Körner, 2003b). 394
Moreover, comparing the daily growth responses of conifers to maximum and minimum 395
temperatures, the better results were observed with the latter (Deslauriers and Morin, 2005; Wei 396
et al., 2007, Rossi et al., 2008b). However, the effects of the two variables have still not been 397
experimentally and definitively disentangled, and which temperature mostly controls the length 398
of the growing period remains an unresolved question. 399
22 CONCLUSIONS
401
This paper used the phenological model developed by Rossi et al. (2011b) and weekly 402
observations performed for 9 years in four permanent sites in Quebec, Canada to reconstruct the 403
timings of cambium phenology over the last 60 years. All sites exhibited increasing trends of 404
both annual and May-September temperatures, with the greatest changes occurring for maximum 405
temperature at the higher latitudes. Accordingly, earlier cambial resumptions by 0.5-0.8 days 406
decade-1 were estimated, while significant delays for the ending of xylogenesis were calculated 407
only with the model using minimum temperatures. Phenological events in spring were confirmed 408
to be more variable and changing faster than those occurring in autumn. Results confirmed the 409
initial hypothesis that duration of xylogenesis has lengthened since 1950. However, contrasting 410
extents were observed, ranging between 0.07 and 1.5 days decade-1, calculated with the model 411
based on maximum and minimum temperatures, respectively. To our knowledge, this is the first 412
time that past cambial phenology has been modeled and reconstructed. 413
Consistent with the findings reported for leaf and flower buds, changes in cambial phenology 414
showed increasing trends in length of the growing season, demonstrating the effects of the recent 415
global warming on secondary meristems of trees. If the observed trend is maintained unaltered in 416
the long run, the demonstrated advancement of cambial activity could dramatically modify the 417
short time window for growth of the boreal species and markedly affect cell production of the 418
secondary meristem. The findings of this work revealed that long-term increases in temperature 419
can substantially extend wood formation and, consequently, the dynamics and productivity of 420
cold ecosystems, by removing the thermal constraints to the activity of carbon sinks in trees. 421
23 However, evidence of these trends in forest ecosystem productivity requires to be confirmed by 422
further specific investigations. 423
24 ACKNOWLEDGEMENTS
425
This work was funded by Consortium de Recherche sur la Forêt Boréale Commerciale and Fonds 426
de Recherche sur la Nature et les Technologies du Québec. The authors thank B. Dufour, G. 427
Dumont-Frenette, F. Gionest, C. Lupi, S. Pedneault, P.-Y. Plourde, G. Savard, C. Soucy and M. 428
Thibeault-Martel for technical support. Special thanks are extended to D. McKenney, K. 429
Lawrence and P. Papadopol for sharing their dataset with the temperature chronologies, to J. 430
Pedlar for his recommendations on data analysis, and to A. Garside for checking the English text. 431
25 REFERENCES
433
Abe H, Funada R, Ohtani J, Fukazawa K. 1997. Changes in the arrangement of cellulose 434
microfibrils associated with the cessation of cell expansion in tracheids. Trees, 11: 328-435
332. 436
Anfodillo T, Deslauriers A, Menardi R, Tedoldi L, Petit G, Rossi S. 2012. Widening of xylem 437
conduits in a conifer tree depends on the longer time of cell expansion downwards along 438
the stem. Journal of Experimental Botany, 63: 837-845. 439
Badeck FW, Bondeau A, Böttcher K, et al. 2004. Responses of spring phenology to climate 440
change. New Phytologist, 162: 295-309. 441
Beaubien EG, Freeland HJ. 2000. Spring phenology trends in Alberta, Canada: links to ocean 442
temperature. International Journal of Biometeorology, 44: 53-59. 443
Begum S, Nakaba S, Oribe Y, Kubo T, Funada R. 2007. Induction of cambial reactivation by 444
localized heating in a deciduous hardwood hybrid poplar (Populus sieboldii x P. 445
grandidentata). Annals of Botany, 100: 439-447. 446
Chmielewski F-M, Rötzer T. 2001. Response of tree phenology to climate change across 447
Europe. Agricultural and Forest Meteorology, 108: 101-112. 448
Deslauriers A, Giovannelli A, Rossi S, Castro G, Fragnelli G, Traversi L. 2009. Intra-annual 449
cambial activity and carbon availability in stem of poplar. Tree Physiology, 29: 1223-450
1235. 451
Deslauriers A, Morin H. 2005. Intra-annual tracheid production in balsam fir stems and the 452
effect of meteorological variables. Trees, 19: 402-408. 453
Deslauriers A, Rossi S, Anfodillo T, Saracino A. 2008. Cambial phenology, wood formation 454
and temperature thresholds in two contrasting years at high altitude in southern Italy. Tree 455
26 Physiology, 28: 863-871.
456
Forrest J, Miller-Rushing AJ. 2010. Toward a synthetic understanding of the role of phenology 457
in ecology and evolution. Philosophical Transactions of The Royal Society, 365 3101– 458
3112. 459
Forster T, Schweingruber FH, Denneler B. 2000. Increment puncher: a tool for extracting 460
small cores of wood and bark from living trees. IAWA Journal, 21: 169-180. 461
Frankenstein C, Eckstein D, Schmitt U. 2005. The onset of cambium activity - a matter of 462
agreement? Dendrochronologia, 23: 57-62. 463
Gričar J, Čufar K, Oven P, Schmitt U. 2005. Differentiation of terminal latewood tracheids in 464
silver fir trees during autumn. Annals of Botany, 95: 959-965. 465
Gričar J, Krže L, Čufar K. 2009. Number of cells in xylem, phloem and dormant cambium in 466
silver fir (Abies alba), in trees of different vitality. IAWA Journal, 30: 121-133. 467
Gričar J, Zupančič M, Čufar K, Oven P. 2007. Regular cambial activity and xylem and 468
phloem formation in locally heated and cooled stem portions of Norway spruce. Wood 469
Science and Technology, 41: 463-475. 470
Hänninen H, Tanino K. 2011. Tree seasonality in a warming climate. Trends in Plant Science, 471
16: 412-416. 472
Huang J, Tardif JC, Bergeron Y, Denneler B, Berninger F, Girardins MP. 2010. Radial 473
growth response of four dominant boreal tree species to climate along a latitudinal 474
gradient in the eastern Canadian boreal forest. Global Change Biology, 16: 711-731. 475
Hughes MK. 2002. Dendrochronology in climatology - the state of the art. Dendrochronologia, 476
20: 95-116. 477
IPCC. 2007. Climate change 2007: synthesis report. Contribution of working groups I, II and III 478
to the fourth assessment report of the intergovernmental panel on climate change, 479
27 Geneva.
480
Körner C. 2003a. Alpine plant life: functional plant ecology of high mountain ecosystems, 481
Berlin, Springer-Verlag. 482
Körner C. 2003b. Carbon limitation in trees. Journal of Ecology, 91: 4-17. 483
Körner C, Paulsen J. 2004. A world-wide study of high altitude treeline temperatures. Journal 484
of Biogeography, 31: 713-732. 485
Legendre P, Legendre L. 1998. Numerical ecology, Amsterdam, Elsevier. 486
Lupi C, Morin H, Deslauriers A, Rossi S. 2010. Xylem phenology and wood production: 487
resolving the chicken-or-egg dilemma. Plant, Cell and Environment, 33: 1721-1730. 488
Marion L, Gričar J. 2007. Wood formation in urban Norway maple trees studied by the micro-489
coring method. Dendrochronologia, 25: 97-102. 490
McKenney DW, Pedlar JH, Papadopol P, Hutchinson MF. 2006. The development of 1901-491
2000 historical monthly climate models for Canada and the United States. Agricultural 492
and Forest Meteorology, 138: 69-81. 493
Menzel A. 2000. Trends in phenological phases in Europe between 1951 and 1996. International 494
Journal of Biometeorology, 44: 76-81. 495
Moser L, Fonti P, Buentgen U, et al. 2010. Timing and duration of European larch growing 496
season along altitudinal gradients in the Swiss Alps. Tree Physiology, 30: 225-233. 497
Myneni RB, Keeling CD, Tucker CJ, Asrar G, Nemani RR. 1997. Increased plant growth in 498
the northern high latitudes from 1981 to 1991. Nature, 386: 698-702. 499
Nizinski JJ, Saugier B. 1988. A model of leaf budding and development for a mature Quercus 500
forest. Journal of Applied Ecology, 25: 643-652. 501
Oribe Y, Funada R, Kubo T. 2003. Relationships between cambial activity, cell differentiation 502
and the localisation of starch in storage tissues around the cambium in locally heated 503
28 stems of Abies sachalinensis (Schmidt) Masters. Trees, 17: 185-192.
504
Pisaric MFJ, Holt C, Szeicz J, Karst T, Smol JP. 2003. Holocene treeline dynamics in the 505
mountains of northeastern British Columbia, Canada, inferred from fossil pollen and 506
stomata. The Holocene, 13: 161-173. 507
Plummer DA, Caya D, Frigon A, et al. 2006. Climate and climate change over North America 508
as simulated by the Canadian RCM. Journal of Climate, 19: 3112-3132. 509
Quinn GP, Keough MJ. 2002. Experimental design and data analysis for biologist, Cambridge 510
University Press. 511
Rathgeber CBK, Rossi S, Bontemps J-D. 2011. Tree size influences cambial activity in a 512
mature silver fir plantation. Annals of Botany, 108: 429-438. 513
Rossi S, Anfodillo T, Menardi R. 2006a. Trephor: a new tool for sampling microcores from tree 514
stems. IAWA Journal, 27: 89-97. 515
Rossi S, Deslauriers A, Anfodillo T. 2006b. Assessment of cambial activity and xylogenesis by 516
microsampling tree species: an example at the Alpine timberline. IAWA Journal, 27: 383-517
394. 518
Rossi S, Deslauriers A, Anfodillo T, Carraro V. 2007. Evidence of threshold temperatures for 519
xylogenesis in conifers at high altitude. Oecologia 152: 1-12. 520
Rossi S, Deslauriers A, Anfodillo T, Carrer M. 2008a. Age-dependent xylogenesis in 521
timberline conifers. New Phytologist, 177: 199-208. 522
Rossi S, Deslauriers A, Gričar J, et al. 2008b. Critical temperatures for xylogenesis in conifers 523
of cold climates. Global Ecology and Biogeography, 17: 696-707. 524
Rossi S, Morin H, Deslauriers A. 2011a. Multi-scale influence of snowmelt on xylogenesis of 525
black spruce. Arctic, Antarctic, and Alpine Research, 43: 457-464. 526
Rossi S, Morin H, Deslauriers A. 2012. Causes and correlations in cambium phenology: 527
29 towards an integrated framework of xylogenesis. Journal of Experimental Botany, 63: 528
2117-2126. 529
Rossi S, Morin H, Deslauriers A, Plourde P-Y. 2011b. Predicting xylem phenology in black 530
spruce under climate warming. Global Change Biology, 17: 614-625. 531
Schwartz MD, Ahas R, Aasa A. 2006. Onset of spring starting earlier across the Northern 532
Hemisphere. Global Change Biology, 12: 343-351. 533
Seo J-W, Eckstein D, Jalkanen R, Rickebusch S, Schmitt U. 2008. Estimating the onset of 534
cambial activity in Scots pine in northern Finland by means of the heat-sum approach. 535
Tree Physiology, 28: 105-112. 536
Sparks TH, Menzel A. 2002. Observed changes in seasons: an overview. International Journal 537
of Climatology, 22: 1715-1725. 538
Swidrak I, Gruber A, Kofler W, Oberhuber W. 2011. Effects of environmental conditions on 539
onset of xylem growth in Pinus sylvestris under drought. Tree Physiology, 31: 483-493. 540
Thibeault-Martel M, Krause C, Morin H, Rossi S. 2008. Cambial activity and intra-annual 541
xylem formation in roots and stems of Abies balsamea and Picea mariana. Annals of 542
Botany, 102: 667-674. 543
Turcotte A, Morin H, Krause C, Deslauriers A, Thibeault-Martel M. 2009. The timing of 544
spring rehydration and its relation with the onset of wood formation in black spruce. 545
Agricultural and Forest Meteorology, 149: 1403-1409. 546
Wei X, Yanhui W, Pengtao Y, Hailong L, Zhongjie S, Wei G. 2007. Growth in stem diameter 547
of Larix principis-rupprechtii and its response to meteorological factors in the south of 548
Liupan Mountain, China. Acta Ecologica Sinica, 27: 432-441. 549
Zhang X, Vincent L, Hogg WD, Niitsoo A. 2000. Temperature and precipitation trends in 550
Canada during the 20th century. Atmosphere Ocean, 38: 395-429. 551
30 Zhou L, Tucker CJ, Kaufmann RK, Slayback D, Shabanov NV, Myneni RB. 2001.
552
Variations in northern vegetation activity inferred from satellite data of vegetation index 553
during 1981-1999. Journal of Geophysical Research, 106: 20069-20083. 554
31 FIGURE LEGENDS
556
Fig. 1 Temperatures during 1950-2010 in the four sampling sites (graphics with different scales). 557
Gray lines correspond to linear regression analyses 558
Fig. 2: Cambial phenology in black spruce during 2002-2010 in the boreal forest of Quebec, 559
Canada. 560
Fig. 3 Estimation of cambial phenology from period 1950-2010 (onset, ending and duration of 561
xylogenesis). Lines correspond to regression analyses performed by ANCOVA 562
Table 1: Location of the four study sites listed in decreasing latitude and climatic characteristics measured during the period 2002-2010.
Site Latitude Longitude
Altitude (m a.s.l.)
Mean temperature Absolute annual temperature
Annual (°C) May-September (°C) Maximum (°C) Minimum (°C) DAN 50°41’N 72°11’ W 487 -0.9 11.0 34.2 -47.1 MIS 49°43’ N 71°56’ W 342 1.0 12.7 35.1 -42.4 BER 48°51’ N 70°20’ W 611 0.3 11.4 33.1 -39.8 SIM 48°13’ N 71°15’ W 338 2.0 13.3 35.7 -39.7
Table 2: ANOVA comparisons performed among the threshold temperatures occurring when the probability of xylem growth in black spruce being active was 0.5. The thresholds were estimated on a dataset of cambial phenology collected during 2002-2010 in the boreal forest of Quebec, Canada.
Threshold temperature (°C) SIM BER MIS DAN F-value P Minimum 4.2±1.0 4.0±1.9 5.4±1.3 4.0±1.3 2.68 0.06 Maximum 15.1±0.7 15.2±1.4 16.3±1.4 15.4±1.4 1.64 0.19
Table 3: Proportions of observed and predicted days with non-active (first and second row) or active (third and fourth row) xylem growth in black spruce. Predictions were obtained using the minimum and maximum temperatures estimated during 2002–2010 in the boreal forest of Quebec, Canada. The first and fourth rows correspond to the days correctly predicted by the model.
Observed xylogenesis
Predicted xylogenesis
Model using minimum temperatures (%)
Model using maximum temperatures (%)
No No 69.2 68.8
No Yes 3.1 3.5
Yes No 2.0 1.5
Table 4: ANCOVA models comparing the chronologies of cambial phenology (onset, ending and duration of xylogenesis) of black spruce predicted for 1950-2010 using thresholds of minimum and maximum temperature. One, two and three asterisks indicate statistically significant differences at p<0.05, p<0.001 and p<0.0001, respectively.
Regressors Statistics Coefficients
Xylogenesis Temperature Source Type I SS F-value F-value Rsquare Intercept Slope (101)
Onset
Minimum Year Site 219.9 6000.0 5.6* 51.1*** 22.9*** 0.40 307.9 -0.8 Year×site 64.2 0.5
Maximum Year Site 713.5 5852.0 14.3** 39.1*** 19.1*** 0.36 237.5 -0.5 Year×site 100.8 0.6
Ending
Minimum Year Site 627.0 60303.2 15.3** 49.0*** 23.6*** 0.41 125.3 0.7 Year×site 125.8 1.0
Maximum Year Site 36.8 8754.5 0.9 74.1*** 32.3*** 0.48 351.9 -0.4 Year×site 116.4 0.9
Duration
Minimum Year Site 1589.6 23747.7 21.4*** 106.7*** 49.3*** 0.59 -182.6 1.5 Year×site 308.2 1.3
Maximum Year Site 1074.9 28846.8 13.0** 116.6*** 52.5*** 0.60 114.4 0.07 Year×site 409.3 1.6
Figure 1 SIM 2 4 6 8 y = 6.8 + 0.1 10-2 x DAN 2 4 6 8 y = -25.1 + 1.4 10-2 x MIS M ax im um tem pera ture (°C) 2 4 6 8 y = -10.7 + 0.8 10-2 x BER 2 4 6 8 y = -5.31 + 0.54 10-2 x Annual temperature 14 16 18 20 22 y = 10.6 + 0.4 10-2 x 14 16 18 20 22 y = -39.5 + 2.8 10-2 x 14 16 18 20 22 y = -21.6 + 2.0 10-2 x 14 16 18 20 22 y = -13.3 + 1.5 10-2 x May-September temperature DAN -10 -8 -6 -4 -2 y = -20.1 + 0.6 10-2 x 1950 1960 1970 1980 1990 2000 2010 4 6 8 10 y = -30.0 + 1.8 10-2 x 4 6 8 10 y = 2.3 + 0.1 10-2 x 4 6 8 10 y = -26.7 + 1.6 10-2 x 4 6 8 10 y = -32.9 + 1.9 10-2 x SIM Year 1950 1960 1970 1980 1990 2000 2010 -10 -8 -6 -4 -2 y = -34.4 + 1.5 10-2 x MIS M inim un t emperature (°C) -10 -8 -6 -4 -2 y = -46.5 + 2.0 10-2 x BER -10 -8 -6 -4 -2 y = -40.2 + 1.7 10-2 x
Figure 2 Ons et of xy logen es is (D OY) 140 150 160 170 2002 2004 2006 2008 2010 Du ration of xy logen es is (D OY) 60 80 100 120 Ending of xy logen es is (D OY) 240 250 260 270 280 SIM BER MIS DAN Year
Figure 3 Minimum temperature Ons et of x y logenes is (DO Y ) 120 130 140 150 160 170 180 1950 1960 1970 1980 1990 2000 2010 Durati on of x y logenes is (DO Y ) 60 80 100 120 140 SIM BER MIS DAN E nding of x y logenes is (DOY ) 230 240 250 260 270 280 Maximum temperature 1950 1960 1970 1980 1990 2000 2010 Year
1 SUPPLEMENTARY DATA
Fig. S1: Variation of the maximum and minimum temperature expressed as annual means and as the May-September period in the four sampling site (graphics with different scale).
Annual temperature M a x im u m te m pe rat ure (°C) 4 6 8 May-September temperature 14 16 18 20 2002 2004 2006 2008 2010 M in im u m te m pe rat ure (°C) -8 -6 -4 -2 SIM BER MIS DAN Year 2002 2004 2006 2008 2010 4 6 8
2 Table S1: Relationships in the form of linear regressions between measured and estimated temperatures in the four study sites for the overlapping years 2002-2004. All models were significant at p<0.0001.
Temperature Site Annual May-September
Intercept Slope R square Intercept Slope R square Minimum DAN 0.80 0.95 0.87 2.22 0.82 0.62 MIS -0.35 0.96 0.87 1.66 0.76 0.57 BER 0.93 0.90 0.86 2.37 0.77 0.60 SIM 0.82 0.90 0.86 2.95 0.73 0.56 Maximum DAN 0.96 0.97 0.93 4.02 0.82 0.72 MIS 0.87 0.99 0.94 3.76 0.85 0.71 BER 0.81 0.97 0.93 3.82 0.81 0.69 SIM 0.52 0.98 0.92 4.52 0.79 0.67
3 Fig. S2: Deviation from average of the period 1950-2010 in the form of difference between the actual temperature and historical mean.
-20 2
-20 2
Annual temperature May-September temperature
-20 2 -20 2 D A N -20 2 M IS -20 2 BER -20 2 SIM 1950 1960 1970 1980 1990 2000 2010 -20 2 D ev iation fr om t he his tor ic al m ax imum t em per at ur e (°C ) D ev iation fr om t he his tor ic al m inimun tem per at ur e ( °C ) 1950 1960 1970 1980 1990 2000 2010 Year D A N M IS BER SIM