CIRPÉE
Centre interuniversitaire sur le risque, les politiques économiques et l’emploi
Cahier de recherche/Working Paper 06-22
Understanding the Persistent Low Performance of African
Agriculture
Sylvain Dessy Jacques Ewoudou Isabelle Ouellet Mai/May 2006 _______________________Dessy: Department of Economics, Université Laval and CIRPÉE, Local 2176, DeSève, Québec, QC, Canada G1K 7P4
Ewoudou: Department of Economics, Université de Montreal, C.P. 6128, succ. Centre-Ville Montreal, Québec, Canada H3C 3J7
Ouellet: Department of Economics, Université du Québec à Montreal, C.P. 8888, succ. Centre-Ville Montreal, Québec, Canada H3C 3P8
Abstract:
We explain the persistence of low performances in African agriculture by analyzing the determinants of farmers’ decisions to modernize their farming practices. Owing to sociocultural factors specific to Sub-Saharan Africa, farmers’ decisions on farming practices are strategic complements. We demonstrate that the modernization game these farmers play admits two pure-strategy, Pareto-ranked, symmetric Nash-equilibria. The equilibrium where all farmers choose to modernize their farming methods is preferred to the one where all of them choose to stick to a traditional method. We argue that scarcity and economic opportunities put forward by neo-Boserupian theories of induced-innovation as determinants of the onset of agricultural innovations are, in the context of African countries, only necessary, but not sufficient to generate modernization of farming methods. Deliberate action to enhance adoption of agricultural innovations must therefore take the African’s sociocultural context into consideration, or risk failure.
Keywords: Sub-Saharan Africa, Agricultural modernization, Fertilizer adoption,
Supermodular games
I. Introduction
Until recently, the literature on technological innovations in agriculture has been dominated by neo-Boserupian theories of induced innovation, emphasizing scarcity and economic op-portunities as the main determinants of the emergence of new agricultural innovations.1
For example, Yujiro Hayami and Vernon M. Ruttan [1985] formalize and empirically verify a theory of induced innovation, linking the emergence of agricultural innovations to eco-nomic conditions. Anya McGuirk and Yair Mundlak [1991] argue that the introduction of guaranteed markets for Punjabi food grain production by the government procurement policy enhanced the adoption of high-yield wheat and rice varieties in Punjab, India. Abe Goldman [1993] suggests that technological change in a region is determined both by fac-tors scarcities and marketing opportunities. Davis Sunding and David Zilberman [2000] argue that food shortages or high prices of agricultural commodities will likely lead to the introduction of new high-yield variety, and may provide the background for new in-novations that modify product quality. Interestingly, most of these conditions have been present in Sub-Saharan Africa (hereafter SSA). On one hand, despite the fact that in SSA, agriculture is the main source of economic growth (Bocar Diagana [2003]),2 and the
majority of the sub-region’s population derives its livelihood from agricultural activities (Gershon Feder, Richard Just and David Zilberman [1985]; Danielle Resnick [2004]), the United Nations Conference on Nutrition (UNSCN [2004]) reports that 33 percent of SSA population was undernourished in 2000, among which children were reported as particu-larly vulnerable. Food scarcity thus is clearly a pressing problem in this sub-region, which creates a potential demand for food staples. On the other hand, interventions from both African governments and the international donor community have helped create economic opportunities for farmers, including free or subsidized training to enhance best farming
1Neo-Boserupian theories are those that build around the seminal work of Esther Boserup [1965]. 2In SSA, the agricultural sector accounted in 1997 for about 35% of Gross Domestic Product, 40% of
its exports and about 70% of employment (World Bank, 1997). It is also estimated in 1993 that, due to its stimulating effects on industry, transport and services, a 1% growth in agriculture generates an overall economic growth of 1.5% (Word Bank, 1993).
practices, and availability of land-saving, and yield-enhancing biotechnology3.
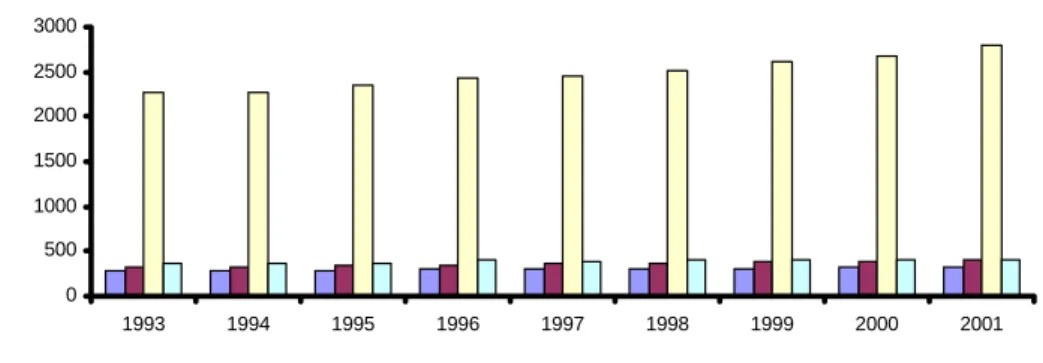
Economic conditions thus seem ripe for agricultural innovation to unfold in SSA. Yet, SSA agriculture has continued to under perform with respect to farming practices, output growth, and adoption of yield-enhancing innovations. First, Figure 1 below indicates that SSA’s average agricultural value-added per worker persistently lags behind that of all other developing regions, including East Asia and Pacific, Latin America and the Caribbean, and South Asia.4
Figure 1: Agricultural value-added per worker (constant 2000 US $)
0 500 1000 1500 2000 2500 3000 1993 1994 1995 1996 1997 1998 1999 2000 2001 Africa East Asia & Pacific Latin America & Caribbean South Asia
Source: World development Indicators 2005
3At the international level, key bilateral donors, including the Department for international
Develop-ment (DFID), the Canadian International DevelopDevelop-ment Agency (CIDA), and the US Agency for interna-tional Development (USAID) have developed extensive agricultural and rural development programs such as micro-credit programs and, extensive fertilizer aid to small African farmers (Danielle Resnick [2004]). In 1996 for instance, Africa received the largest amount worldwide of Japan’s Grant Aid for the Increase of Food Production (41%), while the remaining aid was distributed to Asia (28%), Central and South America (15%), the middle East (8%) and East Europe (8%). The largest recipient include Kenya—with one billion yen worth of agricultural inputs, Tanzania, Ethiopia and Zambia (The World Bank [1999]).
At the domestic level, fertilizer subsidies were adopted by almost all African countries’ governments and farmers were often freely trained and largely sensitized to its use. In the early 1980s, explicit fertilizer subsidies were widespread, by 25 percent in Malawi, 60 percent in Tanzania, 50 percent in Cameroon, 46 percent in Senegal and 85 percent in Nigeria. In addition, many African governments also adopted macroeconomic policies that include currency overvaluation, budgetary constraints and foreign exchange restrictions aimed at impacting significantly on fertilizers prices (The World Bank [1999]).
4Available data also indicate that during this period, SSA’s average agricultural value added per worker
was 84 percent of the average for East Asia and Pacific; 77 percent of the average for and South Asia and, only 12 percent of that of the Latin America and the Caribbean region (World Development Indicators 2005).
Second, Figure 2 below indicates that agricultural growth has been the lowest in SSA during the 1993-2001 period, when compared to other developing regions, including East Asia and Pacific, Latin America and the Caribbean , and South Asia.
Figure 2: Regional trend in agricultural value-added (constant 2000 billion US$) 0 50 100 150 200 250 300
SSA East Asia & Pacific Latin America & Caribbean
South Asia
1993 1994 1995 1996 1997 1998 1999 2000 2001
Source: World Development Indicator 2005
Third, Figure 3 sums up the relatively poor performance of SSA agriculture with respect to fertilizer
use.5
F ig ur e 3 : R e g ion a l T r e n d s in fe r tilize r c on sum p tion (1 0 0 g ra m p e r h ec ta r of a r a b le la n d )
0 5 00 10 00 15 00 20 00 25 00 196119621963196 4 19651966196 7 19681969197019711972197 3 197 4 19751976197719781979198 0 19811982198319841985198619871988198 9 199019911992199319941995199 6 199719981999200020012002
E a s t A sia & P a cific S outh A sia S S A La tin A m e rica & C a rib b e a n
Source: World Development Indicators 2005
5According to the Word Bank Report 1999, the observed trend of low fertilizer use in Africa continues
to raise concerns about the continent’s ability to overcome it food problems because these low application rates have severe consequences for the fertility of the soil and the sustanability of agricultural production.
All the above facts raise concerns about reliance on neo-Boserupian theories of induced innovation as a guideline for understanding African agriculture. From an empirical point of view, these concerns have found a resounding echo in a recent series of field experiments undertaken by Esther Duflo, Michael Kremer and Jonathan Robinson [2005]. They study the use of fertilizer in Busia, a relatively poor rural district in Western Kenya, where maize is the main food staple, and soil fertility is low. Their experiments seek to understand why so many people in Busia do not use fertilizer even though it appears to have the potential to generate high on-farm yield increases, which in turn will improve farmers’s well-being as well as food security in the region. Before their experiments, only 10% of farmers used fertilizer at any point in time, despite Busia being characterized by periodical episodes of food shortage, while fertilizer were available in small packages that required no large investment.6 Furthermore, Duflo, Kremer, and Robinson also reveal that 80% of Busia
farmers who received training on how to use fertilizer were still not using it. According to Esther Duflo [2006], 98% of these farmers reported facing a savings problem, that hindered their ability to finance the purchase of fertilizers. So when, in another experiment, farmers were presented the option of buying a non-refundable, non-transferable voucher for fertilizer delivery in the sowing season, Duflo, Kremer, and Robinson [2005] notice that 83% of them accepted the voucher-for-fertilizer scheme. But why couldn’t farmers come up with their own savings arrangements to mitigate the savings problem each of them faced?
In this paper, we address this question by providing a simple theoretical guide to the empirical findings by Duflo, Kremer, and Robinson [2005]. Such a theory must be able to explain the coexistence of low innovation rates in agriculture with economic conditions which neo-Boserupian theories find essential for the onset of technological innovations in agriculture, namely economic opportunities and scarcity. We develop a game-theoretic model whereby self-employed farmers simultaneously choose whether or not to modernize farming through the use of a commercial input package—including fertilizers. In our model,
6For instance, Duflo, Kremer, and Robinson [2005] discover that it cost 8 shillings, less than the price
of 1 kilogram of maize—the main staple cereals in the region— to apply fertilizer on an area of 30 square meters.
each farmer lives in a financially isolated community,7 and has a choice between two
crop-ping methods for the production of an agricultural staple. A farmer may choose to stick to a traditional, low-productivity method whereby own labor is the only essential input at farming, or she may elect to modernize farming through the adoption of yield-enhancing biotechnology, of which fertilizers are a major component. Since fertilizers are often sold at subsidized prices, each farmer can finance their purchase through her own savings, rather than loans (Esther Duflo [2006]). For this purpose, she may need to save part of the pro-ceeds from her sales of last season crop in order to invest in the adoption of fertilizers for the new season. Yet, she may decide against saving, for example if she is unable to protect her savings from social predation.8
Form an empirical point of view, evidence of social predation abounds in SSA. Based on a field research conducted in Southern provinces of Zambia between January and August 2000, Karin Verstralen [2001] documents the presence of sociocultural factors such as tradi-tional ceremonies—e.g., marriage, initiation rites and funerals— that affect savings behavior because they often involve the generation and the redistribution of social payments. Renée Chao-Béroff [2003] reports increased daily social pressures in rural African areas where banking services are generally inaccessible and concludes that without a savings discipline amongst rural populations, it is difficult for an individual in this environment to resist social pressures that make savings fungible. Stefan Ambec and Nicolas Treich [2002] argue that in rural societies of many developing countries, traditional values press investment-minded individuals to spread their money within their community. In Busia and Teso districts of Western Kenya, where Rotating savings and credit associations (Roscas) are very general-ized,9 Mary Kay Gugerty [2003] finds that these associations represent essentially financial
7Jonathan Conning and Christopher Udry (2005) find that in a financially isolated community, agents
will only transform one set of variables and uncertain cash flows into another using available production and storage technologies and local financial instruments.
8Hernando De Soto (2000) reports that the growing need to secure savings has become prevalent in the
rural sectors of most developing countries where agents remain cut-off from many of the opportunities for investing, risk-taking and risk spreading that would be available through better financial integration into larger national and global financial markets.
9Mary Kay Gugerty (2003) documents that in 1986, 50 percent of the adult population in the Congo
agreements to cope with social pressures that force investment-minded individuals to part with their savings in an unproductive manner. She claims that Roscas are informal fi-nancial arrangements designed by a collection of investment-minded individuals to provide participants with a technology for shielding their savings from social predation. This im-plies that, by themselves, individuals are able to design contractual arrangements to solve their problems. But why couldn’t farmers, by themselves, come up with such arrangement to solve their farming modernization problem?
Unlike other economic activities, agriculture is a sequence of seasonal, interrelated, calendar events– including a sowing season where all farmers purchase and use agricultural inputs, and a harvesting season where they all collect and sell their agricultural staples. Thus farmers face identical calendar events, and their ability to save in order to finance modernization of farming methods may therefore hinge on the extent to which they can find a savings mobilization technology that satisfies the constraint that all farmers access their savings at the same time. In such an environment, an informal mechanism of mutual cooperation such as Roscas are not suitable. There are two main reasons for this. First, everyone needs his savings at the same moment (sowing season). Second, all farmers earn their income at the same time (harvesting season). In absence of a savings mobilization technology that satisfies these constraints, a farmer may not be able to save, unless a significant number of other farmers follow suit. The more there are other farmers who save, the higher likelihood that a farmer who saves will be able to protect her savings from social predation, simply because with more farmers saving, each one of them will feel less social pressure to part with her savings in an unproductive manner. Consequently, an essential feature of the environment underlying farmers’ decisions to save in this agrarian community is the complementarity of their respective strategies: a farmer’s decision to save (in order to finance modernization of her farming practices) increases other farmers marginal gain from following suit. In the absence of a mechanism for inducing coordination of farmers’ Coast, Togo, and Nigeria. In 1992, membership in roscas in Cameroun was estimated at 80 percent of the adult population and in several villages in Nigeria in 1987, adult membership was found to be 66 percent of the population.
strategies, the non-cooperative game these farmers play admits two pure-strategy Nash-equilibria: a modernization equilibrium where all of them choose to save in order to finance the purchase of yield-increasing inputs, and a traditional equilibrium where they all remain trapped inside the prevalent agricultural status quo. When the traditional equilibrium obtains despite the well-known high-yield potential of biotechnologies, and the affordability of these technologies made possible by government’s subsidies10, it must be because of a
lack of a coordination mechanism–for example in the form of a savings technology that can mitigate social predation.
There is extensive empirical evidence that strategic complementarities abounds in rural agrarian environments. For example, Timothy Besley and Anne Case [1994] showed that in India, adoption of high-yield variety (HYV) seeds by an individual is correlated with adoption among their neighbors. Andrew D. Foster and Mark R. Rosenzweig [1995] who study the use of fertilizer during the early years of the Green Revolution in India find that the profitability of HYV seeds increased with past experimentation, of either the farmers or others in the village. Timothy Conley and Christopher Udry [2005] show that pineapple farmers in Ghana imitate the choice of fertilizer quantity of their neighbors when the latter have a good shock, and move further away from these decisions when they have a bad shock. We build around this literature by emphasizing access to a savings technology as another source of strategic complementarities among same-community farmers. The rest of this paper is organized as follows. The model is presented and solved in section 2. Section 3 offers concluding remarks.
II. The Framework
Consider an agrarian community consisting of N ex ante homogenous self-employed farm-ers, each endowed with a plot of farm land in which she grows a single agricultural crop. As essential means for boosting on farm yield, assume a land-saving, biotechnology is
intro-10James A. Roumasset [2004] reveals that agricultural economists typically recommend a panoply of
goverment interventions to go along with the investments in new technologies and infrastructure, including price-supports and stabilization schemes, credit and input subsidies, and crop insurance.
duced in this region.11 For the sake of simplicity, assume this agrarian community lasts for
four periods representing two identical cropping cycles. Each cycle consists of two seasons, a sowing season (i.e., season 1) and a harvest season (i.e., season 2). The farmer’s harvest is entirely sold in a competitive market by the end of the season.
During the first cropping cycle, it is assumed all farmers use a traditional method of production at sowing—combining land with own labor as the only essential inputs. However, at the end of the first cycle, i.e., after the first harvest is sold, each farmer may consider modernizing her farming practices, by combining recommended commercial biotechnology with land and own-labor.12 The purchase of the recommended commercial input package
must be self-financed, which requires a period of savings.
A. Informal Savings under Social Pressures
Let k > 0, denote the level savings required to purchase the recommended quantity of commercial biotechnology. Therefore, at the end of the first harvest season, a typical self-employed farmer i ∈ I, (where I = {1, 2, ..., N}) faces a binary decision in preparation for the next cropping cycle: either she saves a part of the proceeds of the sale of her first harvest (i.e., k), in order to modernize her farming practices during the next cycle, or she does not save, in which case she maintains a traditional production method throughout the two cycles. In other words, at the end of the first agricultural cycle, each farmer either takes an action si = 1, meaning she commits to saving the amount of money needed to
purchase the recommended input package at the opening of the next cropping period; or she takes an action si = 0, meaning she commits to maintaining the status quo for next
11 One can think of this bio-technology as an input package including, for example, high yielding varieties,
and assorted fertilizer.
12 Dunstan Spencer [2001] reveals that in Africa, small-scale farms account for over 90 percent of the
agricultural production and are dominated by the poor. This has a major implication for the rate of innovation in farming, as the poor often have difficulties accessing the constituents of agricultural best practice. In this setting therefore, it is assumed the use of land-saving biotechnologies will generate signi-ficative increases in yields if and only if a typical self-employed farmer purchases the whole recommanded commercial inputs package.
cycle, in which case she does not save.
However, in this community with no alternative formal individual savings commitment technologies, it is assumed traditional values can press those who decide to save to spread their money within their community.13 Therefore, denote as
κn= α (n) k, (II.1)
the net savings entirely controlled by a self-employed farmer who decide to modernize her farming practices, when n = Pisi, farmers elected to save. Thus, α (n) ∈ [0, 1], represents
the fraction of her savings a typical farmer is able to protect from traditional sharing obligations.
Assumption 1. The function α satisfies the following property:
α (n) = ⎧ ⎨ ⎩ α if n < n∗ 1 if n ≥ n∗ (II.2)
where α ∈ (0, 1), and n∗ ∈ (1, N) denotes the threshold number of self-employed
farmers involved in a farming modernization activity, above which choosing to save entails no traditional sharing obligation for a farmer.
Assumption 1 highlights the importance for smallholder farmers, as a group, to over-come social pressures that give rise to savings predation, preventing them from modernizing their farming activities. That n∗ is bounded below by 1 means that by privately
accumu-lating savings alone, a typical farmer will suffer from the highest social pressures from doing so.14
13For empirical evidences of this feature, see Jean Phillipe Platteau (2000) and James Wendy (1979). 14As therefore implied by condition (II.2), that n < n∗, means that a higher demand of others will
undermine farmer i’s incentive to adopt a high-productive technology. In this case, all farmers will stagnate and remain poor. By contrast however, that n ≥ n∗, the higher is the ability for farmers to use land-saving
biotechnologies introduced in their region. This may be done through the implementation of a savings discipline in this community, by offering farmers an instrument to save through for instance the creation of a all-farmers new commercial inputs purchasing association enabling participants to purchase commercial
B. Farmer’s Welfare
Denote as π, the gross earned-income a typical farmer claims, when she remains trapped into the agricultural status quo during the next cropping cycle. By contrast, let
π (κn) = ⎧ ⎨ ⎩ π if n < n∗ ¯ π if n ≥ n∗ (II.3)
denote a farmer’s returns to cropping when she chooses to modernize her agricultural activities. The term κn is as defined in (II.1) and π < ¯π by construction.
Therefore, when a typical farmer chooses to play si = 0, she only claims π, after the
second harvest. But, when she chooses to play si = 1, she claims the residual π if n < n∗,
and ¯π > π, if individual savings was to be totally secured for traditional sharing obligations, i.e., if n ≥ n∗.
Next, assume each farmer i ∈ I, enjoys a level of seasonal consumption of a numeraire good, as proxied by ci
j, at the end of each cycle j (j = 1, 2). Thus, a typical farmer i’s
budget constraint in cycle j is then given as follows:
ci1+ sik ≤ π, j = 1 (II.4)
ci2 ≤ (1 − si) π + siπ (κn) j = 2 (II.5)
where π (κn) is as defined in (II.3).
Let u : C → <, denote a typical farmer’s periodic utility function, where u¡ci j
¢
repre-sents the periodic utility level she attains when she consumes an amount, ci
j.
Assumption 2. The function u : C → < has the following property for all c0 > c,
u (c0)− u (c) > 0.
Assumption 2 implies that more consumption is always better for all farmers in this environment.
inputs immediately after the first harvest. Hence, that n ≥ n∗, can thus be interpreted as implying that
in order for an inputs purchasing association to be a viable collective barrier against traditional sharing obligations, there must be a higher number of self-employed farmers participants.
Let V : {0, 1} × [0, N] be a real valued function with typical argument (si, n) , where si ∈ {0, 1}, and n ∈ [0, N]. We denote as V (si, n) = ⎧ ⎨ ⎩ (1 + β)u (π) if si = 0 u (π− k) + βeϑ (n) if si = 1 (II.6) where eϑ (n) = ⎧ ⎨ ⎩ u (π) if n < n∗ u (¯π) if n ≥ n∗
and β ∈ (0, 1) denotes the usual intertemporal discounting factor.
As implied by assumption 2, if si = 1 and n < n∗, V (1, n) < V (0, n). Thus, in a state
where n < n∗, social pressures will become so harmful to a typical farmer that she will be
inclined to reject agricultural innovations introduced in her community. Assumption 3. The parameters ¯π, π and k satisfy the following condition:
β [u (¯π)− u (π)] > u (π) − u (π − k) (II.7)
Assumption 3 simply guarantees that all farmers in this environment have the incentive to use the commercial biotechnology. It reflects the existence, in this rural environment, of the neo-Boserupian condition of profitable market opportunities necessary for the onset of technological innovations in agriculture. The left-hand term of condition (II.7) (i.e., β [u (¯π)− u (π)]) represents the benefits from modernizing, measured in utils; while its right-hand term (i.e., u (π) − u (π − k)) denotes the cost, also in utils, of modernizing. Condition (II.7) therefore states that in this rural environment, the benefits of modernizing outweigh its costs. But, because modernization is conditional upon a farmer being able to secure her entire savings, how many farmers will therefore choose to modernize is the outcome of a non-cooperative game between the N rural farmers living in the targeted community.15
C. The Modernization Game
Let I = {1, ...., N} be the finite set of self-employed farmers. The strategy set for each farmer i ∈ I, is denoted as Si = {0, 1}, with a generic element si ∈ Si. In addition, we
adopt the following notations. Let S = ×i∈ISi denote the strategy space, whose elements
s = (si, s−i) ∈ S define a strategy profile.16 Let S−i =×{j∈I; j6=i}Sj be the set of feasible
joint strategies for farmers other than farmer i, with s−i ∈ S−i. Observe that since Si is
finite for all i, S = Si× S−i is also finite and contains a total of 2N elements.
C.1. Payoff Functions
Continuing our description of the normal-form of the farming modernization game, we now turn our attention to the players’ utility payoff functions. Let Ui : S → <, denote farmer
i’s payoff function associated with a strategy profile Si = (si, s−i), where Ui(s)≡ V (si, n)
represents farmer i’s payoff. The number n =Pisi, denotes the cardinality of the subset
of farmers who choose to play the strategy si = 1.
Thus, as an implication of (II.6), if farmer i plays the strategy si = 0, she will gain a
payoff
Ui(0, s−i) = (1 + β)u (π) ,
irrespective of what other farmers do.
In contrast, if she plays the strategy si = 1, she will gain a payoff
Ui(1, s−i) = u (π− k) + βu (π) ,
if n < n∗ ; while she will gain a payoff
of mutual cooperation such as saving by lending is not suitable. There are two main reasons for this. First, the activity that people are involved in is seasonal and everyone needs his saving at the same moment. Second, as long as income is seasonal, all farmers therefore earn their income at the same moment.
16s
i can represents the message sent by a typical farmer to his collectivity, when S denotes the set of
Ui(1, s−i) = u (π− k) + βu (¯π) ,
if n ≥ n∗.
A non-cooperative normal-form of the farming modernization game is the triple Γ = hI, S, {Ui : i∈ I}i , consisting of a nonempty set of players I, a set S of feasible joint farming
modernization strategies, and a collection of payoff functions {Ui : i∈ I} . Notice that, since
players all have identical strategy sets i.e., S1 = S2, ... = SN and for all i, j ∈ {1, ...., N} ,
Ui(s) = Uj(s) , for all i 6= j , the normal-form game Γ is symmetric.17
C.2. Nash Equilibria in Pure Strategies
The problem set out in this subsection— that of determining farmers’ choice of the type of agricultural practices— is characterized here through the set of Nash equilibria when all farmers make their agricultural innovation’s decision simultaneously. We define a pure-strategy Nash equilibrium (NE) in terms of the payoffs players receive from various pure-strategy profiles:
Definition 1. A pure-strategy profile s∗ ∈ S is a NE of Γ if and only if U
i(s∗) ≥
Ui
¡ si, s∗−i
¢
for all si ∈ Si and all i ∈ I.
Let LΓ denote the set of Nash equilibria of the game Γ. Let s1 ∈ S and s0 ∈ S
be feasible strategy profiles, where s1 (respectively s0) is the strategy profile such that
all farmers choose to purchase and to use the recommended commercial inputs package during the opening of the next cropping cycle, i.e., si = 1 for all i (respectively opt for
the agricultural status quo at sowing, i.e., si = 0, for all i). First, we obtain the following
result proved in Appendix A.
Proposition 1. Under Assumptions 1-3, {s0, s1
} ∈ LΓ.
17Thus, the identity of the players does not matter and we do not need to consider strategy profile
Proposition 1 states that the strategy profile where all farmers choose the agricultural status quo (si = 0, all i ) and the strategy profile where they all use the recommended level
of biotechnology in their agricultural activities (i.e., si = 1, all i) are both Nash equilibria
of the non-cooperative game Γ.
Before we proceed to derive further policy implications from the result outlined in Proposition 1, we must address the question of whether the strategy profiles s0 and s1 are
indeed the only stable equilibria of the symmetric game, Γ. After all, there is no a priory guarantee that a symmetric game with strategic complementarities only has symmetric equilibria. Therefore to address this issue of whether {s0, s1
} are indeed the only equilibria of the modernization game, we first show that Γ is indeed a supermodular game (as this concept is defined and used in Paul Milgrom and John Roberts [1990]), also known as a game characterized by strategic complementarities.
Definition 2. (Paul Milgrom and John Roberts [1990]) Γ is a supermodular game, if for all i,
(i) Si is a compact subset of <;
(ii) Ui is upper semi continuous in si, for each fixed s−i;
(iii) Ui is continuous in s−i, for each fixed si;
(iv) Ui has a finite upper bound;
(v) Ui has (strictly) increasing differences in (si, s−i) on Si× S−i.
In particular, property (v) of Definition 2 implies that, for a typical small self-employed farmer i, the incremental gain from taking a higher action is higher, when other farmers also play their highest action: for all s0i > si and s0−i > s−i,18
18As an implication of property (v) of Definition 3, each player will therefore choose a higher action
Ui ¡ s0i, s0−i¢− Ui ¡ si, s0−i ¢ ≥ Ui(s0i, s−i)− Ui(si, s−i) .
The importances of supermodular games in this paper lies with several crucial properties these games have. First, the major characteristic of games with strategic complementarities is the presence of Pareto-ranked equilibria, which creates the possibility for coordination failures (Peter A. Diamond [1982]; Russell Cooper and Andrew John [1988]). Second, with a supermodular game, there is no need for mixed-strategies to ensure the existence of a Nash equilibrium, as the existence of equilibrium of such game does not require continuity of best response function (i.e., application of Alfred Tarski’s fixed point theorem). Third, as an implication of supermodularity, we can easily restrict our analysis to NE in pure strategies, because when a supermodular game has mixed strategy equilibria, these equilibria are always «unstable» under a variety of dynamic adjustment process (Federico Echenique [2002]; Federico Echenique and Aaron S. Edlin [2004]).
To show that the farming modernization game, Γ, is supermodular, it suffices to prove that properties (i)−(v) above are satisfied. We prove the following proposition in Appendix B.
Proposition 2. Under assumptions 1-3, the symmetric farming modernization game Γ, is supermodular.
Proposition 2 implies that conditions underlying Donald M. Topkis’ theorem apply, so that for the game Γ, each small self-employed farmer’s best response function ζi : S−i → Si
, where
ζi(s−i)∈ arg maxs
i
Ui(s) ,
is strictly increasing in the strategy profile chosen by players other than herself: for all i, and for all s0
−i > s−i, ζi
¡ s0
−i
¢
> ζi(s−i). Indeed, given the properties of the function ζi,
a pure-strategy Nash-equilibrium of Γ always exists, by the application of Alfred Tarski’s fixed-point theorem.
Now, since the best replies, ζi(s−i), are increasing, players’ strategies are complements, implying that Γ indeed admits multiple pure-strategy Nash equilibria. Thus, to rule out asymmetric pure-strategy Nash equilibria, we show in the following Lemma —which we proved in Appendix C—, that farmers’ best responses are single-valued correspondences (i.e., each ζi is a function):
Lemma 1. Let ζi(s−i) = {si : si ∈ arg maxsi∈Si Ui(si, s−i)}, for all i, given s−i. Then,
under Assumptions 1-3, ζi(s−i) is a singleton.
Lemma 1 states that given s−i ∈ S−i, Ui(., s−i)has a unique maximizer in Si. In other
words, players best replies are single-valued. This result combined with the application of Topkis’ theorem rules out the existence of asymmetric pure-strategy Nash equilibria for the farming modernization game, Γ. Hence the following proposition:
Proposition 3. Under Assumptions 1-3 , {s0, s1
} = LΓ.
Proposition 3 states that the strategy profile where all farmers elect to maintain the status quo and the one where they all elect to save and therefore modernize their agri-cultural practices are the only pure-strategy Nash-equilibria of the farming modernization game, Γ.
As an implication of Proposition 3, it follows that, in an environment with strategic complementarities, individual (farm-level) adoption of high-productive land-saving biotech-nologies introduced in the community is strongly determined by the aggregate behavior. In other words, "when in Rome", it pays to "do as the Romans do".
The multiplicity of equilibria outlined in Proposition 3 suggests that there is a role for a potential deliberate action to help farmers in selecting one of these equilibria. But such an action is desirable only if the two equilibria can be ranked according to the Pareto principle. The following Proposition therefore establishes the needed ranking.
Proposition 4. Under Assumptions 1-3, the symmetric pure-strategy profile s1 Pareto dominates the profile s0.
Proof. To prove this Proposition, it suffices to show that for all i ∈ I, and for all si ∈ Si, Ui(s1)− Ui(s0) > 0. To proceed, let Λi ≡ Ui(s1)− Ui(s0) .From the definition of
the payoff function Ui, the difference Λi reduces to
Λi = β [u (¯π)− u (π)] − [u (π) − u (π − k)]
The result simply follows from condition (II.7). This completes the proof.
Proposition 4 states that the strategy profile where all farmers elect to modernize their farming practices by adopting high-productive land-saving biotechnologies is strictly pre-ferred to the one where they all elect to maintain the status quo. Because the modernization equilibrium (i.e. s1) is counter-intuitive for SSA economies characterized by a persistent
low performance of the agricultural sector, our analysis suggests that SSA’s persistent poor record of agricultural modernization reflects a coordination failure in farmers’ savings strategies. Our analysis also suggests that the creation of new, less-fungible savings prod-ucts by helping SSA farmers overcome social pressures to divert their savings from their intended use may indeed boost modernization of SSA agriculture.
III. Conclusion
This paper had two principal goals. The first was to show how the sociocultural context impacts farmers’ decisions to modernize their agricultural activities. The sociocultural context we considered was highlighted by the prevalence, in African rural communities, of traditional sharing obligations that present innovation-minded individuals with self-control problems on their private financial and non financial assets. The second goal was to inves-tigate necessary and sufficient conditions for farmers to modernize their farming practices. We drew from the existing literature in assuming that the introduction of high-productivity, land-saving biotechnologies in agriculture was a determining factor of on farm productiv-ity increase. We also maintain that the African environment, with the exception of war-torn countries, potentially offers profitable economic opportunities for smallholder farmers,
which, according to neo-Boserupian theorists accounts for the decision to introduce tech-nological innovations in agriculture. To achieve these two goals, we used a game-theoretic framework featuring a supermodular game of farming modernization decision between ex ante homogenous self-employed farmers. We demonstrated that this game admits two pure-strategy, Pareto-ranked, symmetric Nash-equilibria. The equilibrium where all farm-ers choose to modernize their farming methods is preferred to the one where all of them choose to remain trapped in the agricultural status quo. Because of the multiplicity of equilibria, we concluded that, scarcity and economic opportunities for farmers, which have been put forward by neo-Boserupian agricultural economists as determinants for the onset of technological innovations in agriculture, are, in the context of African countries, only necessary, but not sufficient to generate modernization of farming methods. Indeed, co-ordination failures in farming modernization choices may prevent farmers from mitigating traditional sharing obligations that hinder their saving efforts. We argued that a sufficient condition for the introduction of land-saving technologies in African countries to succeed in increasing food crop supply is, put in Jean Phillipe Platteau’s words, to provide a so-cially accepted alibi to protect people’s savings against all sorts of social pressures. This could be done, for example, by introducing new savings products say, non-refundable and non-transferable vouchers as argued by Esther Duflo [2006]. Such savings technology may help mitigate social pressures that increase the fungibility of farmers’ savings.
IV. Appendix
A. Proof of Proposition 1.
The proof is divided in two claims: Claim 1 The strategy profile s0 = (s0
1, ....s0i, ....s0N) such that si = 0, for all i, is a
pure-strategy Nash equilibrium of Γ.
Proof: Using the definition of a payoff function, it follows from definition 1 that the profile s0 is a strict pure-strategy NE of Γ if and only if the following condition is always
satisfied for all i:
u (π) (1 + β)− V (1, 0) ≥ 0 (IV.1)
Since n∗ > 1, the result then clearly follows from the definition of function V, and the
strictly increasing property of the function u i.e., u (π) > u (π − k). Claim 2. The strategy profile s1 = (s1
1, ....s1i, ....s1N) such that si = 1 , for all i, is a
pure-strategy Nash equilibrium of Γ.
Proof: With inequality (II.7) in hands, the proof follows in the same manner as in claim 1. Hence the result.
B. Proof of Proposition 2.
To prove proposition 2, first, observe that for all i, Si = {0, 1} , is clearly a compact
subset of <, since Si is closed and bounded. Therefore property (i) of a supermodular
game is trivially satisfied. Second, to establish property (ii) and (iii), it suffices to prove the following claim:
Claim 1. For all i ∈ I, the function Ui : S → <, is continuous on S, where S = ×i∈ISi.
Proof. Since Si is finite for all i, it follow that S is also finite, as the Cartesian product
N is a finite number. Therefore, by theorem19, U
i is continuous on S. This establishes
property (ii) and (iii) of a strictly supermodular game.
Third, to establish property (iv) , it suffices to prove the following claim: Claim 2. For all i ∈ I, the function Ui : S → <, attains a maximum on S.
Proof. Since the set of feasible joint strategies reduced to S is finite and has no more than 2N elements, we also have that V
i(S)⊂ < is also finite; and finite subsets of < always
contain their upper and lower bounds. It therefore follows that, Ui has a finite upper bound
on S. This completes the proof of this claim.
Fourth, the following claim establishes property (v) .
Claim 3. Under assumptions 1-3, the function Ui : S → < has increasing differences
in (si, s−i) on Si× S−i : for all i∈ I, for all s0i > si and s0−i > s−i,
Ui ¡ s0i, s0−i¢− Ui ¡ si, s0−i ¢
≥ Ui(s0i, s−i)− Ui(si, s−i) (IV.2)
Proof. Suppose that for all i ∈ I, s0i > si and s0−i > s−i but,
Ui ¡ s0i, s0−i¢− Ui ¡ si, s0−i ¢
< Ui(s0i, s−i)− Ui(si, s−i) . (IV.3)
We will show that inequality (IV.3) leads to a contradiction. First, observe that in-equality (IV.3) can be written as follows:
Ui ¡ s0i, s0−i¢− Ui(s0i, s−i) < Ui ¡ si, s0−i ¢ − Ui(si, s−i) . (IV.4)
Next, since si ∈ {0, 1}, for all i ∈ I, take s0i = 1 and si = 0. Then , it can be shown
that (IV.4) reduces to
V (1, n0)− V (1, en) < 0 (IV.5)
where
n0 = 1 +X j s0j en = 1 +X j sj Since s0
−i > s−i,its follows by construction thaten < n0. Now, If en < n0 < n∗ then from
(II.6), it follows that V (1, n0)− V (1, en) = 0 and we reach a contradiction. If en < n∗ ≤ n0
instead, then (IV.5) reduces to
u (¯π)− u (π) < 0.
Contradiction again, since by Assumption 2, the function u (.) is strictly increasing in its argument, i.e., u (¯π) > u (π). This completes the proof
C. Proof of Lemma 1.
Proof. To prove Lemma 1, it suffices to show that given s−i ∈ S−i, and for all pairs (s0
i, s1i) ∈ Si × Si such that s0i 6= s1i, Ui(s0i, s−i) 6= Ui(s1i, s−i). Suppose by way of
contradiction that for some i ∈ I , and for some bs−i ∈ S−i, we have
Ui ¡ s0i,bs−i ¢ = Ui ¡ s1i,bs−i ¢ (IV.6) Since Si ={0, 1}, for all i ∈ I, take s0i = 0and s1i = 1. Then, we can rewrite (IV.6) as
follow:
Ui(0,bs−i) = Ui(1,bs−i) ,
which, using the definition of function Ui, reduces to
(1 + β) u (π) = V (1,bn) (IV.7)
where
bn =X
i
Now, suppose thatbsj = 0, for all j 6= i. Then, since 1 < n∗, equality (IV.7) reduces to
u (π) = u (π− k) (IV.8)
which is a contradiction of Assumption 2 implying that u (π) > u (π − k) . Likewise, suppose that bsj = 1, for all j 6= i. If bn < n∗,then, equality (IV.7) reduces again to (IV.8)
and we also reach a contradiction once more. If bn ≥ n∗, then (IV.7) reduces to
(1 + β) u (π) = u (π− k) + βu (¯π) (IV.9)
which contradicts condition (II.7) implying that (1 + β) u (π) < u (π − k) + βu (¯π) . Hence the result.
References
[1] Ambec, Stefan and Treich, Nicolas. (2002) “Roscas as financial agreements to cope with social pressures”, mimeo, University of Grenoble.
[2] Besley, Timothy. and Case, Anne (1994) Diffusion as a Learning Process: Evidence from HYV Cotton, RPDS, Princeton University, Discussion Paper No. 918.
[3] Boserup, Esther (1965) The Conditions of Agricultural Growth. Chicago: University of Chicago Press.
[4] Chao-Béroff Rénée. (2003): “Rural Savings Mobilization in West Africa: Guard Against Shocks or Build an Asset Base?”, MicroBanking Bulletin, July 2003.
[5] Conning Jonathan. and Udry Christopher. (2005): “ Rural Financial Markets in De-veloping Countries”, The Handbook of Agricultural Economics, Vol. 3.
[6] Conley, Timothy and Udry, Christopher (2005). “Learning About a New Technology: Pineapple in Ghana”, mimeo, Yale.
[7] Cooper, Russell and Andrew John (1988), “Coordination Failures in A Keynesian Models”, The Quarterly Journal of Economics, vol. 103(3): 441-463.
[8] De Soto, Hernando. (2000), The Mystery of Capital: Why Capitalism Succeeds in the West and fails almost everywhere else. New York: Basic Books.
[9] Diagana, Bocar. (2003) “Land Degradation in Sub-Saharan Africa: What Explains the Widespread Adoption of Unsustanaible Farming Practices?”, mimeo, Department of Agricultural Economics and Economics, Montana State University.
[10] Diamond Peter A (1982) “ Aggregate Demand Management in Search Equilibrium”, Journal of Political Economy, Vol. 90, 881-94.
[11] Duflo, Esther (2006) “Poor but Rational?”, forthcoming in Understanding Poverty, A. Banerjee, R. Benabou, and D. Mookherjee (eds), Oxford University Press.
[12] Duflo, Esther, Kremer, Michael., and Robinson, Jonathan. (2005) “Understanding Technology Adoption: Fertilizer in Western Kenya. Preliminary Results from Field Experiments”, Mimeo, MIT, Harvard and Princeton.
[13] Echenique, Frederico (2002) “ Comparative Statics by Adaptive Dynamics and the Correspondence Principle”, Econometrica, Vol.70, No. 2, 833-844.
[14] Echenique, Federico. and A. Edlin (2004) “Mixed Strategy Equilibria are Unstable in Games of Strategic Complements”. Journal of Economic Theory, 118: 61-79.
[15] Feder Gershon, Just Richard and Zilberman David (1985) “Adoption of Agricultural Innovations in Developing Countries:A Survey”, Economic Development and Cultural Change, 33 (2), 255-98.
[16] Foster, Andrew D. and Rosenweig, Mark R. (1995) “Learning by Doing and Learn-ing from Others: Human Capital and Technical Change in Agriculture”, Journal of Political Economy, 103, 1176-1209.
[17] Goldman, Abe (1993) “Agricultural Innovation in Three Areas of Kenya: Neo-Boserupian Theories and Regional Characterization”, Economic geography, 69(1), African development, 44-71.
[18] Gugerty, Mary Kay. (2003) “You Can’t Save Alone:Testing Theories of Rotating Sav-ings and Credit Associations in Kenya”, mimeo, University of Washington.
[19] Hayami, Yujiro and Ruttan, Vernon M (1985) Agricultural Development: An interna-tional Perspective, Johns Hopkins University Press, Baltimore
[20] McGuirk, Anya and Yair Mundlak (1991) Incentives and Constraints in the Transfor-mation of Punjab Agriculture, Research Report 87. International Food Policy Research Institute, Washington, DC.
[21] Milgrom, Paul and Robert John (1990). “Rationalizability and Learning in Games with Strategic Complementarities”. Econometrica, 58, 1255-1278.
[22] Platteau, Jean Phillipe. (2000) Institutions, Social Norms and Economics Develop-ment. Harwood Academic Publisher, U.S.A
[23] Resnick, Danielle. (2004) “Smallholder African Agriculture: Progress and Problems in Confronting Hunger and Poverty”. DSGD Discussion Paper 9, International Food Research Institute (IFPRI).
[24] Roumasset, James A.(2004) “Rural Institutions, Agricultural Development, and Pro-poor Economic Growth”, Asian Journal of Agriculture and Development, 2004, vol. 1, issue 1, pages 61-82
[25] Spencer, Dunstan (2001) “Will they survive? Prospects for Small Farmers in Sub-Saharan Africa,” presented at the Sustainable Food Security for all by 2020 Conference in Bonn, Germany, September 4-6.
[26] Sunding, Davis, and David Zilberman (2000) “The Agricultural Innovation Process: Research and Technology Adoption in a Changing Agricultural Sector”, for the Hand-book of Agricultural Economics.
[27] Tarski, Alfred (1955) “A Lattice Theoretical Fixed-point Theorem and its Applica-tions”, Pacific Journal of Maths, 5, 285-309.
[28] Topkis, Donald M. (1968) Ordered Optimal Decisions. PhD. Dissertation, Stanford University.
[29] United Nations Standing Committee on Nutrition (UNSCN). 2004. Fifth Report on the World Nutrition Situation: Nutrition for Improved Development Outcomes. Geneva, Switzerland.
[30] Verstralen Karin. (2001) “Rural Livelihood Strategies: savings for survival, protection or accumulation? Manuscript, presented at the Livelihood, Savings and Debt in a Changing World: Developing Anthropological and Sociological Perspectives Confer-ence, Wageningen, Netherlands, May 14-16.
[31] Wendy James (1979) Kwanim Pa, The Making of the Uduk People. Clarendon Press, Oxford, United Kingdom.
[32] World Bank (1993) A Strategy to Develop Agriculture in Sub-Saharan Africa and a Focus for the World Bank. Technical Dept, Africa Region. Washington, DC.
[33] World Bank (1997) World Development Report, 1980-1997. Washington, DC.
[34] World Bank (1999) Agricultural Incentives in Sub-Saharan Africa: Policy Challenges. Washington, DC.