Sleep Bruxism is Associated with a Rise in Blood
Pressure
by Angela Nashed
Department of Biomedical Science Faculty of Medicine
This thesis is presented to the Faculté des études supérieures in preparation for a Master’s (Msc) for Angela Nashed
in Sciences Biomédicales option General
April, 2010
Faculté des études supérieures
This thesis is titled:
Sleep Bruxism is Associated with a Rise in Blood Pressure
Presented by: Angela Nashed
It will be evaluated by a jury composed of the following individuals:
Dr. Florin Amzica, Chairman Dr. Gilles Lavigne, Research Director
Dr. Paola Lanfranchi, Co-Director Dr. Réginald Nadeau, Jury Member
Résumé
Objectifs : Le bruxisme survenant au cours du sommeil est un trouble du movement caractérisé par du grincement de dents et l’activité rythmique des muscles masticateurs (ARMM). Le bruxisme/ARMM est souvent associé à des mouvements du corps et des à éveils corticaux. Une séquence d’activation précède le ARMM/bruxisme. Ces événements incluent une augmentation des variables suivants : l’activité sympathique (-4 minutes), les activités encéphalographique (-4 second), le fréquence cardiaque, l’amplitude de la respiration (-1 second) et l’activité des muscle suprahyoïdiens (-0.8 second). La présente étude a examiné l’association entre le bruxisme et les changements de la pression artérielle. Méthodes: Dix sujets avec le bruxisme (5 hommes, 5 femmes, âge moyen = 26 ± 1,8) ont complétés 3 nuits de polysomnographie qui comprenait l'enregistrement non invasive de la pression artérielle. La première nuit a servi de dépistage et d’habituation au laboratoire. L'analyse a été réalisée sur les deuxièmes et troisièmes nuits enregistrements. Seuls les épisodes de bruxisme isolés survenant au cours du stade 2 du sommeil ont été utilisés pour l’analyse, pour un total de 65 épisodes. Les mesures des pressions systolique et diastolique ont été prises 20 battements avant et 23 battements après l'apparition de chaque épisode bruxisme lors du sommeil. Les épisodes de bruxisme ont été classés comme suit: 1) bruxisme avec éveil cortical; 2) bruxisme avec mouvement du corps (MC), 3) bruxisme avec éveil cortical et MC. Une quatrième catégorie, bruxisme seul, a également été analysée, mais utilisée comme donnée préliminaire puisque la catégorie se composait de seulement 4 épisodes de bruxisme.
Résultats: Les deux pressions systolique et diastolique ont augmenté avec les épisodes de bruxisme. Cette augmentation a été statistiquement significative pour la pression systolique et diastolique pour les épisodes de bruxisme avec éveil cortical et/ou MC (p ≤ 0,05). L’augmentation moyenne de la pression (systolique / diastolique ± SE) a été : 28,4 ± 2,4/13,2 ± 1,5 mm Hg pour le bruxisme avec éveil cortical; 30,7 ± 1,6/19.4 ± 2.3 mm Hg pour bruxisme avec MC; 26.4 ± 2,8 / 14,6 ± 2.0mm Hg pour bruxisme avec éveil cortical et MC; 22,9 ± 5,2/12,4 ± 3,3mm Hg pour les épisodes de bruxisme seuls.
Conclusion: Le bruxisme du sommeil est associé à des hausses de la pression artérielle pendant le sommeil. Cette hausse est supérieure dans les épisodes de bruxisme associés à un éveil cortical et / ou MC, qui sont souvent associés avec les événements bruxisme. Ces résultats sont en accord avec nos observations antérieures, où le bruxisme est précédé par une augmentation de l'activité sympathique et de la tachycardie sinusale.
Abstract
Objectives: Sleep Bruxism (SB) is a movement disorder identified by tooth grinding and rhythmic masticatory muscle activity (RMMA). It is often associated with body movements and sleep arousals. Increases in autonomic sympathetic activities that characterize sleep arousal precede SB. These events include an augmentation of the following variables: sympathetic cardiac activity (-4 minutes), electroencephalography frequencies (-4 seconds), heart rate and respiratory amplitude (-1 seconds), and suprahyoid muscle activity (-0.8 seconds). This study examined whether these sympathetic activities are associated with significant changes in arterial blood pressure (BP).
Methods: Ten subjects with SB (5 male; 5 female; mean age ± standard error = 26 ± 1.8) underwent 3 nights of full polysomnography that included non-invasive beat to beat BP recording. The first night served as a screening and habituation night. Analysis was performed on second and third night recordings. Overall analysis was based on single SB episodes occurring in stage 2 sleep only, for a total of 65 episodes. Systolic and diastolic BP measurements were taken from a window of 20 beats before and 23 beats after onset of each SB episode. SB episodes were categorized as: 1) SB + cortical arousal; 2) SB + body movement (BM); 3) SB + cortical arousal + BM. A fourth category, SB alone, was also analysed but used as preliminary data since the category consisted of only 4 episodes. Results: Both systolic and diastolic BP increased with SB episodes. This increase was significant for both systolic and diastolic BP for SB events with cortical arousal and/or BM (p≤0.05). The average BP surges (systolic/diastolic ± SE) were: 28.4 ± 2.4/13.2 ± 1.5mm Hg for SB + cortical arousal; 30.7 ± 1.6/19.4 ± 2.3mm Hg for SB + BM; 26.5 ± 2.8/14.6 ± 2.0mm Hg for SB + cortical arousal + BM; 22.9 ± 5.2/12.4 ± 3.3mm Hg for SB episodes occurring alone.
Conclusion: Sleep bruxism is associated with blood pressure fluctuations during sleep. This BP surge is greater in SB episodes associated with cortical arousal and/or BM, which often co-occur with SB events. These results are congruent with our previous observations, where SB is preceded by a rise in sympathetic activity and sinus tachycardia.
Keywords : sleep, sleep bruxism, blood pressure, cortical arousal, body movement, rhythmic masticatory muscle movement
Abbreviations
ARMM Activité rhythmique des muscles masticateurs A.V. Atrioventricular
BM Body movement
BP Blood pressure
CAP Cyclic alternating pattern
DMH Dorsomedial hypothalamic nucleus EEG Electroencephalogram
EMG Electromyogram EOG Electrooculogram
GABA Gamma-aminobutyric acid
HF High frequency
LDT Laterodorsal tegmental nuclei
LF Low frequency
MC Mouvement du corps MnPO Median preoptic nucleus
PLMS Periodic leg movement during sleep
PSG Polysomnography
PNS Parasympathetic nervous system PPT Pedunculopontine nuclei
REM Rapid eye movement RLS Restless leg syndrome
RMMA Rhythmic masticatory muscle activity RHT Retinohypothalamic tract
RSA Respiratory sinus arrhythmia S.A. Sinoatrial
SB Sleep bruxism
SDB Sleep disordered breathing SE Standard error
SNS Sympathetic nervous system SRRI Serotonin reuptake inhibitors SWA Slow wave activity
SWS Slow wave sleep
Table of Contents
CHAPTER 1: INTRODUCTION ... 15
1.1 SLEEP PHYSIOLOGY ... 16
1.1.1 NREM and REM Sleep... 16
1.1.2 Sleep Regulation and Consolidation ... 18
1.1.3 Two Process Model of Sleep... 18
1.1.4 Sleep Mechanisms... 19
1.1.5 Sleep/Wake Circadian Rhythm and Biological Clock... 22
1.2 CARDIOVASCULAR FUNCTION DURING WAKE AND SLEEP... 23
1.2.1 Cardiovascular Autonomic Regulation... 23
1.2.3 Cardiovascular Autonomic Regulation and Sleep ... 26
1.3 SLEEP BRUXISM... 27
1.3.1 Definition: ... 27
1.3.2 Epidemiology ... 29
1.3.3 Risk Factors and Consequences... 29
1.3.4 Physiological Characteristics and Mechanisms ... 30
1.3.5 Diagnosis... 33
1.3.6 Management... 34
1.4 AROUSALS, PLMS, AND BP DURING SLEEP ... 35
1.4.1 Arousals: Cardiovascular Response from Sleep ... 35
1.4.2 PLMS and BP during Sleep ... 35
1.5 OBJECTIVES ... 36 1.6 HYPOTHESIS ... 36 CHAPTER 2: ... 37 2.1 ABSTRACT... 38 2.2 INTRODUCTION ... 39 2.3 METHODS ... 40 2.3.1 Study Population ... 40
2.3.2 Subject Recruitment... 41
2.3.3 Polysomnography... 42
2.3.4 Data Collection ... 43
2.3.5 SB Selection and SB Categories ... 43
2.3.6 Data Analysis ... 44
2.3.7 Statistical Analysis... 45
2.4 RESULTS ... 45
2.4.1 BP Changes with SB Episodes... 46
2.4.2 Differences in BP Increments between SB Categories ... 47
2.5 DISCUSSION ... 48
CHAPTER 3: DISCUSSION... 66
CHAPTER 4: CONCLUSION... 72
List of Tables
Table 1: Subject Demographics and Baseline BP during Wake...53 Table 2: PSG Summary with RMMA, PLSM, Cortical Arousal, and Respiratory Indices ………...54 Table 3: Distribution of Single SB Episodes Selected for each Subject...55 Table 4: Mean SDP and DBP Increases from Baseline for each SB Category, and Overall Group Effect………...…………...…...56 Table 5: Start, Peak, and End of Significant BP Increase in Relation to SB Onset for Each SB Category………...………...57 Table 6: Difference in BP Surges between the SB Categories: Multilevel Analysis and Paired T Test Results…...58
List of Figures
Figure 1: Physiological Events Preceding SB...33
Figure 1.1: BP Increase associated with SB...63
Figure 1.2: Changes in DBP in the four SB Categories...65
Acknowledgments
I would first like to thank my director Dr. Gilles Lavigne, and co-director Dr. Paola Lanfranchi, for providing me with this research opportunity and for offering me so much support and encouragement throughout the process. I have learnt so much from them both and feel very grateful to have had the chance to work under two supervisors who are so knowledgeable and passionate about their fields, and who are also so personable and humble.
To the sleep laboratory team at Université de Montréal, I send my sincere gratitude. They made this research experience so positive and successful and I know I am very
fortunate to have worked with such an exceptional group of people. In particular, I would like to thank Christiane Manzini and Carmen Remo for their generous assistance and direction; Hajar El Alaoui for all her administrative and technical help; Pierre Rompré for his statistical contribution and his ability to make the statistical process surprisingly fun, as well as his ongoing interest and feedback in the project; Maria Clotilde Carra for being a super and always uplifting study mate and friend; Lorraine Fradette for making time to meet with me, at times outside of work, to help whenever I had any questions about the analysis and program; all the technicians and support staff at the sleep laboratory at Sacre Coeur Hopsital.
I would like to say a very special thank you to Nelly Huynh, aka ‘nelly boss’, who gave so much of herself to this project, and pushed me from beginning to end so that it could be completed in due time. Her feedback, advice, and understanding were truly invaluable.
Finally, I would like to thank my dear family: Dad, Mom, Joe and Mat, as well as my closest friends for giving me so much love and guidance.
CHAPTER 1: INTRODUCTION
Sleep is an active state that occupies on average 1/3rd of a person’s lifetime. Despite the many theories surrounding its function its exact purpose is still not yet understood. There are two distinct stages that characterize sleep: Rapid Eye Movement (REM) sleep and Non Rapid Eye Movement (NREM) sleep. Variability within these stages allows for further classification, where NREM sleep is broken into stages 1, 2, 3 and 4. Stages 1 and 2 are known as ‘light sleep’, and stages 3 and 4 are referred to as deep, or slow wave sleep (SWS). REM sleep is divided into two phases: phasic and tonic REM. These stages may be classified using standard methods of polysomnography (PSG) which involve: electroencephalogram on the scalp (EEG), electrooculogram (EOG) lateral to each eye, and electromyogram (EMG) on the chin. Autonomic regulation including cardiovascular changes involving blood pressure (BP) and heart rate differ in sleep versus wakefulness and also between sleep stages.
Involuntary movements are not uncommon during sleep and may be classified as a movement disorder type parasomnia depending on the severity. Examples of such include teeth grinding, clinically known as sleep bruxism (SB), and restless leg syndrome (RLS). RLS, in particular, is often accompanied by periodic limb movements (PLMS) which are involuntary movements of the leg that have been shown to be accompanied by BP surges during sleep (1). Few studies have examined whether SB causes similar effects, illustrating the aim of this study. This review shall first describe sleep and its physiological mechanisms. It shall then discuss the cardiovascular changes that occur during sleep, followed by a description of the pathophysiology of SB. It will conclude by addressing the
cardiovascular changes associated with PLMS and how similar manifestations are suspected to occur in SB.
1.1 SLEEP PHYSIOLOGY
1.1.1 NREM and REM Sleep
A normal bout of sleep typically consists of 3 – 6 cycles of alternating NREM and REM periods. These cycles, which are controlled by the ultradian process, range from 90 – 120 minutes each (2). Upon sleep onset a decrease in EEG frequency activity, increase in EEG amplitude and a decrease in muscle activity are evident in normal sleepers (3). Further, the first sleep cycle usually begins in stage 1 and progresses throughout the NREM stages until REM sleep is initiated, usually occurring within 80 minutes after sleep onset (4).
Stage 1 of NREM sleep serves mainly as a transitional stage between wake and sleep. Usually only 1 – 7 minutes or 2-5% of total sleep time is spent in this stage (2). It is characterized by theta waves (EEG range 5-9Hz) (5) and contains a low arousal threshold such that a person can be easily awakened when in this state (4). Stage 2 sleep consumes approximately 10-25 minutes of a sleep cycle and is characterized by EEG sleep spindles and K complexes (6). These are 2 types of EEG waves that carry a distinct morphology and frequency range. K complexes in particular are high amplitude biphasic waveforms that occur either spontaneously or in relation to sensory stimuli and are often related to arousal (7). Stage 2 sleep is deeper such that the type of stimuli that would normally
generate an arousal in stage 1 would result in a K complex in stage 2. Stage 2 sleep comprises approximately 45-55% of total sleep time (4). Stages 3 and 4 (SWS) are comprised mainly of low frequency, high amplitude delta waves (EEG range 0.5-4.5Hz) that represent sleep intensity (8). SWS comprise approximately 13-23% of sleep and its percentage and depth decrease significantly with age and this change has been shown to occur differently in men compared to women (4;9). Further, the EEG power of slow wave activity (SWA) in SWS is an indicator of sleep depth (10). Postural muscle tone is decreased during NREM sleep as a result of changes in action potential discharge (11). Heart rate, blood pressure and respiration are significantly reduced during NREM sleep (12). Collectively, NREM stages are associated with sleep restoration.
REM sleep differs from NREM on various levels. First, it is most notably characterized by rapid eye movements, muscle hypotonia (during tonic phase), and an EEG that resembles wakefulness (desynchronized, low amplitude). Due to the contrast between these latter two features the state is also known as ‘paradoxical sleep’. REM sleep is associated with intense dreaming, cessation of thermoregulation, and irregular cardiac and respiratory activities leading to heart rate, BP, and respiratory instability (3). These irregularities normally occur during the phasic events of REM sleep and are often accompanied by brief muscle twitches. Ponto-geniculo occipital (PGO) spikes, which are forms of electrical potentials specific to REM sleep, are also signature features of this state and are linked to rapid eye movements. The exact physiological and psychological purpose for REM sleep, relating to health, is unknown.
1.1.2 Sleep Regulation and Consolidation
Current literature supports the hypothesis that sleep consolidation is achieved via three integrated processes: i) Process S, which represents homeostasis of sleep regulation; ii) Process C, which represents the circadian rhythm process; iii) Ultradian process, which involves NREM and REM cycles during sleep. Process S is described as the homeostatic drive for sleep where during wakefulness the physiologic ‘need for sleep’ builds up in the body and diminishes during sleep recovery. This homeostatic sleep drive is represented by NREM sleep such that following sleep deprivation enhanced NREM SWS is observed rather than significant increases in sleep duration (13). Process C describes the circadian component of sleep regulation. The circadian rhythm in mammals is a biological rhythm that runs on a 24hr cycle except under ‘free running’ conditions, (i.e. when external environmental cues are absent from the cycle). Its physiology will be discussed more in further sections.
1.1.3 Two Process Model of Sleep
Although the length of a single NREM/REM sleep cycle remains relatively constant throughout sleep duration their relative proportions shift with each cycle. Specifically, the first 2/3rds of sleep consist more of NREM than REM sleep and this proportion decreases with progressing cycles. Conversely, the proportion of REM sleep increases in length with each consecutive cycle, and thus dominates the final 1/3 part of sleep. According to the two process model of sleep regulation a homeostatic sleep pressure exists that corresponds to a
‘sleep drive’ that accumulates during wakefulness. This pressure decreases upon sleep onset since the need for sleep is being met, and is believed to be represented by NREM sleep; more specifically the power of EEG (SWA). This notion is supported by the NREM cycle pattern, which shows that NREM and specifically SWA are long and more intense during the first few sleep cycles, due to the high homeostatic sleep drive accumulated during wakefulness, and decreases with ongoing sleep in conjunction with the reducing homeostatic sleep pressure. Simultaneously, the circadian sleep drive rises during later sleep cycles to compensate for this decreased homeostatic sleep pressure, allowing for sleep consolidation and prevention of early awakenings. Thus, it is the integrated activities between the homeostatic and circadian sleep drive that allow sleep to be sustained for a full 7-9 hours (13;14).
1.1.4 Sleep Mechanisms
i) Wake
Wakefulness is actively maintained via the ascending reticular activating system in the brain. It is mainly achieved via two pathways: i) the dorsal pathway, which travels through the thalamus and involves cholinergic cells found in the pedunculopontine and laterodorsal tegmental nuclei (PPT/LDT); ii) the ventral pathway, which passes through the hypothalamus and basal forebrain and consists of monoaminergic cells originating in the following areas: noradrenergic locus coeruleus, serotoninergic dorsal raphe nucleus, dopaminergic ventral peraqueductal grey matter, and histaminergic tuberomammillary nucleus (15-17). Cholinergic neurons exist in the basal forebrain which contributes
significantly to arousal. Further, there are selective neurons in the reticular formation that release glutamate and contribute to cortical activation as well (18-21).
The neurons in the monoaminergic system are known as ‘REM off’ cells in reference to their absence of firing during REM sleep compared to during wakefulness and other sleep states (22;23). In contrast, neurons of the cholinergic system show robust activity in both wake and REM states and are therefore referred to as ‘Wake on/REM on’ cells (24). In addition, there are a group of cells in the lateral hypothalamus which contain orexin/hypocretic neurons that are essential for reinforcing monoaminergic arousal activity and play a critical role in stabilizing wakefulness. These neurons are discussed further in following sections (25;26). The cortical activity generates EEG that consists of high frequency, low amplitude, desynchronized beta waves, (range 14-30Hz) (27).
ii) Sleep Onset
Sleep is initiated actively via inhibition of the arousal systems. The main source of this inhibition comes from the ventrolateral preoptic nucleus (VLPO) region, which release GABA and Galanin, and the median preoptic nucleus (MnPO), which releases GABA to these regions (28-31). The VLPO neurons are ‘warm-sensitive’ and release their inhibitory signals in response to increased temperature in this region (32). The core VLPO acts primarily on the histaminergic tuberomammillary nucleus, which influences transitions between arousal and NREM sleep (33-35). The extended VLPO acts primarily on the locus coeruleus and the dorsal and median raphe nuclei which influences REM sleep initiation (33). Collectively, these neurons are referred to as ‘NREM on’ cells and their activities are linked to homeostatic sleep regulation (36).
iii) The ‘Flip Flop Switch’
When the VLPO neurons fire during sleep they send inhibitory signals to the monoaminergic arousal system that depress arousal (37-39). Similarly, when the monoaminergic neurons are active during wakefulness they are sending inhibitory signals to the VLPO region. Specifically for wakefulness, noradrenaline and serotonin released from the monoaminergic pathway and GABA released from the tubermammillary nucleus, inhibit VLPO neurons and prevent them from initiating sleep (40-42). Therefore, it is apparent that both wake and sleep states are self reinforcing such that when one system is active it sends inhibitory signals to the opposing system. In other words, the mechanism that controls sleep and wakefulness is a mutual inhibitory system known as a ‘flip flop switch’. It acts to limit transitional states between wakefulness and sleep and ensure stability within each state (43).
Orexin/hypocrein neurons in the lateral hypothalamus play a major role in this system (25;26;44;45). These neurons contain major projections to the regions of the monoaminergic arousal pathway such that, when absent, the ability to sustain wakefulness is severely disrupted causing frequent switching between arousal and sleep, which is commonly seen in individuals with narcolepsy (26;46-48). In addition, when neurons in the VLPO region are damaged the ability to consolidate long bouts of sleep is interrupted, leading to severe sleep fragmentation (49). Thus, if one side of the sleep/wake switch is severed, a decrease in overall sleep/wake stability is produced (43).
REM is initiated by ‘REM on’ cells that originate in the pons and the medial medulla of the brain (50). These cells involve the neurotransmitters: acetylcholine, glutamate, glycine, and GABA (51;52). They promote REM behaviour as well as inhibit ‘REM off’ cells, which consist of the noradrenergic, serotonergic, and histaminergic cells, as previously mentioned (53-56). When these ‘REM off’ cells are inhibited by GABA their inhibition promotes further GABA release, reinforcing the REM state (57-60). The characteristic hypotonia of REM sleep is generated by the release of GABA and glycine by the medulla, as triggered by the pons’ via acetylcholine and glutamate (51;52).
1.1.5 Sleep/Wake Circadian Rhythm and Biological Clock
All mammalian cells follow a circadian rhythm. The ‘master biological clock’ that regulates the circadian rhythm of most cells and behaviours is the suprachiasmic nucleus (SCN) (61;62). It is situated in the anterior hypothalamus of the brain (63) and its regulation includes that of the sleep-wake cycle, implying its role in sleep regulation (64). Anatomically, the SCN receives light cues via the retinohypothalamic tract (RHT) which allows external daylight to entrain the circadian rhythm to 24hrs (65;66). The SCN connects densely to the subparaventricular zone (SPZ) where the dorsal aspect is suggested to regulate circadian rhythm of body temperature (67). The ventral aspect, in contrast, is densely connected to the dorsomedial hypothalamic nucleus (DMH). It is this region that contains major glutaminergic projections to the orexin/hypocretin lateral hypothalamus and GABAergic VLPO area, demonstrating the anatomical link between the SCN and sleep/wake regulation (67;68).
1.2 CARDIOVASCULAR FUNCTION DURING WAKE AND
SLEEP
1.2.1 Cardiovascular Autonomic Regulation
Autonomic regulation of the cardiovascular system is realized by the parasympathetic and sympathetic nervous systems. Both systems are centrally controlled by the medulla oblongata but are also significantly influenced by the hypothalamus and cortex. The parasympathetic nervous system’s (PNS) influence predominates in resting conditions, largely effecting resting heart rate and cardiac contractility. It exerts its effects via the vagus nerve by the release of acetylcholine. The sympathetic nervous system (SNS), in contrast, exerts a cardioacceleratory effect on the heart and causes vasoconstriction of the blood vessels and increased cardiac contractility via norepinephrine release. BP regulation is achieved via baroreceptors and chemoreceptors, which provide immediate responses to changes in BP and blood chemistry. As well, the renin-angiotensin-aldosterone system and vasopressin contribute to long term regulation of BP. The aim of this entire system is to ensure that oxygen demands are sufficiently being met via cardiovascular mechanisms (69). Parasympathetic and Sympathetic Activity
The PNS center is located in the dorsal motor nucleus and nucleus ambiguous region of the medulla. It is fast acting (0-0.5Hz) where pharmacological and surgical studies have shown that it is responsible for the high frequency (HF) component in spectral analysis of heart rate variability. Furthermore, this HF component is associated with the
respiratory rhythm and respiratory sinus arrhythmia (RSA). PNS activity functions cholinergically via acetylcholine release onto nicotinic and muscarinic receptors. It is regulated by the nucleus tractus solitarius in the hindbrain (70;71). The vagus nerve, which arises from this region, consists of a right and left component that innervate the sinoatrial (S.A) and atrioventricular (A.V) node of the heart, respectively. These are the only two direct innervations the PNS has to the heart and it induces a bradycardiac effect. At resting conditions the PNS is the main contributor to heart rate regulation. Blood vessels do not have direct parasympathetic innervations (72).
The sympathetic center is located in the rostral ventrolateral medulla and its activity is regulated by the medullary reticular formation, the same area involved in wake and arousal activation (73). The SNS response is slower than the PNS (0.1Hz), thus under spectral analysis it mainly contributes to the low frequency (LF) components of heart rate and BP oscillations (74). The system functions via the release of norepinephrine from sympathetic postganglionic neurons, and epinephrine from the adrenal medulla. Norepinephrine and epinephrine bind to two types of adrenergic receptors: alpha and beta. Alpha receptors induce vasoconstriction. Alpha1 receptors in particular contribute to increased cardiac contractility. Beta1 receptors located on the myocardium induce positive inotropic and chronotropic effects. The sympathetic innervations specific to the heart are generated from the stellate ganglion. Unlike the PNS, these sympathetic fibres are not limited to the S.A and A.V node but have connections to all areas of the heart (75). Beta2 receptors are located on blood vessels and veins found vastly on the heart and skeletal
muscle and induce vasodilation and bronchodilation. Furthermore, since epinephrine has a greater affinity towards beta receptors it generally induces vasodilation along with increased cardiac outputs at low secretions (76).
Blood Pressure Regulation
BP is the measure of blood flow force against the blood vessel wall. It is a product of cardiac output and total peripheral resistance, where cardiac output is defined as the total blood volume pumped by the heart ventricles each minute. Specifically, BP consists of two measures: systolic and diastolic, where the former is the peak arterial pressure during ventricular contraction and the latter is the lowest arterial pressure during ventricle relaxation. In normal healthy individuals the average systolic/diastolic pressures are 120mmHg/80mmHg. BP regulation is vital to ensure that blood is sufficiently being transported to tissues, and that BP measures do not escalate too high as this can cause vascular and cardiac tissue damage. BP regulation involves short and long term mechanisms. Only short term BP regulation will be described, namely the baroreceptor and chemoreceptor functions (77).
Baroreceptors are stretch receptors that function mechanically in response to changes in BP. Those located in the carotid sinus and the aortic arch contribute the greatest information. Afferent signals received from these sensors are sent to the nucleus tractus solitarius through the vagal nerve, altering sympathetic output. Baroreceptor function is achieved as follows: an increase in arterial pressure is detected mechanically by the stretch receptors in the arteries which initiate an increase in PNS response and a decrease in SNS
firing. This elicits bradycardia and blood vessel vasodilation. In contrast, a reduction of pressure on the baroreceptors stimulates SNS activity and reduces PNS function stimulating vasoconstriction, tachycardia, and increases in cardiac contractility (72).
Chemoreceptors are also involved in blood pressure regulation during hypoxia and hypercapnia, which may occur, for instance, in sleep apnea. Chemoreceptors can be found centrally in the medulla, and peripherally in the carotid and aortic bodies. Both regions monitor carbon dioxide however the peripheral receptors also respond to hypoxia. Autonomic changes elicited by central chemoreceptor activation include sympathetic excitation leading to vasoconstriction and increased arterial BP (76). Stimulation of peripheral chemoreceptor by profound hypoxia may induce simultaneous parasympathetic cardiac activation leading to significant lowering of heart rate (78).
1.2.3 Cardiovascular Autonomic Regulation and Sleep
In general, BP and heart rate during sleep decrease by approximately 10% compared to wake (79). Particularly for BP, these decreases are referred to as ‘dipping’ and result from an active decrease in the baroreflex set point (80). It has been shown that PNS and heart rate are regulated by the circadian rhythms, and PNS activity increases in anticipation of sleep onset. SNS activity and its corresponding influences on BP regulation, rather, are sleep/wake driven such that in 24h sleep deprived subjects who remain in the supine position show a decrease in HR but not BP (81;82). In addition, cardiac changes have been shown to precede EEG changes during sleep, possibly in anticipation of sleep stage transitions (83).
NREM and REM
Autonomic control differs significantly between NREM and REM sleep. NREM sleep is characterized by autonomic stability where BP, heart rate, and cardiac output are all decreased (84). The state is dominated by vagal nerve activity which is progressive from stages 1 to 4. Sympathetic activity is decreased in NREM sleep by approximately 50% from wakefulness causing BP to reach nadir values in stage 4 of this state (85;86). In addition, baroreflex sensitivity is increased in response to BP increments (87). These mechanisms serve to maintain normal arterial BP during NREM sleep.
In contrast, REM sleep is a state of unstable autonomic activity dominated by fluctuations between parasympathetic and sympathetic activity. These fluctuations contribute to irregular heart rate, BP, and breathing activity (88-90). Specifically, phasic REM is associated with increased heart rate and BP surges due to increased cardiac sympathetic activity, that are attenuated suddenly due to baroreceptor reflex activity (89;91-93). Tonic REM, on the other hand, is associated with abrupt decelerations in heart rate that are independent of respiratory and baroreflex influences. Data suggest that this might be due to increased vagal activity (94).
1.3 SLEEP BRUXISM
1.3.1 Definition:
Sleep bruxism is classified as a parasomnia, a movement disorder during sleep characterized by tooth grinding and/or clenching, and rhythmic masticatory muscle activity
(RMMA) (95). RMMA is the measure used to diagnose SB, however for the purpose of this thesis the terms SB and RMMA will be used interchangeably to describe teeth grinding episodes. SB should be distinguished from daytime clenching since the proposed causes are suspected to differ. SB may present itself idiopathically or can occur secondary to an existing condition (iatrogenic bruxism) which can result from either a different movement disorder (ie. PLMS, Parkinson’s disease etc.), or from drug intake/withdrawal (ie. neuroleptics inducing teeth grinding) (96).
SB episodes may manifest as either single or cluster episodes. A single SB episode is defined as an event that is isolated from additional SB events occurring within 60 seconds of the given SB episode. Cluster SB episodes rather, consist of multiple SB events that occur within 20 – 30 seconds of each other (97). An SB burst is defined as a masticatory muscle movement where the EMG amplitude reaches at least 10% of maximum voluntary contraction of awake subjects. SB episodes are scored as phasic, tonic, and mixed. A phasic episode consists of three SB bursts or more where each burst lasts 0.25 to 2.0 seconds. The majority of SB episodes occur in this phasic form which represent the RMMA that is characteristic of SB. A tonic episode is an SB burst lasting more than 2.0 seconds. A mixed episode consists of both of these types of episodes that occur within an interval of 3.0 seconds (98). SB episodes can occur with or without tooth grinding noise. Its diagnosis is based on at least four SB episodes per hour (if episodes are occurring without noise), or a minimum of 25 SB bursts per hour of sleep, or at least one SB episode that occurs with noise per sleep period (98). SB diagnosis is represented by an
RMMA index indicating the number of SB episodes per hour of sleep (99). SB may be classified as mild to moderate (2 ≤ RMMA index ≤ 4), or severe (RMMA index > 4).
1.3.2 Epidemiology
SB, or more precisely, the awareness of tooth grinding as reported by a sleep partner, is present in 8% of the adult population. It is more common in children and young adults (13%) and is shown to decrease with age (3% in the elderly) (100). Of relevance, these SB prevalence figures are most often generated from self report data that are usually based on daytime clenching (present in 20% of the population) (101). Clenching, however, does not always correspond to an SB diagnosis. Further, many individuals who have SB are not aware of their condition because they either sleep alone or have a ‘deep sleep’ sleep partner (96)
1.3.3 Risk Factors and Consequences
Various risk factors have been suggested to contribute to the etiology of SB. Psychological factors such as stress and anxiety with Type – A personality have been linked to its causes (102) albeit controversially (103;104). SB has been reported to co-occur often in patients with sleep apnea, and is present in 10% of patients with RLS (105). As well, smoking, alcohol, and caffeine have all been shown to exacerbate this condition (106;107). Consequences of SB include tooth wear, temporomandibular joint and muscle pain, as well as headaches (in both adults and children) (108). Interestingly, orofacial pain
is experienced significantly more in individuals who have mild to moderate rather than severe SB (109).
1.3.4 Physiological Characteristics and Mechanisms
In general young and healthy sleep bruxers are good sleepers with normal overall sleep macrostructure, including normal sleep stage distribution and arousal indices when compared to controls. The majority of SB events occur during NREM sleep (110-112), most often right before transitions into REM (112). Although the etiology of SB remains unknown the physiological mechanisms preceding or associated with SB/RMMA activity are well documented in the literature. It has been shown that subjects with SB have an overall elevated sympathetic tone during wake (113). SB episodes are associated with both body movement and cortical arousal (111;112;114;115;115). More specifically, the vast proportion of SB episodes (87.3%) have been shown to occur in phase A of the cyclic alternating pattern (CAP) (111). CAP is an index of sleep instability consisting of phase A and phase B where phase A is associated with heightened EEG, muscle, and autonomic activity (116-118).
In conjunction with SB’s temporal association with cortical arousal the physiological mechanisms preceding SB are also arousal related. Arousals are normally characterized by tachycardia followed by bradycardia and can occur with or without EEG desynchronization (cortical or subcortical arousal) (119). These events are similar to the physiological sequences involved in SB which consist of the following activities: an increase in sympathetic activity before SB onset (-4 to -8 minutes) (112), followed by an
increase in EEG activity (cortical arousal) (-4 seconds); tachycardia occurs 1 second before SB (111;115), followed by an increase in respiratory amplitude concomitant with SB onset (120). These sequences of events can be viewed in Figure 1.
Figure 1. Physiological Events Preceding SB
Figure 1. Sequence of events preceding SB: increases in sympathetic activity (-4 to -8 minutes); increase in EEG activity (cortical arousal) (-4 seconds); tachycardia occurs (-1 second); an increase in respiratory amplitude (simultaneous to SB onset.)
The dotted vertical line indicates SB onset.
1.3.5 Diagnosis
Bruxism diagnosis is clinically based on a patient’s history and orofacial examination that involves the analysis of tooth wear, masseter muscle hypertrophy, as well as the presence of jaw discomfort, pain, and temporomandibular joint disorder.
SB is more accurately diagnosed when using PSG as a diagnostic tool since it allows SB to be distinguished from other orofacial movements (121). PSG for SB diagnosis requires the following electrodes: 2 EEG (C3 -A2, O2 - A1), right and left EOG, EMG of the masseter and temporalis, for SB scoring; chin and suprahyoid, to observe hypotonia during REM sleep; and anterior tibialis, to rule out PLMS. Nasal air flow, respiratory effort measures using abdominal and chest belts, and the use of a microphone to monitor sleep apnea, snoring, and tooth grinding are also mandatory requirements for PSG SB diagnosis. In addition, video recordings are included to allow for differentiation between orofacial movements and actual SB/RMMA. Biocalibrations are performed where actions such as swallowing, teeth tapping, and clenching are executed voluntarily to test EMG recordings and assist with SB scoring for each patient. All PSG data should be recorded with a computer at a minimum acquisition speed of 128Hz, with computer screen epochs set at 20-30 seconds (96;98). For each event the SB scorer should specify if the SB occurred with tooth grinding sounds, or silently.
1.3.6 Management
Since no cure exists for SB, only treatment options are available to assist with its management. Specifically, the main goal of the clinician is to manage tooth wear and jaw joint pain. Such treatments include behavioural treatment, occlusal appliances, and pharmacological management. Behavioural treatments normally focus on changes in sleep hygiene as well as stress and relaxation management. The effects on SB have not been significant but many report improved well being (122;123). Occlusal appliances include devices such as mouth guards or stabilization bite splints, where the latter have been proven to be particularly effective at preventing tooth wear (124). Special attention should be made when prescribing these appliances, however, since they have the potential to exacerbate sleep disordered breathing (SDB) if patients present both SB and SDB (125). Furthermore, compliance is always a concern. A device called the mandibular advancement device is also available which functions by moving the jaw forward. It has been shown to treat sleep apnea and SB (126-128). Lastly, pharmacological options such as benzodiazepines and muscle relaxers can also be used for short term management of SB (129-131). Selective alpha2 adrenergic agonists (clonidine) have been shown to reduce SB, although this treatment is not recommended in clinic due to the side effect of severe morning hypotension (132). The antidepressant medication selective serotonin reuptake inhibitors (SSRI’s) have been shown to actually induce clenching and tooth grinding (133). .
1.4 AROUSALS, PLMS, AND BP DURING SLEEP
1.4.1 Arousals: Cardiovascular Response from Sleep
Arousal from sleep is associated with transient increases in both BP and heart rate, as a reflection of increased sympathetic activity, and are often followed by bradycardia most likely due to the baroreflex system (134). There is evidence that the rise in heart rate is associated with increases in both slow (delta) and fast (theta) EEG activity (135). These heart rate changes have been shown to occur in both cortical and sub cortical arousals. In addition, there is evidence for a sleep stage effect on the magnitude of the BP surge since arousal related surges during REM sleep have been shown to be smaller than those occurring in NREM sleep (134).
1.4.2 PLMS and BP during Sleep
PLMS is a sleep movement parasomnia, like SB, and both disorders share similar physiological patterns. PLMS, for example, are associated with arousal and display a tachycardiac/bradycardiac pattern (136). Further, the majority of PLMS events have been shown to occur during Phase A of the CAP sequence (137). It has been demonstrated that PLMS, whether or not associated with EEG arousal, are associated with increases in BP (1;134). The physiological similarities between SB and PLMS raise the question as to whether SB events are also associated with BP surges.
1.5 OBJECTIVES
The aim of this study is to determine if a significant increase in BP is associated with SB. This objective is based on the current knowledge of SB, particularly that it is preceded by sympathetic activities including tachycardia, increased respiratory amplitude, and cortical arousal. Since SB is associated with cortical arousals and body movements the study will also examine whether these events influence the suspected SB related BP surge. This study will focus on pure, single SB episodes occurring in stage 2 sleep only, where the majority of SB episodes take place.
1.6 HYPOTHESIS
The hypotheses are the following:
1. SB is associated with BP changes that involve an increase in both systolic and diastolic blood pressure (SBP and DBP).
2. BP changes will vary depending on whether SB events occur alone, or are associated with arousals and/or body movements. Specifically, we will be
examining SB episodes in four categories: 1) SB + cortical arousal; 2) SB + body movement; 3) SB + cortical arousal + body movement 4) SB alone.
CHAPTER 2:
Sleep Bruxism is Associated with a Rise in Blood Pressure
Nashed, A., Lanfranchi, P.A., Carra, M., Rompré, P., Mayer, P., Huynh, N., Lavigne, G. (to be submitted to a sleep related journal)
2.1 ABSTRACT
Objectives: Sleep Bruxism (SB) is a movement disorder identified by tooth grinding and rhythmic masticatory muscle activity (RMMA). It is often associated with body movements and sleep arousals. Increases in autonomic sympathetic activities that characterize sleep arousal precede SB. These events include an augmentation of the following variables: sympathetic cardiac activity (-4 minutes), electroencephalography frequencies (-4 seconds), heart rate and respiratory amplitude (-1 second), and suprahyoid muscle activity (-0.8 second). This study examined whether these sympathetic activities are associated with significant changes in arterial blood pressure (BP).
Methods: Ten subjects with SB (5 male; 5 female; mean age = 26 ± 1.8) underwent 3 nights of full polysomnography that included non-invasive beat to beat BP recording. The first night served as a screening and habituation night. Analysis was performed on second and third night recordings. Overall analysis was based on single SB episodes occurring in stage 2 sleep only, for a total of 65 episodes. Systolic and diastolic BP measurements were taken from a window of 20 beats before and 23 beats after onset of each SB episode. SB episodes were categorized as: 1) SB +cortical arousal; 2) SB + body movement (BM); 3) SB + cortical arousal + BM. A fourth category, SB alone, was also analysed but used as preliminary since the category consisted of only 4 episodes.
Results: Both systolic and diastolic BP increased with SB episodes. This increase was significant for both systolic and diastolic BP for SB events with cortical arousal and/or BM (p≤0.05). The average BP surges (systolic/diastolic ± SE) were: 28.4 ± 2.4/13.2 ± 1.5mm Hg for SB + cortical arousal; 30.7 ± 1.6/19.4 ± 2.3mm Hg for SB + BM; 26.4 ± 2.8/14.6 ± 2.0mm Hg for SB + cortical arousals + BM; 22.9 ± 5.2/12.4 ± 3.3mm Hg for SB alone. Conclusion: Sleep bruxism is associated with blood pressure fluctuations during sleep. This BP surge is greater in SB episodes associated with cortical arousal and/or BM which often co-occur with SB events. These results are congruent with our previous observations, where SB is preceded by a rise in sympathetic activity and tachycardia.
2.2 INTRODUCTION
Sleep Bruxism (SB) is a movement disorder identified by tooth grinding and rhythmic masticatory muscle activity (RMMA). Subjects with SB are generally good sleepers with normal overall sleep macrostructure including normal sleep stage distribution and arousal indices when compared to controls. The majority of SB events occur during NREM sleep (110-112), most often right before transitions into REM (112). Although the etiology of SB remains unknown the physiological mechanisms preceding or associated with SB activity are well documented in the literature. It has been shown that subjects with SB have an overall elevated sympathetic tone during wake (113). SB episodes are associated with both body movement and sleep arousal (111;112;114;115). More specifically, the vast proportion of SB have been shown to occur in phase A of the cyclic alternating pattern (CAP) (87.3%) (111). CAP is an EEG arousal pattern consisting of phase A and phase B, where phase A is associated with the strongest arousal pressure linked with heightened EEG, muscle, and autonomic activity (116-118).
In conjunction with SB’s temporal association with cortical arousal the physiological mechanisms preceding SB are also arousal related. Specifically, arousals are normally characterized by tachycardia, often followed by bradycardia (119), and can occur with or without EEG desynchronization (cortical or subcortical arousal). These events are similar to the physiological sequences involved in SB which consist of the following activities: an increase in sympathetic activity before SB onset (-4 to -8 minutes) (112), followed by an increase in EEG activity (cortical arousal) (-4 seconds); tachycardia occurs
1 second before SB (111;115), followed by an increase in respiratory amplitude concomitant with SB onset (120).
These physiological sequences observed in SB have also been described in other sleep movement disorders. Periodic leg movements during sleep (PLMS), for example, are also associated with arousal and display a tachycardiac/bradycardiac pattern (136). Both PLMS and cortical arousal are associated with increases in blood pressure (BP) where PLMS was shown to exhibit a higher BP surge when co-occurring with arousal (1;134).
The aim of this study was to determine if SB also exhibits a significant increase in BP in subjects with SB, and to identify if this fluctuation varies in the presence of cortical arousals and/or body movements. Given the current knowledge on the physiological sequences associated with SB genesis, particularly the preceding arousals and increases in sympathetic activities, we hypothesize that SB is associated with BP changes; more precisely with increases in both systolic and diastolic blood pressures (SBP and DBP). We also predict that these changes will vary depending on whether the SB events occur alone, or in association with arousals and/or body movements.
2.3 METHODS
2.3.1 Study Population
The study consisted of 10 subjects (5 male; 5 female; mean age ± standard error = 26 ± 1.8 years) who reported a history of SB. Inclusion criteria required that subjects be between 18 and 45 years of age and report a history of SB occurring at least three times per
week. Subjects were included if they had at least mild to moderate SB (RMMA index ≥ 2.0), as confirmed by polysomnography (PSG) (138). Subjects were excluded if they had medical or psychiatric co-morbidity, or additional sleep disorders such as sleep apnea, insomnia, or RLS, as well any severe dental occlusion problems. A summary of subject characteristics are reported in Table 1.
2.3.2 Subject Recruitment
Subject recruitment involved three stages. The first stage consisted of a screening via telephone questionnaire. If subjects reported frequent morning jaw discomfort and had dental reported tooth wear, or if a sleep partner had complained of their tooth grinding, the subjects were invited to the laboratory for a second stage of clinical assessment. This assessment involved: i) additional questionnaires which examined general health, SB, SB and pain, headaches, daytime sleepiness, and sleep quality; ii) a clinical examination for SB by our dentist including a physical assessment of the jaw, neck, and mouth; iii) a dental X-Ray to examine dental health and assess the temperormandibular joint (TMJ). If subjects met clinical screening criteria they were scheduled for a single sleep study at the sleep laboratory at l’Hôpital du Sacré Coeur de Montréal which was the final stage of the SB assessment. This sleep study was used to confirm diagnosis and rule out any additional sleep disorders. If accepted, subjects were asked to return for an additional two sleep studies.
The protocol was approved by the institutional ethics committee. All participants of the study read and signed a written consent form describing the study procedure in detail
with the information that they were free to withdraw at any time. A reimbursement of 75$ was given to each subject per sleep night.
2.3.3 Polysomnography
Sleep studies involved full night polysomnography(PSG)(at least 7 hours) consisting of standard methods that included the following recordings:
electroencephalogram (EEG) leads (C3 – A2 and O2 - A1), two bilateral electrooculograms (EOG), and electromyograms (EMG) on the chin, the tibialis muscle, the suprahyoid
muscle, and the bilateral masseters and temporalis muscles. Further, cardiovascular signals were provided by a 3-lead electrocardiogram (ECG) and non-invasive beat-to-beat blood pressure (TNO-BMI, Academic Medical Centre, Amsterdam, the Netherlands) as detailed below. Signals were recorded at a sampling rate of 256Hz using Harmonie Software; Stellate Systems; Montreal, QC, Canada. Respiratory assessments were made using a nasal cannula (Braebon Medical Corporation; Kanata, ON, Canada), thoracic and abdominal belts, plus a finger pulse oximeter (Datex-Ohmeda; Louisville, CO). Audio and video recordings were also included for all PSG. Subjects were free of any medications (excluding oral contraceptives), and were asked to avoid day time naps, caffeine, and alcohol on the day of PSG recordings.
All studies were scored by a sleep technician according to Rechtschaffen and Kales sleep stage scoring criteria (139). SB was scored according to standard research criteria (140;141). Specifically, a phasic SB episode was scored when an SB episode consisted of at least 3 SB bursts, as measured by masseter muscle EMG, lasting 0.25 to 2.0 seconds
each, with an interval of two interburst pauses. A tonic SB episode was scored when a SB burst lasted longer than 2.0 seconds. SB diagnosis is represented by an RMMA index indicating the number of SB episodes per hour. Both audio and video were used to correctly distinguish orofacial movements from actual SB/RMMA, as well as document any body movements that co-occurred with SB (141-143). Sleep disordered breathing events, cortical arousals, and PLMS were all scored according to American Academy of Sleep Medicine criteria (144).
2.3.4 Data Collection
Baseline wake arterial BP measures were taken using a brachial cuff in the evening before subjects were prepared for PSG set up. This BP measurement was obtained while subjects were in the seated position after five minutes of rest. All subjects had normal SBP and DBP measures which can be viewed on Table 1.
Nocturnal beat-to-beat measures of BP were obtained with the Portapres using finger cuffs. This method has been validated to accurately measure BP fluctuations when compared to an invasive intra – brachial BP recording device (145;146). This device was previously used in our laboratory to monitor beat to beat blood pressure recordings in subjects with insomnia and RLS (147;148).
2.3.5 SB Selection and SB Categories
Only single SB episodes were selected for examination in this study. A single SB episode was defined as an SB event that was absent of additional SB episodes in the 60
seconds preceding, and 30 seconds following a given event. These criteria were used to avoid confounding the BP baseline with cluster SB episodes. In addition, since our lab has found that the majority of SB episodes occur in stage 2 sleep, only events in this stage were analysed to avoid sleep stage effect on BP (97).
All SB events were categorized based on their associated events: i) SB + arousal; ii) SB + body movement; iii) SB + arousal + body movement; iv) SB alone, where arousals refer specifically to cortical arousals. SB episodes with arousal and/or body movement were selected only if the arousals and/or body movements began within the 5 seconds preceding SB to ensure that BP changes were SB related. Stable BP before each SB episode was ensured for all episodes selected for analysis. Furthermore, SB events that coincided with any additional physiological events, such as sleep apneas/hypopneas events, upper airway resistance events, or technical limitations (i.e. signal artefact) that could have confounded the BP changes were omitted from analysis.
2.3.6 Data Analysis
BP measurements were taken across a temporal window of 43 seconds: 20 beats before, 6 beats during, and 15 beats after SB onset of single SB episodes. Six beats during was chosen for this model since the average length of an SB episode was six seconds. This value ensured maximum SB episode inclusion without omitting BP peak values in any SB episodes. Baseline BP was established by averaging the first 7 beats (-20) to (-14) as replicated by Pennestri et. al., 2007 (1), to avoid contaminating the baseline calculations
with the heart rate changes known to precede SB. SBP and DBP changes were calculated for each SB category for each subject, as depicted in Figure 1.1.
2.3.7 Statistical Analysis
SB related SBP and DBP changes were analysed using repeated measure analysis of variance (ANOVA) followed by planned comparisons, where all SBP and DBP values (beats -20 to +23) were compared to baseline (beats -20 to -14). This analysis identified if and when a significant BP difference was present in SB. A multilevel analysis was used to assess if a group difference existed between the four SB categories. The advantage of using a multilevel statistical approach was that all subjects could be included in the analysis even if they did not present all four SB categories because this modeling allows for the
accommodation of multiple missing data points (149). Paired t-tests were also carried out to compare the SBP and DBP increments, in pairs, between the four SB categories. However, since few subjects had SB episodes in all four SB categories (refer to Table 3), the number of subjects qualifying for each paired t test was limited (between 3 – 5 subjects per test). Therefore, the paired t tests were used mainly to compare and reinforce results obtained from the multilevel analysis. A cut off p value of 0.05 was considered statistically significant.
2.4 RESULTS
All ten subjects were normal sleepers presenting an average sleep efficiency of 93%. The average RMMA index was 5.3 RMMA/hr (range 1.34 – 13.45). A detailed
summary of PSG data including RMMA, respiratory, and arousal indices are provided on Table 2. The SB categories were evenly distributed (19-23 episodes each) except for the SB alone category which consisted of 4 episodes. Two subjects displayed all four
categories of SB. The breakdown between subject and SB category distribution is listed on Table 3.
2.4.1 BP Changes with SB Episodes
There was an increase in BP for all SB categories and this rise was significant for SB + arousal, SB +body movement and SB + arousal + body movement. The average increases of SBP and DBP for each SB category are displayed in Table 4, as well as the overall group effect. The onset of the significant BP surge occurred before SB onset for SB + arousal, and post SB onset for categories: SB + body movement and SB + arousal + body movement; the exact times with respect to SB onset are listed on Table 5 and can also be viewed graphically on Figures 1.3 and 1.4. All BP peaks occurred after SB onset for all four SB categories. All DBP measures returned to baseline within the 43 beat temporal window. SBP never returned to baseline and actually remained significantly above baseline after reaching peak measures for the duration of the analyzed temporal window.
In addition, subsample analysis showed no relation between the SB burst EMG amplitude, as measured by Root Mean Square (RMS), and the amplitude of BP surge (p = 0.4).
2.4.2 Differences in BP Increments between SB Categories
Due to the small number of SB alone episodes the BP surge comparison between the SB categories is focused on the SB categories with associated events: SB + arousal; SB + body movement; SB + arousal + body movement first. The SB alone category is
incorporated as a separate analysis to provide preliminary comparisons.
Multilevel analysis showed that there was no significant difference for both SBP (p=0.42) and DBP (0.17) between the 3 SB categories with events: SB + arousal, SB + body movement, and SB + arousal + body movement (Table 4). There was however a trend showing a difference between SB + arousal and SB + body movement for DBP (p=0.07) (Table 6). Paired t tests comparison also showed no significant differences between these 3 SB categories with the exception of the SBP between SB + arousal and SB + body
movement (p=0.05) (Table 6).
When incorporating the SB alone category into the multilevel analysis an all around significant difference between the four SB categories is revealed for both SBP (p=0.01) and DBP (p=0.02) measures (Table 4). More specifically, the BP values for the SB alone episodes were significantly lower from the SB + arousal (SBP p=0.00; DBP trend: p=0.07), SB + body movement (SBP p=0.00; DBP p=0.00), and SB + arousal + body movement (SBP p=0.00; DBP p=0.02). Further, SB + arousal had a significantly lower DBP (p=0.05) than SB + body movement. Comparable findings were made when using paired t tests except that the SB alone and SB + arousal categories showed no significant difference in either SBP (p=0.18) or DBP (p=0.51).
2.5 DISCUSSION
The analysis supported the first hypothesis that SB is associated with a significant increase in both systolic and diastolic BP. Further, data showed that this increase was significant for SB associated with cortical arousals, body movements, and cortical arousal with body movement. An increase in BP was seemingly associated with SB alone but because of the low number of events (n=4) these data are not conclusive. Analyses on this variable are currently on going. These results are congruent with the autonomic changes currently known to precede SB, notably the augmentation in sympathetic activity followed by increases in EEG activity and heart rate, as well as respiratory changes. Interestingly, the DBP returned to baseline within 23 beats post SB onset (Fig. 4), whereas, on the contrary, the SBP never returned to baseline following its peak within the same temporal window (Fig. 5). This was consistent in all SB categories. Why DBP and SBP did not follow the same physiological pattern in association with SB events is not clear. Previous work in our laboratory has shown that sympathetic activity, assessed using spectral analysis of mean cardiac RR intervals, remains above baseline for 28 minutes following an SB event (112). Further, SBP have been reported to remain significantly above baseline for 40 seconds following a cortical arousal (150). Therefore, it is possible that sympathetic activation associated with sleep arousal and SB might variably affect cardiac and vascular responses, with a rapid normalization of peripheral vascular resistance as reflected by a rapid normalization of DBP, and a more sustained effect on cardiac contractility leading to
a delayed SBP normalization. However, at present these hypotheses remain speculations that need further investigations.
The onset of the significant BP surge varied depending on whether SB events were associated with arousals or body movements (Table 5). However, this may have been an effect of where the arousals or body movements began in relation to the SB onset.
The exact cause of the SB related BP surge is not yet clear. When considering both the results of this study and current literature it is difficult to conclude if the BP surge is a result of: a) SB/RMMA; b) the associated arousal; c) a combination of both events; d) an undetermined factor. This is partly because it is still uncertain whether a significant BP surge is actually associated with a SB alone event, due to the small sample of SB episodes in that category. Even if this does prove true, however, there is evidence that a hierarchical response exists in arousals, where an autonomic response is present even when EEG activity is not visible, and this response is associated with increase in BP (135;151). Therefore, in the absence of cortical activity, a subcortical arousal could still be present during SB episodes, contributing to the BP surge.
To gain insight into the potential cause of this BP surge a subsample analysis was performed to examine the relationship between the EMG amplitude of the SB burst and the magnitude of the BP rise. No correlation was found between these two variables which suggest that the BP rise may be attributed to a variable other than SB burst activity.
Clinically, the main concern raised from this study is whether the BP increments, or the potentially sustained SBP related to SB, pose an independent or cumulative risk for cardiovascular disease in either healthy and/or vulnerable populations. Such a risk could present itself in certain populations if the SB related BP surge is found to significantly contribute to BP variability during sleep, since there is evidence that shows that BP variability is an independent predictor for cardiovascular disease in elderly individuals as well as those with type 2 diabetes (152). Alternatively, SB’s association with cortical arousal could also raise cardiovascular health concerns since arousals that co-occur with sleep disordered breathing (SDB) have been shown to have adverse affects on the cardiovascular system (153-155). However, arousals associated with SB differ from those in SDB in that they have not been shown to be detrimentally repetitive, or affect sleep macrostructure, or disrupt sleep quality. Nevertheless, further investigation is clearly required to determine the effects of SB on long term cardiac health in these subjects.
With respect to our second hypothesis there is evidence that the BP rise associated with SB is significantly different depending on whether SB episodes are associated with arousals and/or body movements. Although multilevel analysis showed no overall significant difference between BP surges in the three SB categories: SB + arousal; SB + body movement; SB + arousal + body movement, both multilevel analyses and paired t tests did show that SB + movement were associated with a significantly higher BP surge than SB + arousal for at least one BP measure (either SBP or DBP) (Table 6). With inclusion of SB alone episodes, multilevel analysis showed that SB alone episodes generated significantly
lower BP surges compared to SB that occurred with either arousals and/or body movements.
Interestingly, SB episodes that were associated with both arousals and body movements generated a lower BP surge than SB episodes associated with only arousal or body movement; although these differences were not significant. Ongoing data collection and future analysis could shed more light on this observation.
Thus, based on the consensus of both multi level and paired t tests analyses there is evidence that SB related BP surges do significantly vary depending on the events associated with SB. These results suggest that SB + body movement may be associated with higher BP surges compared to SB + arousal and SB alone. Owing to the small sample size, more data is required to confirm this observation as well as determine if a significant BP difference exists between SB alone and SB + arousal since paired t tests showed no difference between these categories for either SBP or DBP.
The main limitation of this study was the sample size of single SB episodes, especially within the SB categories. Further, no controls were used in this research so it is not known whether a similar BP surge occurs in control subjects exhibiting RMMA. Results obtained from this study are limited to single SB episodes occurring in stage 2 sleep only, that are experienced by young, healthy patients. Caution should be made if extrapolated to SB events occurring in other sleep stages, particularly REM, as well as to SB clusters or vulnerable populations without further research.
In continuation of this research a BP analysis involving a larger sample size of single SB episodes, SB clusters, and the incorporation of SB related breathing changes are currently ongoing. In addition, future research should aim to conduct more control studies on the sympathetic and cardiovascular responses between subjects with SB and controls, to verify if the BP surges associated with SB/RMMA differ between these two groups. This information could offer insight as to whether SB contributes to increased risk of hypertension or cardiovascular disease. Long term studies are also necessary to assess if the BP changes associated with SB significantly impact the cardiovascular system over time, especially in vulnerable populations, such as patients with RLS, diabetes, and the elderly.
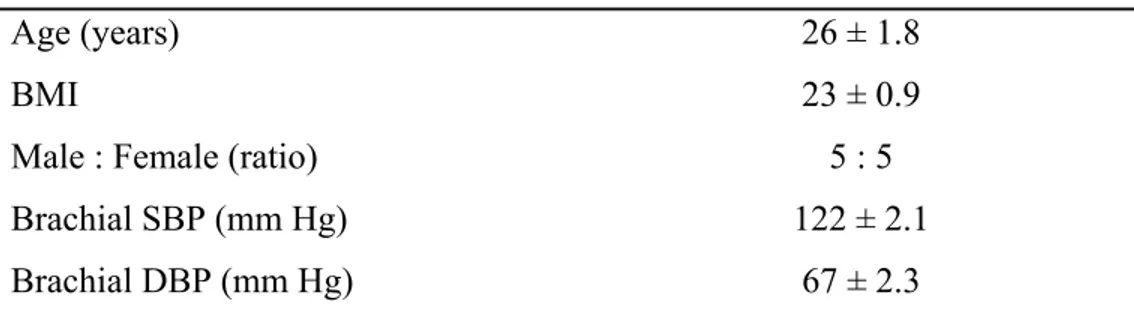
Table 1: Subject Demographics and Baseline BP during Wake
Age (years) 26 ± 1.8
BMI 23 ± 0.9
Male : Female (ratio) 5 : 5
Brachial SBP (mm Hg) 122 ± 2.1
Brachial DBP (mm Hg) 67 ± 2.3
Table 2: PSG Summary with RMMA, PLSM, Cortical Arousal, and Respiratory Indices Sleep Latency (minutes) 8.7 ± 1.3 (2.7 – 25)
Total Sleep Time (minutes) 413.2 ± 13.9 (220.3 – 522.3) Sleep Efficiency (%) 92.9 ± 1.3 (79.1 – 99.4) Stage 1 (%) 6.9 ± 1.2 (2.0 – 24.0) Stage 2 (%) 52.2 ± 1.7 (2.0 – 72.5) Stage 3/4 (%) 22.1 ± 1.3 (12.4 – 38.0) Stage REM (%) 18.9 ± 0.7 (9.2 – 30.8) RMMA Index 5.3 ± 0.7 (1.3 – 13.5)
Average RMMA Duration (seconds) 5.8 ± 0.3 (3.7 – 8.6)
Arousal index 15.2 ± 1.4 (4.1 – 25.6)
Average Arousal Duration (seconds) 6.6 ± 0.2 (6.4 – 7.8) Apnea - Hypopnea Index 0.4 ± 0.1 (0.0 – 2.5)
*PLMS Index 1.1 ± 0.6 (0.0 – 8.8)
**PLMS Index for subjects X and Y 18.3 ± 6.5 (5.4 – 30.9) PSG values are in mean ± SE (range);
*Excluding 2 subjects (X and Y) who had PLMS (PLMS index > 5) **PLMS index of subjects X and Y who had PLMS only
Table 3: Distribution of Single SB Episodes Selected for each Subject
SB Category
Patient# SB + Arousal SB + Body
Movement SB + Arousal + Body Movement SB Alone Total 1 0 2 2 1 5 2 5 5 2 1 13 3 3 2 2 0 7 4 6 0 0 1 7 5 1 0 3 0 4 6 0 3 4 0 7 7 0 0 2 0 2 8 0 8 0 0 8 9 3 3 2 1 9 10 1 0 2 0 3 Total 19 23 19 4 65
Table 4: Mean SDP and DBP Increase from Baseline for each SB Category, and Overall Group Effect SB + Arousal SB + Body Movement SB + Arousal + Body Movement SB Alone Group Effect without SB alone Group Effect with SB alone Mean SBP ↑ (mm Hg) 28.4 ± 2.4 30.7 ±1.6 26.4 ±2.8 22.9 ± 5.2 P = 0.42 NS P = 0.01 Mean DBP ↑ (mm Hg) 13.2 ± 1.5 19.3 ± 2.3 14.6 ± 2.0 12.4 ± 3.3 P = 0.17 NS P = 0.02
BP values are shown as mean ± SE NS = None Significant