Science Arts & Métiers (SAM)
is an open access repository that collects the work of Arts et Métiers Institute of Technology researchers and makes it freely available over the web where possible.
This is an author-deposited version published in: https://sam.ensam.eu Handle ID: .http://hdl.handle.net/10985/10272
To cite this version :
SeverGabriel RACZ, Salim KHAN, Hocine CHALAL, Farid ABEDMERAIM, Tudor BALAN -Prediction of Springback After DrawBending Test Using Different Material Models - In:
International Conference on Advances in Materials and Processing Technologies (AMPT 2010), France, 2010-10-24 - AIP Conference Proceedings - 2011
Any correspondence concerning this service should be sent to the repository Administrator : [email protected]
Prediction of Springback After Draw-Bending
Test Using Different Material Models
Sever-Gabriel Racz
a,b, Salim Khan
a, Hocine Chalal
a,
Farid Abed-Meraim
aand Tudor Balan
aa Laboratoire de Physique et Mécanique des Matériaux, LPMM, CNRS,
Arts et Métiers ParisTech – Metz, 4 rue A. Fresnel, 57078 Metz Cedex 03, France
b“Lucian Blaga” University of Sibiu, 10 Bd. Victoriei, 550024, Sibiu, Romania
Abstract. Within the framework of sheet metal forming, the importance of hardening models for
springback predictions has been often emphasized. While some specific applications require very accurate models, in many common situations simpler (isotropic hardening) models may be sufficient. In these conditions, investigation of the impact of hardening models requires well defined test configurations and accurate measurements to generate the reference data. Specific bend tests have been especially conceived for this purpose. In this work, such a draw-bending experimental device has been designed, for use on a biaxial tension machine. Three different steel sheets have been tested (one mild steel sheet and two HSS sheets) with thicknesses between 0.8 and 2 mm. Up to three different back-force levels were used for the tests. Wall curvatures and springback angles were measured. Finite element simulations of the tests were performed. A parameter sensitivity analysis has been carried out in order to determine the numerical parameters ensuring accurate springback results. The tests were simulated using an isotropic hardening model and a combined isotropic-kinematic hardening model. The impact of the hardening model is explored for the various test configurations and conclusions are drawn concerning their relative importance.
Keywords: sheet metal forming, springback prediction, hardening, draw-bending
INTRODUCTION
Numerical simulation has become a common industrial practice in the field of sheet metal forming, especially for automotive applications like the manufacturing of the body-in-white. Besides the global predictions of required press load, the accurate prediction of forming defects like formability, thinning and/or springback are crucial for the success of the forming operations. In this framework, the impact of hardening models on springback predictions has been often emphasized. It is recognized that some specific applications require very accurate models, while in many common situations simpler (isotropic hardening) models are sufficient (see e.g. [1,2]). In these conditions, investigation of the impact of hardening models requires well defined test configurations and accurate measurements. Specific draw-bending tests have been especially conceived for this purpose ([3-5]). In this work, such a draw-bending experimental device was designed, for use on a biaxial tension machine. Three
different steel sheets have been tested. A 0.8 mm thick mild steel sheet (material A) is used as reference, since this material has been used for decades for automotive applications. Also, two 2 mm thick AHSS sheets (materials B and C hereafter) are considered. In order to mimic various situations encountered in real-life forming applications, three different back-force levels were used for the tests. The back-force defines the tension loading induced in the sample prior to draw-bending. The back-force values are selected in order to induce a tensile pre-stress equal to a fraction k of the initial yield stress of the material. The three values of the parameter k used in this work are 0.5, 0.8 and 1.1. In the later case, the sample is plastified before forming, while the first case corresponds to a weak tension and a bending-dominated straining mode. Each of the three materials is described with two different hardening models. The impact of the material model – especially kinematic hardening – on springback predictions is the main focus of the current analysis.
In the first section of the paper, the experimental setup designed and realized for this investigation is presented. The second section is dedicated to the numerical simulation of the experiments – both material modeling and finite element modeling are presented. Attention is drawn on the sensitivity of the results to numerical parameters. Finally, the results are compared and discussed in the third section. For the experiments vs. simulations comparison, two wall curvatures and a springback angle were measured.
EXPERIMENTAL SETUP
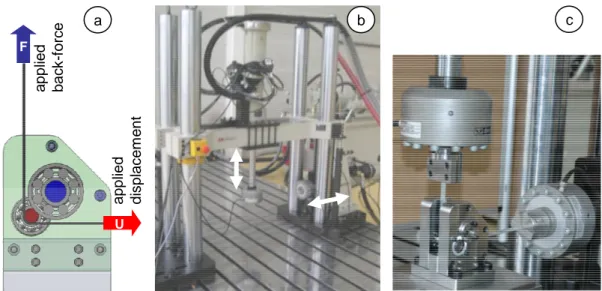
Among various springback tests, a particular case of draw-bending (or bending-under-tension) tests have reached particular attention in the last two decades [3-5]. Initially designed for friction analysis, this type of test has the advantage to separate at best the impact of material and friction on springback. A schematic view of the test is given in Figure 1a: the specimen is a sheet metal strip pre-bent at 90°, subject to a controlled tensile stress. The strip travels under controlled displacement over the radius of a tool, while the constant tensile load is maintained. When the desired stroke is reached, the strip is unloaded and springback occurs.
In the current work, the aim was to realize such a draw-bending test where friction is reduced at a minimum. Accordingly, a three-bearing configuration has been used to sustain the cylindrical tool, so that it may rotate freely during the test, while keeping its elastic deformation negligible. A biaxial tension-compression testing machine has been used, with two 50kN hydraulic actuators oriented at 90° with respect to each other (Figure 1b). A specific testing device has been designed in order to adapt the bending-under-tension test to the geometrical constraints of this particular machine, while being able to carry the relatively high loads induced during the tests. Indeed, the experimental devices were designed to test advanced high strength steels up to 4 mm thick, as these materials are receiving growing attention. In order to comply with the limited load capacity of the machine, the width of the test strips is reduced to 12 mm. On the other side, this choice considerably increases the stiffness of the device – and in particular the stiffness of the tool, allowing for tool radii as small as 3 mm, which correspond to challenging sheet forming sequences. Indeed, the thickness versus tool radius has been identified as a factor with a key impact on springback [2,4].
U F a b c a p p lie d b a c k -f o rc e a p p lie d d is p la c e m e n t
FIGURE 1. Bending-under-tension experimental device: (a) Schematic view – beginning of the test;
(b) Biaxial testing machine; (c) Experimental setup – end of the test.
Consequently, devices with tool radii of 3, 6 and 10 mm were realized (Figure 2). As shown in Figure 2a, the different devices may be changed with each other without modifying any other machine settings. Here, the 6 mm tool radius has been used.
Relative position of tools with different radii a b c
FIGURE 2. Bending-under-tension devices with different tool radii: (a) Relative alignment scheme;
(b) CAD models; (c) The manufactured test modules and grips.
NUMERICAL SIMULATIONS
For the finite element simulation of forming processes including springback, static implicit FE codes are recommended. Here, the bending-under-tension experiments were simulated using Abaqus/standard and the material models were implemented via a UMAT subroutine using the Backward Euler implicit integration scheme [2]. This section describes the constitutive models and the finite element simulations.
Constitutive modeling
Elasto-plastic, anisotropic material models are considered, defined by the following equations: - Yield function: 0
)
(
)
,
,
(
R
R
Y
F
σ
X
=
σ
σ
′
−
X
−
−
, (1)where
σσσσ
is the Cauchy stress tensor,σσσσ
′ is its deviator, X and R are internal variables describing the current position and size of the yield surface, respectively. The material plastifies when the yield function vanishes. Y0 defines the initial size of the yield surface. In this work, only Hill’s quadratic yield function is considered; nevertheless, the modeling formalism is general.- Flow rule: we consider associated plasticity:
σ V V D ∂ ∂ = = F p ;
λ
ɺ , (2)where Dp is the plastic strain rate, V is the gradient of the yield function and λɺ is the
plastic multiplier.
- Hardening, governed by the following generic equations:
;
R X
Rɺ =h
λ
ɺ Xɺ =hλ
ɺ, (3)with the initial conditions R(0) = 0 and X(0) = 0. Saturating equations are used for both isotropic and kinematic hardening components:
( ) R sat R h =C R −R and X CX Xsat '
σ
− = − σ X h X , (4)where CR, Rsat, CX and Xsat are material constants.
- Hypo-elastic law: ) ( : D Dp C σɺ = − , (5)
where C is the fourth order tensor of elastic
constants and D is the total strain rate.
Two variants of the model have been used, in order to emphasize the impact of the hardening model on springback predictions: one is the classical, combined isotropic-kinematic hardening described by the equations above, while the second model includes only the isotropic hardening component (X(t) = 0, ∀t). The parameters of the two models are
identified so that their predictions of monotonic loading are very similar, while they differ after a reverse strain-path change – as illustrated in Figure 3. The parameter identification procedure using reverse bending tests is presented in [6]. -1200 -900 -600 -300 0 300 600 900 1200 0 0.05 0.1 0.15
tensile log strain
te n s il e s tr e s s [ M P a ] isotropic combined FIGURE 3. Tension-compression
Finite element models
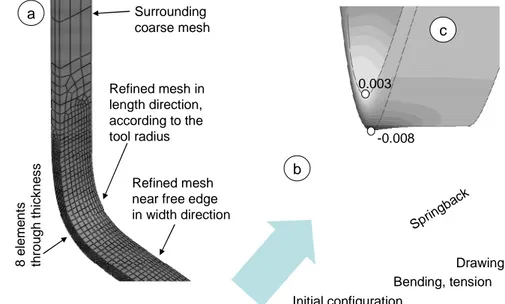
Solid elements are used to model the samples, while the tool is considered rigid. A refined mesh is chosen for the entire zone subject to bending. A convergence study has led to the mesh represented in Figure 4; the active zone is meshed with eight solid elements through the thickness and ten elements in the width direction (only half of the strip is meshed due to symmetry). The simulation is performed in four steps: bending, tensile pre-straining up to the required back-force, drawing and springback. Figure 4 illustrates the main steps of the simulation and the FE mesh. The length of the samples is 400 mm, for a 110 mm draw-bending stroke.
Initial configuration Bending, tension Drawing Sprin gbac k -0.008 0.003 8 e le m e n ts th ro u g h t h ic k n e s s Surrounding coarse mesh Refined mesh near free edge in width direction Refined mesh in length direction, according to the tool radius a b c
FIGURE 4. FE models of the experimental tests: (a) Mesh of the sample; (b) Main steps of the
simulation; (c) Detail of the bending-under-tension deformation and 3D effects: anticlastic curvature and strain distribution (in the width direction) at the free edge.
RESULTS AND DISCUSSION
Three measures are used to characterize springback after the tests: the corner radius
R’, the wall radius r’ and the springback angle ∆θ (Figure 5a). The coordinates of several points are taken on the profile of the experimental and numerical samples, from which the three springback characteristics are determined via a specific Matlab code. Figure 5 summarises the experimental and numerical results for five different experiments, involving the three materials and one, two or three back-forces per material.
Several conclusions can be drawn from the analysis of these plots:
• Radius R’ is not very sensitive to the material model and is the most subject to experimental measurement errors. The two models give similar predictions. However, larger springback is clearly and consistently observed for AHSS.
• The plots of r’ and ∆θ confirm that increasing the back-force reduces springback. This trend is better described by the combined hardening model.
• The three measures indicate larger springback for the AHSS sheets; this trend is predicted by both models yet combined hardening is again closer to experiments.
• Several experiments are satisfactorily predicted with isotropic hardening; using any subset of these would lead to very partial conclusions. When the entire set of experiments is used, the combined model consistently appears as more accurate. It is expected that additional experiments will allow for a finer discrimination between hardening models and yield functions (not studied here).
-5 0 5 10 15 20 25 30 35 0 .4 0 .6 0 .8 1 1 .2 0 200 400 600 800 1000 1200 1400 1600 1800 2000 0 .4 0 .6 0 .8 1 1 .2 6.00 6.20 6.40 6.60 6.80 7.00 7.20 7.40 0 .4 0 .6 0 .8 1 1 .2 a b c d e x p is o c o m b mat. A mat. B mat. C e x p is o c o m b mat. A mat. B mat. C r’ [mm] ∆θ[°] R’ [mm]
FIGURE 5. Springback indicators: (a) Definitions [4]; (b) R’; (c) r’; (d) ∆θ. Legend acronyms: exp =
experimental, iso = isotropic hardening, comb = combined isotropic-kinematic hardening.
ACKNOWLEDGMENTS
The authors are grateful to the Agence Nationale de la Recherche – ANR (France) for its financial support through the Mat&Pro joint project FORMEF. Xavier Lemoine from ArcelorMittal Maizière R&D Automotive Product has provided the materials while Michel Brunet and Francis Sabourin from LaMCoS (INSA Lyon) have provided the material parameters for all the models used in this work. The first author is grateful to the Région Lorraine for its financial support.
REFERENCES
1. P. Hora (editor), Proc. Numisheet 2008, Interlaken, September 1-5 (2008). 2. B. Haddag, T. Balan and F. Abed-Meraim, Int. J. Plasticity 23, 951–979 (2007).
3. T. Kuwabara, S. Takahashi and K. Ito, “Springback analysis of sheet metal subjected to bending– unbending under tension Part II (experimental verification)”, in Proc. 5th ICTP, edited by T. Altan, vol. II. Columbus, Ohio, 1996, pp. 747–750.
4. W.D. Carden, L.M. Geng, D.K. Matlock and R.H. Wagoner, Int. J. Mech. Sci. 44, 79-101 (2002). 5. M. Kleiner, M. Schikorra, R. Govindarajan and A. Brosius, “Springback analysis of sheet metals
regarding material hardening”, in Proc. 11th Int. Conf. on Sheet Metal, edited by M. Geiger, J. Duflou, H.J.J. Kals, B. Shirvani and U.P. Singh, 2005, pp. 712–728.
6. J. Carbonnière, S. Thuillier, F. Sabourin, M. Brunet and P.Y. Manach, Int. J. Mech. Sci. 51, 122– 130 (2009).
![FIGURE 5. Springback indicators: (a) Definitions [4]; (b) R’; (c) r’; (d) ∆θ. Legend acronyms: exp = experimental, iso = isotropic hardening, comb = combined isotropic-kinematic hardening](https://thumb-eu.123doks.com/thumbv2/123doknet/7287996.208088/7.892.142.760.193.613/springback-indicators-definitions-experimental-isotropic-hardening-isotropic-kinematic.webp)
