HAL Id: dumas-02747211
https://dumas.ccsd.cnrs.fr/dumas-02747211
Submitted on 3 Jun 2020HAL is a multi-disciplinary open access archive for the deposit and dissemination of sci-entific research documents, whether they are pub-lished or not. The documents may come from
L’archive ouverte pluridisciplinaire HAL, est destinée au dépôt et à la diffusion de documents scientifiques de niveau recherche, publiés ou non, émanant des établissements d’enseignement et de
The role of earthworms in the biological processes of the
phosphorus cycle
Juliette Steculorum
To cite this version:
Juliette Steculorum. The role of earthworms in the biological processes of the phosphorus cycle. Life Sciences [q-bio]. 2019. �dumas-02747211�
Mémoire de Fin d'Études
d’Ingénieur de l’Institut Supérieur des Sciences agronomiques, agroalimentaires, horticoles et du paysage
de Master de l’Institut Supérieur des Sciences agronomiques, agroalimentaires, horticoles et du paysage
d'un autre établissement (étudiant arrivé en M2)
!
!"#$%!&%'!(%)'!&%!*%))%!&+,'!$%!)%-.-$+/%!
012$2/134%!&4!562'562)%!2)/+,134%7!!
!!"#$%$&'()*++*$,-./012304$
$ $ $ $ $ ! ! ! ! ! $ !"#$%&#'('''''')%&&%*''''''''''''''''''+%''',-./0.-/,0'''''''''''''''''''''''''''! ' 1%23&$'+%'4#56'7"89"*:';%'<'' !#56)7*8+$%$$ 4"9+#*$7*$6+":*$% /;)"#"$!<,-2//=<$ .86*):8"8+$#5>5#*8+$%$?'*8@("$!.3.,$ ! ! $ A'+#*6$B*BC#*6$7'$D'#E$FG@BH$I'"()+5J$$ 3"KK@#+*'#$%$.7)+;$1.$/AL3.$ "#$!%&%'($#$!#)!'#$!*+&*',$-+&$!.#!*#!)/%0%-'!.12),.-%&)!&1#&3%3#&)!4,#!'%!/#$5+&$%6-'-)2!.#!$+&!%,)#,/!#)!&+&!*#''#!.789:;<8=>?@! ;?A@B$ /*$7@M'B*8+$*6+$6@'B)6$"'N$M@87)+)@86$7O'+)()6"+)@8$$ P!"+*#8)+5Q!"6$7R0+)()6"+)@8$/@BB*#M)"(*Q!"6$7*$4@7)>)M"+)@8$STU$V#"8M*W$ 7)6K@8)C(*$$*8$$():8*$;++K%XXM#*"+)Y*M@BB@86T@#:X()M*86*6XCEQ8MQ 87XSTUX7**7T>#$ $ 89":;8<=>?! :>@?A$ $ ! "+3+! .#! '%! $)/,*),/#! .7%**,#-'! ! A885*$'8)Y*#6)+")#*$%$ZU[\$]$ZU[^$ ,K5M)"()+5$%$ A:#@*M@(@:E$ ,K5M)"()6"+)@8$F*+$@K+)@8$5Y*8+'*((*J$%$$ ___________________$<BC21)%!&%!D1,!&EB*4&%'!
$ !"#$%&'()* !"#$#%&&%' !"#$%&$'()*+!(+,"#$-.'.).+/)0&*'()*+!(-+/1'($1(-+2%*3$34'5)(-6+ 2%*32,'4($.2'*(-6+73*.'13,(-+(.+!)+028-2%( !"#$%&'"(#!"#)*+,&'-'.'#/.01(-".(#!"&#/2-",2"&#%3(4,45-6."&7# %3(4%)-5",'%-("&7#84('-24)"&#"'#!.#0%9&%3" !"#$%&#'()%*'&+,-..)/)$'%0*'#!-&$'%&((-1*%)$%234 N$ N$Mémoire de Fin d'Études
d’Ingénieur de l’Institut Supérieur des Sciences agronomiques, agroalimentaires, horticoles et du paysage
de Master de l’Institut Supérieur des Sciences agronomiques, agroalimentaires, horticoles et du paysage
ACKNOWLEDGMENT
I am grateful to all those who participated to the achievement of this research.
First, I would like to thanks Dr. Chiara Pistocchi for the her guidance, trust and availability all along this internship as well as Dr. Claude Plassard for her help with the HPIC interpretation.
I would also like to thank Mr. Jean-Marc Souquet and Mr. Romain Domingo for their precious help in the laboratory handlings. This also goes to Dr. Patrick Doumas for his time during the HPIC analysis
TABLE OF CONTENTS !" #$%$&"'("$)&"%*$"+++++++++++++++++++++++++++++++++++++++++++++++++++++++++++++++++++++++++++++++++++++++++++++++++++++++++++++"," !"!# $%&#'%()'%(*+)#,-,.&""""""""""""""""""""""""""""""""""""""""""""""""""""""""""""""""""""""""""""""""""""""""""""""""""""""""""""""#/# !"!"!# #$%&'())%*%+,&-../0&.)&-$.0-$.*10&(+&,$%&0.(/&"""""""""""""""""""""""""""""""""""""""""""""""""""""""""""""""""""&2# !"!"3# 4*.5%00%0&*%0-.+0(6/%&).*&%75$8+9%0&6%,:%%+&-../0&""""""""""""""""""""""""""""""""""""""""""""""""""""""""&;& !"0# &1*$%2(*3)4#)(5.#&6756&&*)#""""""""""""""""""""""""""""""""""""""""""""""""""""""""""""""""""""""""""""""""""""""""""""""""""""#8# !"3"!# <1+5,(.+8/&9*.1-0&.)&%8*,$:.*=0&""""""""""""""""""""""""""""""""""""""""""""""""""""""""""""""""""""""""""""""""""""&># !"3"3# ?.(/&-8*8=%,%*0&1+'%*&,$%&(+)/1%+5%&.)&%8*,$:.*=0&""""""""""""""""""""""""""""""""""""""""""""""""""""""""&>& !"/# ,+**&6$#96(2.&:7&#*&71*:567#$%8.+&6,&#(;#&1*$%2(*3)#(6#'%()'%(*+)#""""""""""""""""""""""""""""#<# !"2"!# @.'()(58,(.+&.)&,$%&-../0&.)&-$.0-$.*10&"""""""""""""""""""""""""""""""""""""""""""""""""""""""""""""""""""""""""&A# !"2"3# B8*,$:.*=0&(+)/1%+5%0&(+&,$%&-../C5$8+9%0&"""""""""""""""""""""""""""""""""""""""""""""""""""""""""""""""""""""&D& !"=# (>?&,$5@&)#(;#(+*#)$+:-"""""""""""""""""""""""""""""""""""""""""""""""""""""""""""""""""""""""""""""""""""""""""""""""""""""""""""#A# -" .%$&*/%0"%12".&$)'2#"+++++++++++++++++++++++++++++++++++++++++++++++++++++++++++++++++++++++++++++++++++++++++++++++++"3" 0"!# &B'&*53&6$1.#)&$$567#16:#:&)576""""""""""""""""""""""""""""""""""""""""""""""""""""""""""""""""""""""""""""""""""""""""""""""#A# 0"0# .1>(*1$(*-#161.-)5)#"""""""""""""""""""""""""""""""""""""""""""""""""""""""""""""""""""""""""""""""""""""""""""""""""""""""""""""""#C# 3"3"!# ?.(/&-8*8=%,%*0&8+'&-$.0-$.*10&-../0&""""""""""""""""""""""""""""""""""""""""""""""""""""""""""""""""""""""""""""&E# 3"3"3# F4GH&8+8/I0(0"""""""""""""""""""""""""""""""""""""""""""""""""""""""""""""""""""""""""""""""""""""""""""""""""""""""""""""""""&!J# 3"3"2# @(+%*8/(K8,(.+&.)&.*98+(5&-$.0-$.*10&"""""""""""""""""""""""""""""""""""""""""""""""""""""""""""""""""""""""""""&!!& 0"/# ,1.,+.1$5(6#16:#)$1$5)$5,1.#161.-)5)#""""""""""""""""""""""""""""""""""""""""""""""""""""""""""""""""""""""""""""""""""""""#!0# ," *($#"+++++++++++++++++++++++++++++++++++++++++++++++++++++++++++++++++++++++++++++++++++++++++++++++++++++++++++++++++++++++++"!," /"!# 56;.+&6,&#(;#&1*$%2(*3)#(6#)(5.#'*('&*$5&)#""""""""""""""""""""""""""""""""""""""""""""""""""""""""""""""""""""""""""#!/# 2"!"!# @(5*.6(8/&5.==1+(,(%0&""""""""""""""""""""""""""""""""""""""""""""""""""""""""""""""""""""""""""""""""""""""""""""""""""&!2# 2"!"3# H$%=(58/&(+'(58,.*0&.)&,$%&=(5*.6(8/&85,(L(,I&"""""""""""""""""""""""""""""""""""""""""""""""""""""""""""""""""&!2& /"0# 56;.+&6,&#(;#&1*$%2(*3)#(6#$%&#:5;;&*&6$#'((.)#(;#'%()'%(*+)#16:#5$)#1@15.1>5.5$-#""""""""""""""""#!=# 2"3"!# G=-85,&.)&%8*,$:.*=0&.+&,$%&,.,8/&-$.0-$.*10&"""""""""""""""""""""""""""""""""""""""""""""""""""""""""""""&!;# 2"3"3# G=-85,&.)&%8*,$:.*=0&.+&,$%&*%-8*,(,(.+&.)&-../0&.)&-$.0-$.*10&""""""""""""""""""""""""""""""""""&!;# /"0"0"!# 7DEFGD#HIIHJK#EI#HGLKMNELOP#EQ#RMEPRMELSP#REEDP#""""""""""""""""""""""""""""""""""""""""""""""""#!=# /"0"0"0# &IIHJK#EI#HGLKMNELOP#TUVHPKUEQ#EQ#RMEPRMELSP#REEDP#""""""""""""""""""""""""""""""""""""""""""""#!8# /"0"0"/# &IIHJK#EI#JGPKWGVH#EQ#RMEPRMELSP#REEDP#"""""""""""""""""""""""""""""""""""""""""""""""""""""""""""""""""#!8# /"0"0"=# &IIHJK#EI#KMH#ISQJKUEQGD#VLESR#EQ#RMEPRMELSP#REEDP#""""""""""""""""""""""""""""""""""""""""""""""#!8# /"/# 56;.+&6,&#(;#&1*$%2(*3)#(6#$%&#)'&,51$5(6#(;#$%&#(*7165,#'%()'%(*+)#'((.)#16:#(6#(*7165,# 165(6)#""""""""""""""""""""""""""""""""""""""""""""""""""""""""""""""""""""""""""""""""""""""""""""""""""""""""""""""""""""""""""""""""""#!<# 2"2"!# M*98+(5&85('0&8+8/IK%'&6I&F4GH&"""""""""""""""""""""""""""""""""""""""""""""""""""""""""""""""""""""""""""""""""""""&!A# 2"2"3# ?-%5(8,(.+&.)&,$%&.*98+(5&-$.0-$.*10&-../&""""""""""""""""""""""""""""""""""""""""""""""""""""""""""""""""""""&!A& /"=# 56;.+&6,&#(;#&1*$%2(*3)#(6#'*(,&))&)#56@(.@&:#56#$%Ť&*1.5X1$5(6#(;#(*7165,#'%()'%(*+)#!Y#
5" 2/#64##/'1++++++++++++++++++++++++++++++++++++++++++++++++++++++++++++++++++++++++++++++++++++++++++++++++++++++++++++++++++++"!3" ="!# &B'.156567#,%167&)#(6#'#'((.)#$%169)#$(#,%167&)#(;#($%&*#)(5.#'1*13&$&*)#"""""""""""""""""""""""""#!A# ;"!"!# 4../&0(K%&""""""""""""""""""""""""""""""""""""""""""""""""""""""""""""""""""""""""""""""""""""""""""""""""""""""""""""""""""""""""&!O# ;"!"3# ?-%5(8,(.+&.)&,$%&.*98+(5&-$.0-$.*10&""""""""""""""""""""""""""""""""""""""""""""""""""""""""""""""""""""""""""""&3J& ="0# $%&#&6X-31$5,#1,$5@5$-#(;#'%()'%1$1)&)#:(&)#6($#&B'.156#$%&#'((.)#,%167&)#"""""""""""""""""""""""""#00# ="/# >5(.(75,1.#'*(,&))&)#$%1$#,16#&B'.156#$%(*@15.1>.&#'((.#,%167&)#"""""""""""""""""""""""""""""""#0/# 7" 6'1604#/'1"%12"8&*#8&6$/9&#"+++++++++++++++++++++++++++++++++++++++++++++++++++++++++++++++++++++++++++++++++++++"-7" 8"!# 7&6&*1.#,(6,.+)5(6#(;#(+*#)$+:-#"""""""""""""""""""""""""""""""""""""""""""""""""""""""""""""""""""""""""""""""""""""""#08# 8"0# 17*(&,(.(75,1.#'&*)'&,$5@&)#""""""""""""""""""""""""""""""""""""""""""""""""""""""""""""""""""""""""""""""""""""""""""""""#0<# "
TABLE OF ILLUSTRATIONS
Table 1: Influence of earthworms on soils properties. (DOC, inorganic C, soluble N, microbial C and microbial N are in mg/kg of soil).
Table 2: Influence of earthworms on pools of phosphorus. (in mg/kg of soil). Figure 1: Total phosphorus.
Figure 2: Repartition of phosphorus into the different pools.
Table 3: Concentration (mg/kg of soil) of organic acids obtained by hpic analysis.
Figure 3: Concentration (mg of P/kg of soil) of organic phosphorus molecules tested by hpic Figure 4: Influence of earthworms on the phosphatase activity.
Figure 5: Representation of the isotopic ratio of 18O-P of bulk soils and old cast. Table 4: Influence of earthworms on the !18O-P (‰)
Figure 6: Representation of the isotopic ratio of 18O-P of fresh casts.
Figure 7: Correlation circle of a PCA representing the different pools of phosphorus and different soil parameters.
Figure 8: Individuals map of a PCA presenting organic acids, organic phosphorus compounds and microbial carbon.
Figure 9: Correlation circle of a PCA presenting organic acids, organic phosphorus compounds and microbial carbon.
Figure 10: Individuals and variables map of a PCA presenting organic acids, phosphorus organic compounds and microbial carbon.
TABLE OF ANNEXES
Annex I: Correlation circles of a PCA representing the different pools of phosphorus and different soil parameters..……….33
1! State of the art
The scientific community is seriously concerned by the fate of phosphorus (P) supplies. Some studies regarding this so-called “P-Crisis” presented some extreme scenarios, in which we might run out of raw materials for the production of fertilizers within the current century (Cordell and White, 2011). If P-fertilizers happen to be more and more scarce the problem could be dramatic. Phosphorus is an essential element for plants, yet the soil solution’s concentration is often under the optimum for plant growth (Kruse et al., 2015). To tackle this situation, P fertilizers needs were estimated to 50 kg of P2O5/ha in average in Britany (Tóth et al., 2014). This has led to the creation of new research platforms such as the European Sustainable Phosphorus Platform (Kruse et al., 2015). Research should focus on improving the understanding of P cycle in the soil and increasing the use efficiency of this resource.
1.1! The phosphorus cycle
1.1.1! The different pools of phosphorus in the soil
Phosphorus is, by far, less abundant than the other macronutrients in soils. The P content depends on soil texture and its geological history. Soils do not contain elemental phosphorus but orthophosphates which are “the salt of phosphoric acid where a small central P5+- ion builds a tetraeder with four bigger O2” (Weihrauch and Opp, 2018). Orthophosphate can be present in organic or inorganic forms. These two categories are themselves separated in different pools characterized by a different turn-over time (Helfenstein et al., 2018).
The organic phosphorus forms after plant or microorganisms uptake and returns to soil after their death (Weihrauch and Opp, 2018). The soil content of organic phosphorus is depending on biological productivity and mineralization and as a consequence on various factors such as pedogenesis, pH, climatic condition, land-use (Weihrauch and Opp, 2018). Organic phosphorous can be found in various forms of different solubility and bio-availability: phosphonates and P-mono and di-esters. Yet the major organic phosphorus pool in soils is constituted by monoesters which are slightly soluble.
Moreover, up to 24% of the organic P pool is contained in the microbial biomass. Microbial phosphorus is considered as a labile pool as it only takes 2 hours after the death of the microorganism for the P to be bio-available (Kruse et al., 2015; Weihrauch and Opp, 2018).
The inorganic phosphorus does not always derive from the action of an organism and the changes in this pool depend on chemical equilibria (Weihrauch and Opp, 2018). Inorganic phosphorus can be separated in different pools as well, often operationally-defined, i.e. by the kind for chemical extraction used to
quantify them. These different pools are represented by phosphorus present in Calcium-minerals as well as the phosphorus sorbed in the soil constituents (Weil and Brady, 2017). Inorganic phosphorus can be sorbed to iron, aluminum or manganese oxyhydroxides, clay, carbonate or metal cations (Weihrauch and Opp, 2018). Sorption and desorption cannot often reach an equilibrium state as some of these reactions can be really slow and because the equilibrium continuously changes due to non-stationary conditions. Sorption is influenced by the ionic competition in the soil solution, the texture, the accessibility of the materials that will sorb phosphorus as well as the climate (Weihrauch and Opp, 2018). Depending on the sorption and on the pH of the soil, sorbed-phosphorus is more or less available. The other pool of the inorganic phosphorus is found in Calcium-minerals as a structural element.
Improving the bio-availability of phosphorus means increasing the content of phosphorus in the soil solution or increasing the soil buffering capacity for P, i.e. the capability of replenishing the soil solution of P when depleted. The soil solution is composed of ionic orthophosphate forms and some soluble organic compounds (Weihrauch and Opp, 2018; Weil and Brady, 2017). The predominance of orthophosphate ions depends on the pH of the soil: HPO42- in more basic soils and H2PO4- in acid ones (Kruse et al., 2015). The portion of organic phosphorus contained in the soil solution is operationally defined by the particles smaller than 0,45µm, which includes organic P in colloidal form. It is still unclear, if plants can take up organic molecules or colloidal P (Weil and Brady, 2017) and it is mainly assumed that only orthophosphate ions are a source of phosphorus for plants.
1.1.2! Processes responsible for exchanges between pools
Exchanges between these different P pools and the soil solution are constant and are possible through different processes such as sorption, desorption, or mineralization. Sorption and desorption depend on physico-chemical properties of the soil such as pH, concentration of organic carbon or calcium carbonate, soil texture or the presence of iron and aluminum oxides (Alamgir and Marschner, 2016). These factors are controlling the availability of phosphorus.
Another essential process replenishing soil solution is mineralization which allows the transformation of organic phosphorus into ionic bio-available orthophosphate. This reaction is catalyzed by phosphatase enzymes produced by animals, microorganisms or plants (Richardson and Simpson, 2011). These enzymes will, step by step, liberate the orthophosphate contained into phosphate esters. Phosphatase enzymes can have different pH optimums. According to that, they are classified as alkaline and acid, yet the alkaline phosphatase is only produced by microorganisms (Plassard et al., 2014). This means that in alkaline soils, only microbes are able to mineralize phosphate.
This biochemical process can be accelerated by different factors such as the pH, the C/P ratio of the organic substrate or the climate (Weihrauch and Opp, 2018; Weil and Brady, 2017). Some soil
organisms, such as earthworms can also accelerate mineralization as they accelerate the evolution of organic matter by stimulating the microbial activity (Scheu et al., 2002).
1.2! Earthworms: soil engineers
1.2.1! Functional groups of earthworms
Earthworms are among the most important organisms of soil macro-fauna in terms of abundance and they are usually classified in three functional groups: the Anecic, Endogeic and Epigeic. These groups are different in both their morphology and their behavior (Bouché et al., 1977):
!! The Anecic earthworms live in permanent vertical burrows opened on soil surface from which they take their food (organic and mineral matter). They digest under the soil surface and then put their cast on the soil surface as well as in the burrows where it forms a coat of cast which is a hot spot for microbial activity. Anecic earthworms are themselves separated into two distinct groups that are the Anecic strict and Epi-Anecic earthworms based on their morphological traits (Briones and Álvarez-Otero, 2018), burrowing (Bastardie et al., 2005) and feeding behaviors (Eisenhauer et al., 2008).
!! The Endogeic earthworms live in horizontal and temporary burrows that are refilled with their cast. They never go up to soil surface so they eat organic matter from the soil. !! The Epigeic earthworms live close to the soil surface or in the first centimeters of the soil
surface and are very active in the organic matter evolution.
The Anecic and Endogeic earthworms are the two functional groups more present in agricultural land as Epigeic only represent 2 to 3% of the earthworms density in conventional and organic fields (Pelosi et al., 2009). Moreover it is important to notice that under both crops management, endogeic earthworms represented more than 50% of the earthworms density (Pelosi et al., 2009). The dominance is mainly due to a lower exposure of both functional groups to pesticides compared to Epigeic earthworms. However they are both highly sensitive to ploughing due to the destruction of their burrows with a higher sensibility reported for the Anecic group (as reviewed in Bertrand et al., 2015).
1.2.2! Soil parameters under the influence of earthworms
Anecic and Endogeic earthworms both produce casts that will then be incorporated in the bulk soil. This cast presents many differences compared to the bulk soil (Barois and Lavelle, 1986). Regarding the chemical properties, casts are more basic than the bulk soil (Trigo and Lavelle, 1993; Vos et al., 2014) and increase the availability of most of the elements (Vos et al., 2014). There are also some changes
regarding the biological characteristics such as the microbial biomass which is more important in the cast than in bulk soil (Scheu, 1987). But this increase of microbial biomass is not as important for casts situated in the burrows, compared to casts on the soil surface (Scheu, 1987). This increase of microbial biomass is accompanied by a boost of the activity as there is an increase of microbial respiration (Scheu, 1987). These increases can be explained by an optimal pH for microbes as well as by the presence of more available nutrients, such as labile carbon. However, the microbial biomass present in cast goes back to its initial value within a few days. Scheu, 1987 also showed that within weeks, the microbial biomass is even lower than the one in the bulk soil.
Moreover, even in bulk soil, the presence of earthworms leads to modification of some properties. First the physical parameters are modified by the burrowing activity of earthworms that creates macro, meso and micro porosity (see reviews of Bertrand et al., 2015; Blouin et al., 2013). The chemical parameters are modified too by an increase of the mean turn-over time of the soil organic matter and nutrients, which increases their availability (reviewed in Bertrand et al., 2015). The biological parameters are also impacted as the microbial biomass is overall increased by the presence of earthworms (Burtelow et al., 1998). This microbial biomass increase is the consequence of the creation of favorable conditions for microorganisms: more accessible organic matter, more assimilable mucus, good habitat conditions.
For this reason, earthworms are known as soil engineers. The modification of the soil properties by earthworms leads to the fulfilment of many ecosystems services such as soil structure, water regulation, climate regulation, pollution remediation, plant production as well as nutrients cycling (Bertrand et al., 2015; Blouin et al., 2013 and references therein). Several studies were done on nutrients cycling in cast which is considered a hot spot for nutrients. The concentration of most minerals such as magnesium and calcium was found to be higher (Pommeresche et al., 2009), as well as for macro elements such as nitrogen, carbon and phosphorus (Buck et al., 1999; Pommeresche et al., 2009).
1.3! Current knowledge regarding the influence of earthworms on phosphorus
1.3.1! Modification of the pools of phosphorus
Many studies showed that casts are richer in total phosphorus (Chapuis-Lardy et al., 2011). This was proved in many different conditions: laboratory and field experiments (Jiménez et al., 2003) as well as under different land-uses (Jiménez et al., 2003; Kuczak et al., 2006; Scheu et al., 2002). This increase of total phosphorous can reach up to nearly 250% compared to the bulk soil (Kuczak et al., 2006).
More than just a global increase, an augmentation of the more labile pool of phosphorus has been observed in bulk soil as well as in casts. Devliegher and Verstraete, 1996 noticed an increase of the
phosphorus availability due to the presence of earthworms. Kuczak et al., 2006 showed that casts are richer in available phosphorus as well as in moderately available one. These two pools were defined as sums of the different fraction of Hedley fractionation (i.e. a sequential P extraction, Tiessen and Moir, 1993): the available phosphorous wad defined by the resin-, and bicarbonate- extractable fractions and the moderately available phosphorous was defined as the sum of the inorganic and organic sodium hydroxide- and the dilute acid- extractable fractions.
More precisely, an increase in the plant-available pool of phosphorus in the cast was visible in the field by a concentration of root biomass under earthworm’s casts (Decaëns et al., 2003). Moreover, it has been reported an increase of the dissolved organic and inorganic phosphorus in casts for both Anecic and Epigeic earthworms (Ros et al., 2017; Vos et al., 2014). This means that soil solution in casts is richer in phosphorus.
The presence of earthworms can also affect the other pools of phosphorus in casts or in bulk soil. The organic phosphorus is globally higher in cast (Chapuis-Lardy et al., 2011) and more precisely the more stable forms of phosphorus contained in the sodium hydroxide-extractable organic phosphorous fraction. The increase of the microbial phosphorus was also reported as a part of the augmentation of the organic P pool (Guggenberger et al., 1996; Jiménez et al., 2003). The stable inorganic pools are also affected, notably P sorbed to iron or aluminum oxi-hydroxides or in calcium minerals (Kuczak et al., 2006).
1.3.2! Earthworms influences in the pool-changes
The processes allowing these changes are still unclear but the biogeochemical state of phosphorus is changed in the soil in presence of earthworms as well as in their guts (Lavelle, 1997)
Studies regarding phosphatase showed different results as some showed that casts had a higher phosphatase activity (Hoang et al., 2016; Satchell and Martin, 1984), but some studies also showed that phosphatases were more present in bulk soil than in casts (Jiménez et al., 2003; Zhang et al., 2000). The decrease of the phosphatase activity in cast reached up to 44% in (Jiménez et al., 2003). The decrease in casts would mean that mineralization happens rather in earthworms gut rather than in casts as it was proven that earthworms were able to produce alkaline phosphatase (Satchell and Martin, 1984).
This could be explained by different characteristics of earthworms gut such as the higher pH (nearly + 2.1 (Barois and Lavelle, 1986)) and an increase of the microbial activity during digestion (Chapuis-Lardy et al. 2011). Another explanation for the gut mineralization could be linked to P release from the sorption complexes due to competition of phosphate with carboxyl groups produced by the microbial
mineralization of the soil eaten by the earthworms in the first part of the gut (Lopez-Hernandez et al., 1993) or with dissolved organic carbon (Ros et al., 2017).
More than earthworm’s guts properties, some soil properties influenced by earthworms can also explain some changes in the pools. These soil properties could explain the variability that we can find in the different studies regarding the increase of phosphorous. This variability could be explained, for instance, by the initial phosphorus quantities in the soil (Kuczak et al. 2006) or by the selective ingestion of food by earthworms (Ros et al., 2017). This means that there is a high variability in the effects on P availability that could be soil-dependent or species-dependent (Kuczak et al., 2006).
1.4! Objectives of our study
This study will try to improve the knowledge of the influence of earthworms on the phosphorus availability under close-to-field conditions. Its aims are to answer to these questions:
!! What is the impact of earthworms on the repartition of phosphorous in its different pools? !! How can we explain the changes observed between pools?
To answer to these questions a collaboration with the CNRS-Ecotron was established. Ecotron is a facility put in place by the CNRS in order to “allow precise conditioning to better understand states and activities at various scales”. The experiment we contributed to began in January 2017. Its aim is to measure the effect of Anecic and Endogeic earthworms on the emission of greenhouse gases under close-to-field conditions. In addition, we combined established techniques such as sequential P extraction or High Pressure Ionic Chromatography (HPIC) with innovative ones such as the analysis of oxygen isotopes in phosphates.
We will first see how the experiment was carried out and different analyses we performed. Then we will present the results that will be discussed in the next part to understand the mechanisms responsible for the P pool changes.
2! Material and Methods
2.1! Experimental setting and design
The experiment at the Ecotron site is carried out on 12 separated macrocosms. In each macrocosm, the soil was taken from the experimental site EFELE of the agricultural high school Théodore Monod (Le Rheu, France) at 3 different depths. The soil profile was then recreated at the Ecotron site. Soil and atmosphere moisture and temperature are controlled and reproduce the same field conditions as in
Rennes. All macrocosms have the same crop rotation and practices as the experimental site in Le Rheu. This means that there is a wheat, mustard and maize rotation that started in October 2017 under minimum-tillage. The initial fertilization of the macrocosm was done with organic residues (corn, hey and wheat straw) in July 2017 (660g/m2). Some digestate was also added twice in April and June 2018 (equivalent of 90kgN/ha). The earthworms were added in the beginning of 2017 to reach a density of 100 g/m2 compared to a mean of 91g/m2 in Brittany (Bellido et al., 2010). They were collected in Rennes as well as in Avignon. The species added were for Anecic earthworms: Lumbricus terrestirs, Apporrectodea longa and Scherotheca sp, and for the Endogeic: Apporectodea chlorotica, Apporectodea caliginosa and Apporectodea icterica.
The experiment design included 3 different treatments with 4 replicates each:
!! The first treatment is the control, where there was almost no earthworm (nearly 3g/m2). The absence of earthworms was assured by periodical electrical shocks that induce all the earthworms to reach the soil surface and allows removing them.
!! The two other treatments are the Endogeic and Anecic treatment. The soils were cleared of existing earthworms and earthworms from one specific functional group were successively introduced.
In October 2018, samples were collected by research staff for the realization of our study. For each macrocosm, a composite sample of bulk soil from 5 subsamples was collected. Additionally, in the Anecic treatment, casts from soil surface were collected without distinction of the species. Moreover, some bulk soil was also sampled to be incubated for 7 days at 16°C with a high biomass of earthworms (around 700g of soil for 25 to 80g of earthworms). The incubation was done with at constant temperature and in darkness, yet the humidity was not controlled and it could vary. This treatment allowed us to have soil that was totally digested by earthworms. Overall our samples set includes 12 bulk soil samples (from the three treatments), 4 casts samples from soil surface (Anecic treatment) and 8 samples of freshly digested soil (Anecic and Endogeic treatment).
Samples were stored fresh at 4°C before analysis.
2.2! Laboratory analysis
2.2.1! Soil parameters and phosphorus pools
Some general analyses were done by a student on all our samples to be able to detect if earthworms modified the chemical or biological properties of the soil. The parameters analyzed were:
!! Microbial Nitrogen !! Microbial Carbon
!! Dissolved Organic Carbon !! Soluble Nitrogen
!! Inorganic Carbon !! pH
To quantify the phosphorus pools in the bulk soil and in the casts and assess whether the presence or the digestion of earthworms modified the repartition of P in these pools, an Hedley sequential fractionation as modified by Tamburini et al., 2018 was done by the same student. A sequential extraction aims to use progressively stronger chemical reactants to extract by each new step a more stable P pool. Five different pools were then quantified:
!! Extraction with anionic resins (BDH #55164, 6 cm × 2 cm) targeting the plant-available phosphorus
!! Extraction with anionic resins and hexanol that targets the microbial phosphorus.
!! Extraction with NaOH-EDTA targeting P sorbed to Fe and Al (oxy)hydroxides and the non-refractory organic phosphorus.
!! Extraction with HCl that targets the less available phosphorus bound in calcium minerals.
P concentration was measured in these pools using the Malachite green method (Van Veldhoven and Mannaerts, 1987). For total P, we mineralized our soils with concentrated nitric acid by a microwave cycle of 32 minutes that reach up to 220°C.
2.2.2! HPIC analysis
A quantification and speciation of low molecular weight organic molecules through High Pressure Ionic Chromatography (HPIC) was realized. This technique allowed us to identify and quantify with high degree of sensitivity organic P molecules and verify if their concentrations changed under the influence of earthworms or after digestion. To do so, the soils were extracted with 0.5M NaOH and subsequently humic acids in soil extracts were eliminated by precipitation with HCl. Chlorides, which could interfere with the detection of some species, were removed from the mobile phase thanks to cartridges containing AgNO3, according to the protocol given in (Waithaisong et al., 2015).
The HPIC separates at different times diverse molecules depending on their negative charge, which are then detected through conductimetry. The area contained under the conductivity peak depends on the concentration. Standard curves allowed us to calculate the sample concentrations and were obtained by spiking a sample with three different concentrations of standards of the organic compounds. Standards we included were: sodium nitrate (Riedel-de-Haën), malonic acid (MERCK-Schuchardt), oxalic acid dihydrate (Fluka), malic acid (Sigma), potassium phosphate monobasic (Sigma), citric acid (Sigma), sodium pyrophosphate dibasic (Sigma), D-fructose 1,6-biphosphate sodium salt (Sigma), Adenosine 5’
triphosphate disodium salt hydrate (Sigma), Adenosine 5’ monophosphate sodium salt (Sigma), D-glucose-6 phosphate disodium salt (Sigma) and sodium phytate (Sigma).
Phytate was separated from the other anions to avoid contamination that would biased the other standard curves as phytate standard presented other spikes. The concentration of glucose-6-phosphate was instead measured with a SIGMA kit (MAK014), due to an interference with sulfate in the HPIC. For our statistical analysis, we only applied a partial dilution correction and did not take into account the dilution effect that the cartridge can have.
2.2.3! Mineralization of organic phosphorus
In order to measure the isotopic ratio of oxygen in phosphates, three of these pools (plant available, microbial and mineral phosphorus) were purified to transform all phosphorus into silver-phosphate for isotopic analyses according to the protocol of Pistocchi et al., 2014, adapted from Tamburini et al., 2010. This sample preparation is a succession of precipitation and dissolution that aims at eliminating all compounds that could interfere on the isotopic ratio. The samples were sent to Zurich (Laboratory of the Group of Plant Nutrition, ETH Zurich) to analyze their oxygen isotopic ratio by an elemental analyzer coupled to an isotopic ratio mass spectrometer (Isoprime 100, Elementar GmbH).
This isotopic ratio allows to know if the phosphate underwent biological reactions via enzymes (Tamburini et al., 2014). This ratio is indeed preserved in the absence of biological activity and in case of sorption/desorption of phosphorus onto minerals or precipitation/dissolution (Jaisi and Blake, 2010). The activity of living organisms and enzymes instead alter the oxygen isotope ratio. First, an enrichment of the heavier isotopes in the residual phosphate in the environment can be an effect of microbial uptake, as they are more likely to uptake the lighter isotopologues. Additionally, the isotopic ratio is altered as a phosphate molecule enters a living cell, as it turned over to reach a temperature-dependent isotopic equilibrium under the effect of intracellular enzymes such as pyrophosphatases. Finally, the phosphate produced by the hydrolysis of phosphoesters by extracellular phosphatase enzymes has a depleted isotopic ratio compared to the original compound, as these enzymes induce a negative fractionation: -10 to -30‰ according to the type of enzyme, e.g. acid or alkaline phosphatases.
Results will be presented in the conventional delta notation (δ18O-P) (Tamburini et al., 2014). Our results were interpreted according to:
!! the equilibrium between water and dissolved phosphate driven by the intracellular pyrophosphatase activity, which was calculated with an equation adapted from (Chang and Blake, 2015) where the isotopic ratio of water was the mean value for the Occitanie region (Genty et al., 2014):
Equilibrium δ18O-P = -0.18 x T +26,3 - δ18O-H2O T : Temperature
!! the acid and alkaline phosphatase fractionation values (Liang and Blake, 2006; von Sperber et al., 2014).
Measured isotopic values similar to the expected isotopic equilibrium indicate the imprint of intracellular P turnover, while depleted values indicate the effect of extracellular phosphatases and therefore the imprint of mineralization of organic P. The measured isotopic values were additionally compared with the reference value for P in the soil constituents approximated by the mineral phosphorus (P extracted by 1M HCl).
Finally, we analyzed the enzymatic activity of the phosphatase in our soil and cast samples. Our dosage relied on the previous extraction of the enzymes in the soil suspension. The activity was measured by the fluorometric determination of 4-MUB. The protocol was adapted from (Bell et al., 2013).
2.3! Calculation and statistical analysis
Statistical analyses were done with the R software (the R Project for Statistical Computing). To analyze all our data, we used the ANOVA analysis from the FactoMineR package that was completed by a Tuckey test on means with a limit of significance for the p value of 0.05. The ANOVA were only accepted if they were negative for the Levene and Shapiro tests. For all data except the HPIC data, we completed our analysis with orthogonal contrasts using the “contrasts” function in R (package stats) Orthogonal contrasts for analysis of variance are independent linear comparisons between the groups of a factor. Hence, they allow to highlight differences between a particular set of levels of a factor. As the sampling design gave us 6 independent treatments (control, bulk soil from Anecic or Endogeic treatment, soil surface casts from the Anecic treatment and fresh casts produced by Endogeic and Anecic earthworms), 5 contrasts were possible. Contrasts were imposed by our treatments as following: Control compared to the mean of all other treatments; Mean of bulk soil with Endogeic and Anecic earthworms compared to the mean of all casts; Soil surface cast compared to the mean of fresh casts produced by Anecic and Endogeic earthworms; Bulk soil under Anecic treatment compared to bulk soil under Endogeic treatment and fresh cast produced by Anecic compared to fresh casts produced by Endogeic.
To explain our results regarding phosphorus pools size and HPIC, two distinct PCA were realized thanks to the FactoMineR and factoextra packages. Regarding HPIC, clusters were built thanks to hierarchical clustering (HCPC function) and confirmed with a permutation test (randtest function) in the Ade4 package.
Table 1: Influence of earthworms on soils properties.
(DOC, Inorganic C, Soluble N, Microbial C and Microbial N are in mg/kg of soil)
Mean and P value according to orthogonal contrasts.
Control: Bulk soil without earthworms. Bulk A or E: Bulk soil with Anecic earthworms (A) or Endogeic earthworms (E). Bulk: Mean of bulk soils A and E. Fresh cast A and E: Soil incubated with
either Anecic earthworms (A) or Endogeic earthworms (E) Fresh Cast: Mean of fresh cast A and E. Old cast: Cast sampled on soil surface (only for Anecic treatment). Cast: Mean of both fresh casts
and old casts. All: mean of all treatments except the control.
!
!""!#$%&"%$'!%"()#$*&)+,%-.&(/% 0".!1'%#+1$2%
!""!#$%&"%$'!%"()#$*&)+,%-.&(/% 03(,4%1&*,2%
% Fresh Cast A Fresh cast E p value Bulk A Bulk E p value
pH 6.5 6.6 0.597 6.3 6.4 0.894
Dissolved Organic Carbon 131.75 188.85 0.292 16.20 28.15 0.220 Inorganic Carbon 5.13 25.18 0.053 . 1.90 2.10 0.968 Soluble Nitrogen 228.06 262.90 0.988 4.8 4.00 0.436 C/Nmic 12.68 10.86 1.000 11.67 8.02 0.672 C/Pmic 36.18 35.73 0.216 11.29 19.63 0.380 Microbial C 312.13 403.35 0.146 74.00 63.95 0.334 Microbial N 36.00 54.50 0.245 7.63 9.63 0.513 !
-,&3+,%!""!#$%&"%!+.$'5&.61% !""!#$%&"%7*-!1$*&)% !""!#$%&"%#+1$8+-!%%
% Control All p value Bulk Casts p value Fresh Cast Old Cast p value
pH 6.4 6.5 0.509 6.3 6.6 0.080 . 6.5 6.9 0.121
Dissolved Organic Carbon 30.45 104.32 0.003 ** 22.18 159.08 1.47E-08 *** 160.30 156.63 0.934 Inorganic Carbon 0.50 7.94 0.022 * 2.00 11.90 0.001 *** 15.15 5.40 0.003 **
Soluble Nitrogen 5.48 112.63 2.73E-07 *** 4.40 184.78 6.93E-13 *** 245.48 63.38 2.25E-04 ***
C/Nmic 7.98 13.44 0.660 9.85 15.84 0.383 11.77 23.98 0.331
C/Pmic 25.34 23.21 0.857 15.46 28.38 0.091 . 35.95 13.23 0.013 *
Microbial C 81.38 201.70 1.31E-05 *** 68.98 290.18 3.48E-11 *** 357.74 155.05 6.15E-06 *** Microbial N 11.68 24.63 0.191 8.63 35.29 1.04E-04 *** 45.25 15.38 0.001 ***
3! Results
3.1! Influence of earthworms on soil properties
3.1.1! Microbial communities
The microbial communities were analyzed through 4 indicators (microbial carbon and nitrogen, microbial C/N and C/P ratios). The size of the microbial community was globally impacted by the presence of earthworms as the microbial carbon was higher for the global soil (mean of the treatments: bulk soil and casts) than in the control treatment (Table 1). This difference is mainly due to the high microbial C present in casts. Indeed, the digestion of the soil by earthworms increased the size of the community as both microbial carbon and nitrogen were higher in casts compared to bulk soils (Table 1). However, this value was highly age-dependent as there was a decrease of both N and C in the aged-cast, although without attaining the value of bulk soil (Table 1).
The stoichiometry of the microbial community was also analyzed through the C/N and C/P ratios in the microbial biomass. These ratios were not significantly different between the global soil (bulk soils and casts) and the control as well as between fresh casts and bulk soils (Table1). However, when comparing fresh to old casts, we noticed a significant difference concerning the C/P ratio with higher values for the fresh casts (Table 1).
Moreover, it is important to notice that the functional group of earthworms did not affect the microbial communities on neither its size nor its stoichiometry.
3.1.2! Chemical indicators of the microbial activity
Four chemical parameters were analyzed: pH, soluble nitrogen, labile organic and inorganic carbon. These last three indicators are indicators of the microbial activity (Xing et al., 2010). The presence of earthworms increased the soluble nitrogen as well as the labile and inorganic carbon present in global soil (Table 1). This means that the microbial activity was more important with the presence of earthworms and it led to an increase of available nutrients in the soil. Yet the presence of earthworms did not affect the pH of the soil in any of the orthogonal contrasts (Table 1).
When comparing bulk soils to casts, the soluble nitrogen, the labile and inorganic carbon were all significantly higher in the casts (Table 1). This means that the digestion of the soil by earthworms either concentrated the nutrients in casts, or made them more available due to the microbial activity. The soil was also found to be slightly more alkaline in casts (Table 1), yet the difference was not significant.
Figure 1: Total phosphorus.
Control: Bulk soil without earthworms. Bulk A or E: Bulk soil under the influence of Anecic (A) or Endogeic (E) earthworms. Fresh cast A or E: Soil digested by Anecic (A) or Endogeic (E) earthworms. Cast A: Casts sampled on soil surface only for Anecic treatment. Distinct capital letters
indicate statistical significance (p < 0.05)according to ANOVA.
Table 2: Influence of earthworms on pools of phosphorus. (in mg/kg of soil)
Mean and P value according to orthogonal contrasts.
Control: Bulk soil without earthworms. Bulk A or E: Bulk soil with Anecic earthworms (A) or Endogeic earthworms (E). Bulk: Mean of bulk soils A and E. Fresh cast A and E: Soil incubated with
either Anecic earthworms (A) or Endogeic earthworms (E) Fresh Cast: Mean of fresh cast A and E. Old cast: Cast sampled on soil surface (only for Anecic treatment). Cast: Mean of both fresh casts and
old casts. All: mean of all treatments except the control. ! "! "! "! "! " # $## %## &## '## (### ($## )*+,-*. !/.01" !/.012 3-4561" 3-45612 )75,1" 8*,7.196*5:6*-/51;<=>0=?1 ! !""!#$%&"%$'!%"()#$*&)+,%-.&(/% 0".!1'%#+1$2% !""!#$%&"%$'!%"()#$*&)+,%-.&(/% 03(,4%1&*,2%
% Fresh Cast A Fresh cast E p value Bulk A Bulk E p value
Resin Extractable P 29.83 23.90 0.043 * 20.79 20.54 0.894
Microbial P 7.40 9.13 0.419 5.05 3.71 0.530
NaOH Extractable Inorganic P 350.55 319.45 0.147 321.25 303.25 0.392 NaOH Extractable Organic P 277.37 261.52 0.629 125.39 90.82 0.298 HCl Extractable P 131.96 149.3 0.078 . 109.85 95.33 0.135 Residual P 72.74 108.92 0.589 248.16 320.34 0.286 Total P 869.86 872.22 0.961 830.49 833.99 0.943
!
-,&3+,%!""!#$%&"%!+.$'5&.61% !""!#$%&"%7*-!1$*&)% !""!#$%&"%#+1$8+-!%%
% Control All p value Bulk Casts p value Fresh Cast Old Cast p value
Resin Extractable P 22.24 28.03 0.029 * 20.66 32.94 2.94E-06 *** 26.86 45.08 8.08E-06 ***
Microbial P 4.01 7.11 0.076 . 4.38 8.93 0.003 ** 8.26 10.26 0.283
NaOH Extractable Inorganic P 328.00 321.65 0.694 312.25 327.92 0.252 335.00 313.75 0.247 NaOH Extractable Organic P 91.26 166.64 0.007 ** 108.11 205.66 0.002 *** 269.45 78.10 2.07E-06 ***
HCl Extractable P 103.60 118.25 0.057 . 102.59 128.70 3.83E-04 *** 140.63 104.83 3.09E-04 *** Residual P 267.90 236.30 0.542 284.25 204.33 0.076 . 90.83 431.32 1.16E-05 *
The nutrient availability in casts depended on the age of the cast except for the labile carbon. Indeed, for inorganic carbon and soluble nitrogen we could see a significant decrease in aged-casts (Table 1). No differences were found between Anecic or Endogeic treatments for neither bulk soil nor fresh cast (Table 1).
3.2! Influence of earthworms on the different pools of phosphorus and its availability
3.2.1! Impact of earthworms on the total phosphorus
Total phosphorus was analyzed in all our samples. A trend of increasing total phosphorus from bulk to fresh cast and from fresh cast to old cast can be observed (Fig 1). Yet the increase was only significant between the control bulk soil and the old Anecic cast.
On the global soil (mean of the treatments: bulk soil and casts), earthworms did not increase the total phosphorus (Table 2). However, it seems that casts present a higher quantity of phosphorus than bulk soils (Table 2). When comparing the casts regarding their age we can see that the older casts contain more phosphorus that the young ones (Table 2). This means that due to earthworms, there is a concentration of phosphorus in the casts that is more important on the casts present on the soil surface.
3.2.2! Impact of earthworms on the repartition of pools of phosphorus
The repartition of the phosphorus in different pools was analyzed to see the impact of earthworms on the availability of phosphorus through an ANOVA on relative and absolute values that gave same results due to the similar amount of total phosphorus in all our samples.
3.2.2.1! Global effect of earthworms on phosphorus pools
The three treatments of bulk soil, whether with or without earthworms, did not present any significant difference regarding the relative size of their different P pools (Fig 2). This means that the earthworms did not have an impact on the bulk soil regarding phosphorus availability. Yet when comparing soil without any earthworms to all different treatments (global soil), we can see that the presence of earthworms increased both the directly-plant-available and the organic phosphorus (Table 2). This suggests that, globally, the soil was impacted by the presence of earthworms when considering both bulk soil and the hotspots represented by the casts.
! " ! " ! " ! " ! " " " " "! "! " "! ! ! ! ! " " ! !) !) ) "! " ) " "! " ! ! " #@ (#@ $#@ A#@ %#@ B#@ &#@ C#@ '#@ D#@ (##@ )*+,-*. !/.01" !/.012 3-4561" 3-45612 )75,1"
E45F+12G,-7H,7I.419 JFH-*IF7.19 K7LM12G,-7H,7I.41N+*-=7+FH19 K7LM12G,-7H,7I.41L-=7+FH19 M).12G,-7H,7I.419 E45FO/7.19
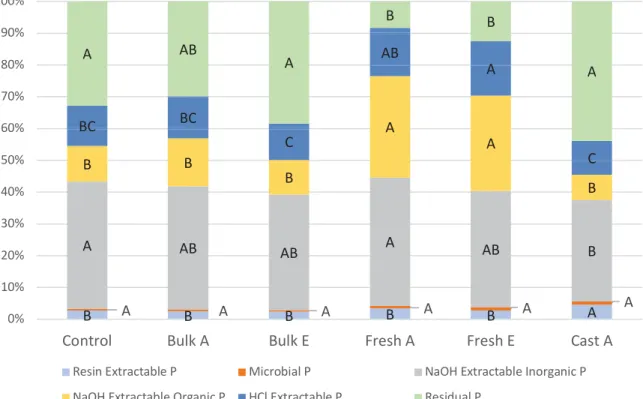
Figure 2: Repartition of phosphorus into the different pools.
Control: Bulk soil without earthworms. Bulk A or E: Bulk soil under the influence of Anecic (A) or Endogeic (E) earthworms. Fresh A or E: Soil digested by Anecic (A) or Endogeic (E) earthworms. Cast A: Casts sampled on soil surface only for Anecic treatment. Distinct capital letters indicate
3.2.2.2! Effect of earthworms digestion on phosphorus pools
The ingestion and digestion of soil by the earthworms seems to have a clear impact on the phosphorus availability as the repartition of the phosphorus is clearly different in casts compared to bulk soil (Fig 2). Almost all the pools of phosphorus were impacted by the soil digestion. There was an increase of the more available pools of phosphorus, namely plant-available (resin extractable) and microbial phosphorus, but the organic phosphorus was also increased as well as the phosphorus bound in calcium minerals (HCl extractable P, Table 2).
However, these differences were mainly due to fresh cast, as the older one had a repartition of P pools comparable to bulk soil (Fig 2). First, the organic pool of phosphorus was more important in fresh casts (twice as in the bulk soil). The phosphorus bound in calcium minerals was also increased by the digestion but only for the Endogeic treatment. Interestingly, the residual phosphorus, i.e. the fraction not recovered through the sequential extraction, decreased nearly 3 times in the fresh cast compared to bulk soil.
3.2.2.3! Effect of cast-age on phosphorus pools
The effect of earthworms on the repartition of the different pools does not seem to last in time as we can see by comparing fresh casts to old casts (Fig 2). There was a significant difference of the repartition for all pools except the P sorbed onto Fe and Al hydroxides and microbial phosphorus (Table 2). It seems that with time, the soil ingested by the earthworms takes back the same properties as bulk soil under the influence of earthworms (Fig 2). It is worth noticing that the old casts present a higher proportion of plant-available phosphorus than both bulk soils and fresh casts (Fig 2).
3.2.2.4! Effect of the functional group on phosphorus pools
Functional groups of earthworms did not seem to have an influence on the repartition of the phosphorus into the different pools (Fig 2). However, we can notice that the absolute value of plant-available phosphorus was higher in the cast of Anecic earthworms compared to Endogeic ones (Table 2). This is the only significant difference for both fresh cast and bulk soil when comparing them according to the earthworms functional group. This suggests earthworms of different functional groups have the same impact on phosphorus.
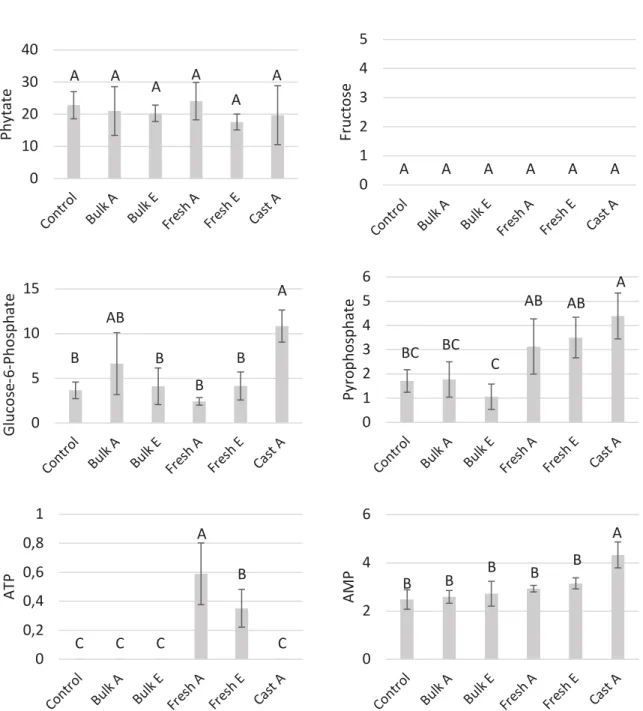
Figure 3: Concentration (mg of P/kg of soil) of organic phosphorus molecules tested by HPIC
Control: Bulk soil without earthworms. Bulk A or E: Bulk soil under the influence of Anecic (A) or Endogeic (E) earthworms. Fresh cast A or E: Soil digested by Anecic (A) or Endogeic (E) earthworms.
Cast A: Casts sampled on soil surface only for Anecic treatment. Capital letters indicate statistical significance (p < 0.05) according to ANOVA.
" " " " " " # (# $# A# %# )*+, -*. !/.0 1" !/.0 12 3-45 61" 3-45 612 )75, 1" 9 6 P ,7 ,4 1 " " " " " " # ( $ A % B )*+, -*. !/.0 1" !/.0 12 3-45 61" 3-45 612 )75, 1" 3 -/ H, * 54 ! "! ! ! ! "1 # B (# (B )*+, -*. !/.0 1" !/.0 12 3-45 61" 3-45 612 )75, 1" Q ./ H* 54 R& R9 6 * 5: 6 7 ,4 1 !) !) ) "! "! " # ( $ A % B & )*+, -*. !/.0 1" !/.0 12 3-45 61" 3-45 612 )75, 1" 9 P -* : 6 * 5: 6 7 ,4 1 ) ) ) " ! ) # #S$ #S% #S& #S' ( )*+, -*. !/.0 1" !/.0 12 3-45 61" 3-45 612 )75, 1" " 8 9 1 ! ! ! ! ! " # $ % & )*+, -*. !/.0 1" !/.0 12 3-45 61" 3-45 612 )75, 1" " J 9 1
Table 3: Concentration (mg/kg of soil) of organic acids obtained by HPIC analysis. Control: Bulk soil without earthworms. Bulk A or E: Bulk soil under the influence of Anecic (A) or
Endogeic (E) earthworms. Fresh cast A or E: Soil digested by Anecic (A) or Endogeic (E) earthworms. Tur A: Casts sampled on soil surface only for Anecic treatment. Distinct letters indicate
significant differences (p < 0.05) according to ANOVA
Control Bulk A Bulk E Fresh A Fresh E Tur A
Malate 6.15 b 6.09 b 5.55 b 4.4 b 4.55 b 10.33 a
Malonate 14.5 b 13 b 15.7 b 12.9 b 13.9 b 32.9 a
Oxalate 12.51 ab 9.94 b 13.15 ab 12.47 ab 12.6 ab 29.7 a
3.3! Influence of earthworms on the speciation of the organic phosphorus pools and on organic anions
Even though the efficiency of the method applied to our samples was not high as around 15% of the total organic P was analyzed, we were able to compare the different treatments as the efficiency did not differed between them. However, we were able to analyze only a part of the NaOH-extractable components, the one constituted by low molecular weight organic compounds.
3.3.1! Organic acids analyzed by HPIC
Different elements have to be noticed. First, we can notice that malate and malonate significantly increased (by a factor of 2) in the casts collected on the soil surface (Table 3). Secondly, oxalate did not present any significant change among all treatments except for bulk soil with Anecic earthworms and casts produced by the same functional group and sampled on the soil surface (Table 3). The increase from bulk to cast was of a factor 3. Even though there was a slight increase from bulk soil to fresh cast this increase was not significant. Finally, citrate presented a totally different pattern (Table 3). There was no difference between bulk soils and old casts sampled on soil surface. However, there was a significant increase from these four treatments compared to fresh casts.
3.3.2! Speciation of the organic phosphorus pool
Six organic compounds containing phosphorus were analyzed by HPIC. None of them was found at the same concentration among the different treatments. There were two exceptions: phytate presented no difference of concentration between the five treatments and the control bulk soil (Fig 3), meaning that phytate was not affected by the presence of earthworms and fructose-bis-P, which was rarely detected.
Glucose-6-phosphate was affected by the presence of earthworms. It was more concentrated into soil surface cast that in any of the other treatments (Fig 3). But the difference was not significant compared to bulk soil under the presence of Anecic earthworms. Casts on soil surface were also more concentrated in pyrophosphate (Fig 3) than the bulk soil. This increase of the concentration seems to start when soil is ingested, as fresh casts seemed to present a slightly higher concentration, although not significant.
ATP and AMP were also analyzed and presented different patterns of concentration. ATP was found neither in bulk soil nor in old casts. (Fig 3) However it was found in fresh cast. Additionally, there was a higher concentration of ATP in fresh casts produced by Anecic earthworms than by the ones produced by Endogeic earthworms. Unlike ATP, AMP was present in all treatments (Fig 3). Its concentration was
#S## (S## $S## AS## %S## BS## &S## CS## 'S## DS## )*+,-*. ".. !/.0 )75,5 3-4561)75, L.O1)75, 3-4561)75, " 3-4561H75, 2 !/.01" !/.012 QTL!"T12332)81L3 2"E8MULEJV 2332)81L3 WNQ2V8NLK 2332)81L31)"V8R"Q2 2332)81L318M2 3XK)8NLK"T1QELX9 ;3E2VM1)"V8? 2332)81L318M2 3XK)8NLK"T1QELX9 ;!XTY1VLNT? 2 + ZP < 7 ,F H1 5: 4 4 O 1; + < >< F+ >= ? 11,00 13,00 15,00 17,00 19,00 21,00 23,00 25,00 27,00
Control Bulk A Bulk E Cast A
!1 8 O -P ‰ ( V S M O W )
18OP resin 18OP mic
Pvalue : 0.792 Pvalue : 5x10⁻⁵ ***
Pvalue : 0.352 Pvalue : 0.872 Pvalue : 0.307
Figure 4: Influence of earthworms on the phosphatase activity.
Mean and P value according to orthogonal contrasts.
Control: Bulk soil without earthworms. Bulk A or E: Bulk soil with Anecic earthworms (A) or Endogeic earthworms (E). Bulk: Mean of bulk soils A and E. Fresh cast A and E: Soil incubated with
either Anecic earthworms (A) or Endogeic earthworms (E) Fresh Cast: Mean of fresh cast A and E. Old cast: Cast sampled on soil surface (only for Anecic treatment). Cast: Mean of both fresh casts and
old casts. All: mean of all treatments except the control.
Alkaline phosphatase
Soil reference Equilibrium water/phosphatase
Acid phosphatase
Figure 5: Representation of the isotopic ratio of 18O-Pof bulk soils and old cast. Control: Bulk soil without earthworms. Bulk A or E: Bulk soil under the influence of Anecic (A) or
Endogeic (E) earthworms. Tur A: Casts sampled on soil surface only for Anecic treatment.
Soil reference: mean of !18
O-P values obtained for HCl-extactable phosphorus. Water/phosphatase equilibrium: calculated with the equation of Chang and Blake, 2015. Alkaline and acid phosphatase:
almost identical in all treatments with the exception of casts present on soil surface (old cast) where it was higher.
3.4! Influence of earthworms on processes involved in the mineralization of organic phosphorus
3.4.1! Phosphatase activity
The enzymatic activity of the phosphatase was not impacted by the presence of earthworms as no difference was observed between the control treatment compared to the mean of all other treatments corresponding to a real soil with both bulk soil and casts (Fig 4). However, we can see a significant decrease of the activity from the bulk soil to casts. This suggests that the digestion of the soil by earthworms decrease the enzymatic activity. Yet, as there is no significant difference between old and fresh cast, the enzymatic activity in casts appeared to persist with time. The Anecic and Endogeic functional groups had the same influence on the enzymatic activity in both bulk soil and fresh casts.
3.4.2! Isotopic ratios of oxygen in phosphate (δ18O-P)
For all bulk soils, the resin-extractable phosphorus pool was at the expected isotopic equilibrium between dissolved phosphate and water and was also close to the soil reference defined by the mean of the δ18O-P values obtained for the HCl-extractable phosphorus of bulk soils (Fig 5). However, the δ18 O-P of microbial phosphorus in bulk soils were all higher than the equilibrium (Fig 5) meaning that there was a biological activity that affected this pool different from intracellular turnover (Tamburini et al., 2014). However, these values were not influenced by the presence of earthworms (Fig 5) nor by the functional group of earthworms, as no significant differences were found between these treatments (Table 4). The isotopic values of both resin and microbial P in the bulk soils was not close to the expected alkaline or acid phosphatase signatures, i.e. phosphate resulting from mineralization of phosphomonoesters, respectively at 12.5‰, and 15‰ (Fig 5).
When focusing on old casts, we noticed that both resin-extractable phosphorus and microbial phosphorus had a δ18O-P higher than the equilibrium and the soil’s reference (Fig 5). As for the bulk soils, these values appear not influenced by phosphatases activity. Interestingly, δ18O-P values of resin-extractable and microbial phosphorus were identical in these samples.
Fresh cast were plotted separately as the equilibrium between water and dissolved phosphate was different from the other samples due the different temperature during the incubation (Fig 6). The


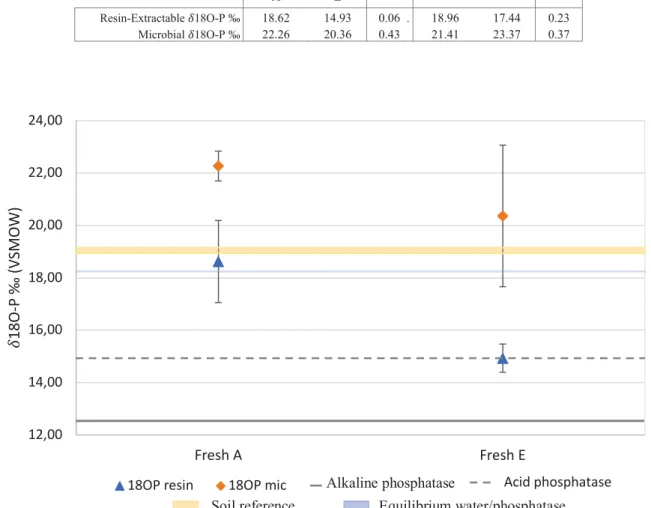


![Risiko- & [und] Schutzfaktoren der psychischen Gesundheit humanitärer Einsatzhelfer : eine systematische Literaturübersicht](data:image/gif;base64,R0lGODlhAQABAIAAAP///wAAACH5BAEAAAAALAAAAAABAAEAAAICRAEAOw==)