1 Assessment of bovine tuberculosis risk factors based on nationwide molecular 1
epidemiology 2
Running title: molecular typing and bovine tuberculosis epidemiology 3
Authors: Humblet M.-F.1, Gilbert M.2,3, Govaerts M.4, Fauville-Dufaux M.5, Walravens K.4 4
Saegerman C.1* 5
1
Research Unit in Epidemiology and Risk Analysis applied to Veterinary Sciences (UREAR), 6
Department of Infectious and Parasitic Diseases, Faculty of Veterinary Medicine, University 7
of Liège, B42, Boulevard de Colonster 20, B-4000 Liège, Belgium 8
2
Biological Control and Spatial Ecology, Free University of Brussels, avenue F.D. Roosevelt
9
50, B-1050 Brussels, Belgium
10
3
Fonds National de la Recherche Scientifique, rue d’Egmont 5, B-1000 Brussels, Belgium 11
4
Department of Bacterial Diseases, Veterinary and Agrochemical Research Centre, 99 12
Groeselenberg, B-1180 Brussels, Belgium 13
5
Division Mycobacteriology, Department of Infectious and transmissible diseases, Scientific 14
Institute of Public Health, Federal Public Service, Health, Food Chain Security and 15
Environment, rue Juliette Wytsman 14, B-1050 Brussels, Belgium 16
*Corresponding author: Research Unit in Epidemiology and Risk Analysis applied to 17
Veterinary Sciences, Department of Infectious and Parasitic Diseases, Faculty of Veterinary 18
Medicine, University of Liège, B42, Boulevard de Colonster 20, B-4000 Liège, Belgium; e-19
mail address [email protected]; Tel.: +32-4-366-45-79; Fax: +32-4-366-42-61. 20
Key words: bovine tuberculosis – Mycobacterium bovis – molecular epidemiology – space-21
time dynamics – modelling 22
2 Abstract
23
This assessment aimed to elaborate a statistical nationwide model to analyze the space-time 24
dynamics of bovine tuberculosis in search of potential risk factors that could be used to better 25
target surveillance measures. A database comprising Mycobacterium bovis molecular profiles 26
from all isolates of Belgian outbreaks during the 1995-2006 period (N=415) allowed the 27
identification of a predominant spoligotype (SB0162). Various databases compiling 49 28
parameters to be tested were queried using a multiple stepwise logistic regression to assess 29
bovine tuberculosis risk factors. Two isolate datasets were analyzed: the first included all 30
Mycobacterium bovis isolates, while the second only included data related to SB0162 type 31
strain. When including all Mycobacterium bovis isolates in the model, several risk factors 32
were identified: history of bovine tuberculosis in the herd (P < 0.001), proximity of an 33
outbreak (P < 0.001), cattle density (P < 0.001) and annual amplitude of mean middle-34
infrared temperature (P < 0.007). The approach restricted to the predominant SB0162 type 35
strain additionally highlighted the proportion of movements from an infected area during the 36
current year as a main risk factor (P = 0.007). This study identified several risk factors for 37
bovine tuberculosis in cattle, highlighted the usefulness of molecular typing in the study of 38
bovine tuberculosis epidemiology and suggests a difference of behaviour for the predominant 39
type strain. It also emphasizes the role of animals’ movements in the transmission of the 40
disease and supports the importance of controlling trade movements. 41
42
43
44
3 Introduction
46
Despite significant historical efforts and the implementation of eradication plans, bovine 47
tuberculosis (bTB) remains a preoccupant issue in the European Union, with some Member 48
States facing recently a re-emergence of the disease (10). Some countries succeeded in 49
biologically eradicating bTB after implementing control measures, while others, declared as 50
Officially Tuberculosis-Free (OTF), still notify outbreaks every year, despite ongoing 51
eradication and control programs (10). Belgium was declared OTF in 2003, yet, 5 to 10 52
outbreaks are notified every year (12). In 2008, an increase in the number of reported 53
outbreaks was noticed (12), as shown in Figure 1. 54
Numerous risk factors for bTB have been identified in cattle around the world. These risk 55
factors include a variety of parameters in relation to wildlife, cattle contacts, movements, 56
density of animals, etc. (reviewed in (20)) but number of studies lack standardization. 57
Furthermore, bTB transmission cycles underlying the failure to eradicate Mycobacterium 58
bovis (M. bovis) in cattle in some areas remain poorly understood, and several transmission 59
hypotheses have been formulated: inadequate control measures, agro-environmental factors, 60
latency, wildlife reservoirs and movements of infected animals (15). Partly because bTB 61
control programs are an economical burden, national animal health authorities are considering 62
downscaling current control measures, e.g. cancelling testing at purchase and reducing herd 63
testing. Nevertheless, animal movements were shown to be a risk factor in other countries 64
such as the United Kingdom (UK) (15, 16). Before applying these reductive measures, it 65
therefore seems appropriate to investigate the true risk represented by animal movements in 66
the country. 67
A database including all M. bovis isolates grown from outbreaks reported between 1995 and 68
2006 in Belgium was compiled. This database was instrumental in analyzing bTB dynamics 69
4 in Belgium during the 1995-2006 period. A full literature review for bTB risk factors allowed 70
identifying several potential risk factors to be tested in Belgium (20). A statistical model 71
initially developed on the basis of data collected in the UK (15) was then adapted to the 72
Belgian dataset in order to test these potential risk factors. 73
In addition, recent studies focusing on M. bovis strains isolated in cattle and badgers from the 74
UK confirmed the limited number of strains circulating in the UK, even though the bTB herd 75
prevalence is elevated (14, 38). On the other hand, the situation in Belgium is totally opposite: 76
there is a wide diversity of co-circulating strains, with one predominating, and the herd 77
prevalence is under 0.1% in the cattle population (12). It was thus decided to follow two 78
approaches: one including all strains isolated in the country during the period of interest (1995 79
– 2006), and the other one focusing on the predominant strain type, in order to possibly 80
highlight a difference in behaviour. 81
This molecular epidemiology approach, never carried out so far in Belgium, is valuable for 82
health authorities in order to re-assess and adapt current control measures applicable for the 83
surveillance of bTB and to challenge a possible reduction in herd and individual testing. 84
Materials and Methods 85
A. Database compilation
86
A literature review of bTB risk factors allowed the identification of several parameters to be 87
tested as possible risk factors. These parameters were called predictors. All predictors used 88
were derived from the databases described below. They were all compiled into a unique 89
database. The analysis of bTB dynamics was bi-dimensional. The temporal reference was the 90
year, and the spatial unit was defined as follows: the territory was divided into 5 km by 5 km 91
5 cells, identified thanks to their X and Y Lambert coordinates; these cells were named pixels 92
(http://users.skynet.be/belgique/belgica.zip). 93
A database of all M. bovis isolates grown from bTB suspect sampled organs, at the Belgian 94
national reference laboratory for bTB between the 1st of January 1995 and the 31st of 95
December 2006, was the starting point of the analysis. Sampling was performed at the 96
slaughterhouse when suspect lesions of bTB were observed, according to the European 97
legislation (11). Once the presence of M. bovis was confirmed, molecular typing tools allowed 98
to individually genotype each strain. Three techniques were used in parallel to identify the 99
strain type: spoligotyping, IS6110-RFLP (Restriction Fragment Length Polymorphism – 100
IS6110), and MIRU (Mycobacterial Interspersed Repetitive Unit) - VNTR (Variable-Number 101
Tandem-Repeat). These techniques have been widely used for the identification of M. bovis 102
strains (9, 31) and were combined in the study area (1), where IS6110-RFLP proves to 103
improve the discriminatory power of MIRU-VNTR, given that 48% of the area isolates 104
display 8 or more copies of IS6110 (1). Isolates found in Belgium between 1995 and 2006 105
have been previously classified into 12 lineages, according to their combined 106
RFLP/VNTR/spoligotype molecular profiles, which allowed to identify a specific strain type 107
characterised by its unique SB0162 spoligotype as being predominant. SB0162 was identified 108
in 27% (N = 112) of all isolates (N = 415) (following the international nomenclature 109
developed by www.Mbovis.org) (35). 110
Other databases were released by the Federal Agency for the Safety of the Food Chain 111
(FASFC): a complete list of all registered cattle herds of the country as well as the annual 112
census of all herds (the number of animals per herd, as defined on the 31st of December of 113
each year, data available from 2000 and after) were made available. Cattle movement data 114
6 that took place between 1995 and 2006 were extracted from the National Cattle Tracing 115
System (SANITEL). 116
The Nature and Forest Division (NFD) provided data for several wildlife species. Annual 117
estimated populations of red deer (Cervus elaphus), roe deer (Capreolus capreolus), wild boar 118
(Sus scrofa), fallow deer (Dama dama) and mouflons (Ovis orientalis) were included in the 119
model. 120
Land cover data were also part of the model. Different types of land cover were considered: 121
pasture, crops, forest, humid areas, urban areas and other vegetation. The length of forest-122
pasture edge was also available for analysis and was defined as a specific number of meters 123
per pixel: the more important the length of forest-pasture edge, the greater the risk of potential 124
contact was assumed between wildlife and cattle in pasture. 125
Remotely sensed data for several bioclimatic indicators were used as bioclimatic data. The 126
collection of these data has been previously described (19). Altitude was included in the 127
model as well. 128
B. Risk Predictors
129
Predictors were converted for each pixel, per year, to include biological, demographic, 130
climatic and topographic variables, such as distance to the centre of a bTB outbreak pixel, 131
densities of wildlife populations, eco-climatic data, land cover, movements and density of 132
cattle, all compiled and re-sampled at the 5 km resolution. 133
The predictor named ‘disease persistence’ (PBTB, antecedent of bTB) was included in the 134
model as follows: for each pixel, and for each year of the period, it was specified if bTB was 135
present or not. A note of 0 was allotted if no bTB outbreak had been registered in the pixel in 136
the previous year, while a note of 1 meant the presence of bTB in the pixel. 137
7 In case of the presence of bTB, M. bovis strain was specified. Cattle populations were 138
converted in order to include ‘density of cattle’ per pixel in the model. Data concerning wild 139
animal populations were originally available at the district level; they were further 140
transformed and converted to be available at the pixel level under the name ‘density of wild 141
species’. Regarding land cover predictors, data included in the model were the percentage of 142
occupation within the pixel for the different types of vegetation. 143
Raw data extracted from the National Cattle Tracing System (SANITEL) were preliminarily 144
transformed before inclusion in the model, as follows. Each movement was referenced with 145
two data: the first data was the pixel of location from which the animal moved (pixel off) and 146
the other one for the pixel of location to which the animal moved (pixel on). Both data had to 147
be paired and were coupled to three variables: the total number of cattle head movements into 148
a pixel, the total number of movements from an outbreak pixel, and the resulting proportion of 149
movements that originated from outbreak pixels. These three variables were added to the 150
model. Movement data were then analyzed in two ways. First we investigated the impact of 151
movements that were registered the year before the eventual occurrence of bTB in a given 152
pixel. Second, we assessed the impact of movements taking place during the year of 153
occurrence of bTB outbreaks in a given pixel. A total of 49 predictors were considered, as 154
summarized in Appendix 1. 155
C. Statistical analyses
156
A stepwise multiple logistic regression analysis was applied to data in order to investigate the 157
potential association between bTB occurrence and the predictors. This model was originally 158
created by Gilbert and collaborators to assess the importance of animal movements in the 159
transmission of bTB in Great Britain (15); this model was further adapted to the peculiar 160
situation of the study area and to include the molecular biology aspect. A unique multi-annual 161
8 database including all the information regarding the 49 predictors per pixel and per year was 162
built. For each year and each pixel, the absence or presence of bTB was specified. First, the 163
following predictors were entered in the model: PBTB (status of bTB in the previous year) 164
and short-distance spread (number of infected pixels in the previous year in a doughnut-165
shaped window 5 km in radius). These two predictors were shown to have a significant 166
impact on the presence of bTB in the pixel. Then other variables were added to the model 167
using a standard-entry stepwise procedure. The model was restricted to predictors with the 168
highest predictive power, and only those presenting more than 1% of log-likelihood change 169
after removal were retained. In other words, these best predictors were systematically tested 170
with the others families of predictors. Finally, all the predictors showing a significant effect 171
were tested together. The 49 predictors could not be entered all-together in the model at the 172
same time because some of them were correlated (altitude, densities of wild species and 173
forests surfaces), any significant effect could thus have been masked. A predictor was 174
considered as being a significant risk factor when presenting a positive or a negative 175
relationship with the presence of bTB (P<0.05). 176
The model was applied in two stages. The first stage included all M. bovis strains identified in 177
Belgium during the period of concern. The second stage focused on the predominating type 178
strains (SB0162), isolated in the country between 1995 and 2006 (35). 179
The whole statistical process was carried out with R software (29). 180
Results 181
A. All Mycobacterium bovis strains
182
The predictors presenting a significant relationship from the analysis of all bTB isolates (N = 183
415) are summarized in Table I. Two predictors were positively and significantly related to 184
9 the presence of bTB in a pixel: persistence of bTB (PBTB) and cattle density (BOV03). The 185
proximity with the centre of an infected pixel (Logtb5km) showed a negative relationship 186
with bTB, which means the closer a herd was from the centre of an infected pixel, the greater 187
the risk of being infected. These three predictors exhibiting the highest level of significance 188
were tested with each of the other families of predictors (movements, wildlife, bio-climatic 189
and land cover) in a backward selection approach. At each step, the variable with the lowest 190
Wald statistics value was discarded. Finally, all predictors presenting a significant relationship 191
with the presence of bTB were kept. Red deer and roe deer densities presented a significantly 192
negative relationship with the presence of bTB, as well as forest density per pixel, which 193
would suggest that, to date, no wildlife reservoir of bTB exists in Belgium. 194
The backward selection approach involving bio-climatic predictors as well as altitude 195
revealed that annual amplitude of mean middle-infrared (MIR) temperature presented a 196
positive relationship with the presence of bTB. On the other hand, the bi-annual amplitude of 197
mean MIR temperature, the normalized difference vegetation index (NDVI) phase of annual 198
cycle and altitude showed a negative relationship with the risk of bTB. 199
Once all the families of predictors had been tested separately with the three best predictors, 200
the variables presenting a significant effect were all tested together, as illustrated in table II. 201
Some predictors then lost their significant effect mostly because of co-linearity: red deer and 202
roe deer densities, percentage of forest cover per pixel and altitude. 203
B. Predominant Mycobacterium bovis spoligotype (SB0162)
204
Only M. bovis isolates characterized as SB0162 strain types were included in the second step 205
of the model (N = 112). All results of this approach are presented in Table III. Persistence of 206
bTB (PBTB) presented a positive significant relationship, while cattle density showed no 207
relationship with the presence of bTB. The distance to the centre of an infected pixel 208
10 (Logtb5km) showed a negative relationship with bTB. Only these two variables were thus 209
tested with the other families of predictors (backward selection method). The proportion of 210
movements originating from infected pixels during the current year presented a significant 211
relationship with the presence of bTB, as well as crop surface. Regarding bio-climatic 212
variables, the annual amplitude of MIR temperature presented a significant effect on the risk 213
of bTB occurrence. As when all M. bovis strains were included in the model, the bi-annual 214
amplitude of mean MIR temperature, and the NDVI phase of annual cycle showed a 215
significant negative relationship with the risk of bTB (Table III). 216
After testing all the families of predictors separately, a model including all variables 217
significantly related to the presence of bTB was tested. As for the all M. bovis strains-218
approach, several predictors lost their significant effect. The only predictors showing a 219
significant relationship were then the proportion of movements originating from infected 220
pixels during the current year (positive relationship) and the bi-annual amplitude of mean 221
MIR temperature (Table IV) (negative relationship). 222
Discussion 223
The model allowed to highlight several factors correlated with the presence of bTB 224
nationwide (e.g., Belgium) and is the first study of that kind. A first approach considered all 225
the strains isolated between 1995 and 2006, while a second approach focused on the 226
predominant strain type characterised by its SB0162 spoligotype, most frequently isolated in 227
Belgium over the past 13 years (35). 228
A history of bTB in a given pixel was shown to represent a significant risk factor for the 229
presence of bTB, both in the all-inclusive and predominant strain-restricted approaches. This 230
observation confirms the results of previous studies carried out in other countries. Indeed, 231
11 British groups demonstrated that bTB outbreaks occur in a repeated way in the same areas 232
(36). It is likely that the source of infection has not been cleared and/or that permanent factors 233
would make these areas particularly prone to the re-emergence of bTB. 234
The proximity of an infected pixel turned out to be a significant risk factor for bTB as well. 235
The greater the distance to the centre of an infected pixel is, the lower the risk of infection. 236
This was previously observed in the Republic of Ireland (18). In their study, Griffin and 237
collaborators demonstrated that, in a short period of time, bTB outbreaks affect most 238
frequently several herds at the same time rather than a sole herd, because the contiguity with 239
other herds under restriction was a risk factor. Another study carried out in the same country 240
and including 215 dairy herds showed the neighbouring with an infected herd was associated 241
with an outbreak in a particular herd. Nevertheless, a bTB infection confirmed in adjacent 242
herds could point to a common source of infection (8). North American scientists highlighted 243
the importance of contacts between animals over fences as a particular risk factor for the 244
transmission of M. bovis between infected and healthy animals (22, 25). Thus, the results 245
observed in a low prevalence situation seem to confirm what was observed in areas where 246
bTB prevalence is high. 247
Density of cattle is a significant risk factor for bTB in Belgium. In our study, this predictor 248
was identified as a significant risk factor in the first approach, including all M. bovis isolates, 249
but not when the statistical model was applied to SB0162 only. Intensive farming is a risk by 250
itself because of the closer proximity of animals and thus increased contacts and interactions 251
between them. Airborne transmission is indeed the principle route of infection in cattle (13). 252
The higher the density of animals, the higher the probability of close contacts between them. 253
The highest incidence of bTB is generally observed in areas where intensive farming is 254
practiced (5). The trends in dairy cattle are going towards intensification in industrialized 255
12 countries, which means fewer, much bigger herds, and as a result, increased contacts between 256
animals and an increasing risk of bTB transmission (34). Under intensive conditions, 257
aerogenic transmission of M. bovis prevails (23). 258
Contrarily to what has been observed elsewhere, animal movements from an outbreak to 259
another herd were not shown to be a significant risk factor when all M. bovis strains were 260
included in the statistical model. The low rate of outbreaks observed every year did not permit 261
to highlight this risk factor in the country, contrarily to the studies carried out by Gilbert and 262
collaborators in Great Britain (15). On the other hand, it is difficult to determine whether the 263
differences between both countries can be explained by differences in the control of cattle 264
movements or by the level of prevalence. A study focusing on the analysis of cattle 265
movements between 1985 and 2003 in the UK relied on molecular typing to identify most 266
outbreaks reported in the North-East of England between 2002 and 2004 (16). Animal 267
movements had a major impact if animals were moved from a bTB endemic zone to a bTB 268
free-area. The second approach including predominating strain type SB0162 identified the 269
proportion of movements from infected pixels during the current year as a significant risk 270
factor. 271
Several wild species play an important role in the transmission of M. bovis to cattle. It is the 272
case for badgers in the United Kingdom and in the Republic of Ireland (4, 8, 17) and for 273
brush-tail possums in New Zealand (24). Deer infected with M. bovis were discovered in 274
North America (22), in the UK (6, 7), in the Republic of Ireland (28), in Spain (2) and in 275
France (40). M. bovis has frequently been isolated in wild boar in Western Europe, especially 276
in France, Spain and Italy (26, 32, 40). Even when M. bovis is not yet isolated from wildlife, 277
this risk must not be dismissed. The influence of wildlife densities on the emergence of bTB 278
outbreaks in Belgium was thus tested. In our study, nevertheless, no relationship could be 279
13 observed between the densities of the main wild species tested (roe deer, red deer, wild boar 280
and incidentally fallow deer and mouflons, mainly present in Belgium parks and domestic 281
herds), and the presence of bTB suggesting once more they do not represent a risk for cattle 282
contamination as M. bovis is probably not circulating in wildlife species to date. On the other 283
hand, the presence of bTB presented a negative relationship with wildlife population 284
densities, and the same effect was observed for land covered by forests. It is most likely that 285
both observations are linked, as these two variables correlate. One should recall that data on 286
wildlife species were only available for relatively large administrative units, hence the lack of 287
apparent statistically significant relationship could be caused by the lack of high resolution 288
data, and those results should be interpreted cautiously. 289
The analysis of the SB0162 type strain data identified the proportion of a pixel occupied by 290
crops as a significant risk factor. A hypothesis to explain this observation could be that farms 291
are concentrated around culture areas, for the supply in fodder. 292
Several bio-climatic factors happened to appear as significant risk factors for the emergence 293
of bTB. The annual amplitude of temperature on the earth surface would be a risk factor, as 294
shown in both approaches (all strains vs. predominating strain). Climate indeed influences the 295
survival of M. bovis in the environment (27). The environmental survival of M. bovis would 296
be inversely proportional to mean daily temperatures, as suggested previously in New Zealand 297
(21). Temperatures just above 0°C coupled with a strong hygrometry are in favour of M. bovis 298
survival (3). Tanner and Michel also observed a longer survival of M. bovis in faeces in the 299
winter and under moist conditions, in the Kruger National Park, South Africa (33). 300
Nevertheless, scientific opinions diverge regarding the importance the environment plays in 301
the survival of M. bovis, as well as all the survival times suggested by the different studies 302
that focused on this aspect. Some authors suggest the survival times of infective doses of M. 303
14 bovis on fomites are relatively short under natural conditions (24). Older studies described 304
longer survival times: M. bovis mixed artificially with cow faeces and exposed on pasture 305
land survived at least 35 weeks in the winter, 28 weeks in autumn, and up to 14 weeks in the 306
summer, in southern England (Williams and Hoy, 1930, cited by (41)). In northern Europe, 307
M. bovis mixed with organic matter survived 22-47 weeks when exposed to sunlight at 24-308
34°C, but up to 104 weeks if buried 5 cm below the surface of shaded soil (Genov, 1965, 309
cited by (41)). More recently, Young and collaborators suggested M. bovis BCG remains 310
viable in soil for more than 15 months (39). Many studies focusing on survival times of M. 311
bovis in the environment reached their conclusions under experimental conditions. In 1997, 312
scientists who worked on data collected in England and Wales suggested that bTB occurrence 313
was linked to the seasonality and to climatic changes from one year to another (37). It is 314
constantly reported that temperatures just above 0°C and a strong hygrometry are in favour of 315
M. bovis survival, and these conditions are frequent in North-Western Europe in the 316
wintertime. The potential impact of climate change on M. bovis survival and on the 317
occurrence of bTB outbreaks should gain further attention, as scientific opinions still diverge 318
to date. Scientists from the UK recently evoked the potential role of free-living protozoa as an 319
environmental reservoir of M. bovis, which could contribute to the environmental persistence 320
of the mycobacteria (30). This possibility should not be neglected either. 321
The risk of bTB seems to decrease as altitude increases. The highest areas of the country are 322
located in the South and East of Belgium, regions where few or even no outbreaks were 323
reported to date. This trend could be put in relation with forests, mostly located in the same 324
regions. 325
This is the first nationwide study analyzing bTB risk factors combining three typing 326
techniques. The statistical analysis of relationships between bTB outbreaks and M. bovis 327
15 strain types allowed the identification of some risk factors: antecedents of bTB in a herd or in 328
a small area, the proximity with an outbreak and cattle density. These observations should 329
pave the way to an increased vigilance in matter of epidemiological investigations and 330
eradication of ongoing outbreaks. Animal movements from infected areas were shown to be at 331
risk for the predominant M. bovis SB0162 strain type circulating in Belgium, it is thus 332
essential not to slacken vigilance in the control of movements and skin testing at purchase. 333
Wildlife does not seem to represent a risk in Belgium to date, but the epidemiological 334
surveillance is crucial within sight of the situation in neighbouring countries such as France or 335
the UK. Studies focusing more specifically on the role of environment and climate in the 336
persistence of M. bovis should be undertaken as well. In addition, the results of this study also 337
suggest a difference of behaviour for the SB0162 type strains, underlying the importance of 338
molecular epidemiology to investigate potential differences of virulence according to the 339
strain. 340
Acknowledgements 341
This work was supported by the Federal Public Service of Health, Food Chain Safety and 342
Environment (contract RF 6182). 343
We would like to thank, for their collaboration, the veterinary officers from the different 344
Belgian provincial units of control (FASFC) as well as the veterinarians in charge of the 345
slaughterhouses visited for collecting bTB data. We also thank Mr Jean-Marie Robijns 346
(FASFC), Mrs Valérie Duran and Mr Jim Casaer (Nature and Forest Division) for providing 347
some of the databases included in the model. 348
References 349
16 1. Allix, C., Walravens, K., Saegerman, C., Godfroid, J., Supply, P., Fauville-Dufaux, M. 350
2006. Evaluation of the epidemiological relevance of variable-number tandem-repeat 351
genotyping of Mycobacterium bovis and comparison of the method with IS6110 restriction 352
fragment length polymorphism analysis and spoligotyping. J. Clin. Microbiol. 44:1951– 353
1962. 354
2. Aranaz, A., Lichana, E., Mateos, A., Dominguez, L., Vidal, D.K., Domingo, M., 355
Gonzolez, O., Rodriguez-Ferri, E.F., Bunschoten, A.E., Van Embden, J.D., Cousins, 356
D. 1996. Spacer oligonucleotide typing of Mycobacterium bovis strains from cattle and 357
other animals: a tool for studying epidemiology of tuberculosis. J. Clin. Microbiol. 358
34:2734–2740. 359
3. Artois, M., Loukiadis, E., Garin-Bastuji, B., Thorel, M.F., Hars, J. 2004. Infection of 360
wild mammals by Mycobacterium bovis – Risk of transmission to domestic cattle (in 361
French). Epidemiol. Bull. Fr. Food Safety Agency. 13:1–3. 362
4. Cheeseman, C.L., Wilesmith, J.W., Stuart, F.A., Mallinson, P.J. 1988. Dynamics of 363
tuberculosis in a naturally infected badger population. Mammal. Rev. 18:16–71. 364
5. Cosivi, O., Grange, J.M., Daborn, C.J., Raviglione, M.C., Fujikura, T., Cousins, D., 365
Robinson, R.A., Huchzermeyer, H.F.A.K., de Kantor, I., Meslin, F.X. 1998. Zoonotic 366
tuberculosis due to Mycobacterium bovis in developing countries. Emer. Infect. Dis. 4:59– 367
70. 368
6. Delahay, R.J., Cheeseman, C.L., Clifton-Hadley, R.S. 2001. Wildlife disease reservoirs: 369
the epidemiology of Mycobacterium bovis infection in the European badger (Meles meles) 370
and other British mammals. Tuber. Lung Dis. 81:1–7. 371
17 7. Delahay, R.J., De Leeuw, A.N., Barlow, A.M., Clifton-Hadley, R.S., Cheeseman, C.L. 372
2002. The status of Mycobacterium bovis infection in UK wild mammals: a review. Vet. J. 373
164: 90–105. 374
8. Denny, G.O., Wilesmith, J.W. 1999. Bovine tuberculosis in Northern Ireland: a case-375
control study of herd risk factors. Vet. Rec. 144:305–310. 376
9. Durr, P.A., Clifton-Hadley, R.S., Hewinson, R.G. 2000. Molecular epidemiology of 377
bovine tuberculosis. II. Applications of genotyping. Rev. Sci. Tech. 19:689–701. 378
10. European Food Safety Authority. 2006a. The community summary report on trends and 379
sources of zoonoses, zoonotic agents, antimicrobial resistance and foodborne outbreaks in 380
the European Union in 2005. EFSA J. 94:136–143. 381
http://www.efsa.europa.eu/EFSA/DocumentSet/Zoonoses_Report_EU_en_2005.pdf. 382
11. European Food Safety Authority. 2006b. Zoonoses country reports – 2006. 383
http://www.efsa.europa.eu/EFSA/efsa_locale-1178620753816_1178676772406.htm. 384
12. Federal Agency for the Safety of the Food Chain. 2008. Annual Activity Report – 2008 385
p.130. http://www.favv-afsca.fgov.be/rapportsannuels/_documents/2009-07-386
07_RA08_fr.pdf. 387
13. Gannon, B.W., Hayes, C.M., Roe, J.M. 2007. Survival rate of airborne Mycobacterium 388
bovis. Res. Vet. Sci. 82:169–72. 389
14. Garcia Pelayo, M.C., Uplekar, S., Keniry, A., Mendoza Lopez, P., Garnier, T., Nunez 390
Garcia, J., Boschiroli, L., Zhou, X., Parkhill, J., Smith, N., Hewinson, R.G., Cole, S.T., 391
Gordon, S.V. 2009. A comprehensive survey of single nucleotide polymorphisms (SNPs) 392
across Mycobacterium bovis strains and M. bovis BCG vaccine strains refines the 393
18 genealogy and defines a minimal set of SNPs that separate virulent M. bovis strains and M. 394
bovis BCB strains. Infect. Immun. 77:2230–38. 395
15. Gilbert, M., Mitchell, A., Bourn, D., Mawdsley, J., Clifton-Hadley, R., Wint, W. 396
2005. Cattle movements and bovine tuberculosis in Great Britain. Nature 435:491–6. 397
16. Gopal, R., Goodchild, A., Hewinson, G., De la Rua-Domenech, R., Clifton-Hadley, R. 398
2006. Introduction of bovine tuberculosis to north-east England by bought- in cattle. Vet. 399
Rec. 159:265–271. 400
17. Griffin, J.M., Hahesy, T., Lynch, K., Salman, M.D., McCarthy, J., Hurley, T. 1993. 401
The association of cattle husbandry characteristics, environmental factors and farmer 402
characteristics with the occurrence of chronic bovine tuberculosis in dairy herds in the 403
Republic of Ireland. Prev. Vet. Med. 17:145–160. 404
18. Griffin, J.M., Martin, S.W., Thorburn, M.A., Eves, J.A., Hammond, R.F. 1996. A 405
case-control study on the association of selected risk factors with the occurrence of 406
bovine tuberculosis in the Republic of Ireland. Prev. Vet. Med. 27:75–87. 407
19. Hay, S.I., Tatem, A.J., Graham, A.J., Goetz, S.J., Rogers, D.J. 2006. Global 408
environmental data for mapping infectious disease distribution. Adv. Parasitol. 62:37–77. 409
20. Humblet, M.F., Boschiroli, M.L., Saegerman, C. 2009. Classification of worldwide 410
bovine tuberculosis risk factors in cattle: a stratified approach. Vet. Res. 40:50. 411
21. Jackson, R., De Lisle, G.W., Morris, R.S. 1995. A study of the environmental survival 412
of Mycobacterium bovis on a farm in New Zealand. N. Z. Vet. J. 43:346–352. 413
19 22. Kaneene, J.B., Bruning-Fann, C.S., Granger, L.M., Miller, R., Porter-Spalding, A. 414
2002. Environmental and farm management factors associated with tuberculosis on cattle 415
farms in northeastern Michigan. JAVMA 221:837–842. 416
23. Menzies, F.D., Neill, S.D. 2000. Cattle-to-cattle transmission of bovine tuberculosis. Vet. 417
J. 160:92–106. 418
24. Morris, R.S., Pfeiffer, D.U., Jackson, R. 1994. The epidemiology of Mycobacterium 419
bovis infections. Vet. Microbiol. 40:153–177. 420
25. Munroe, F.A., Dohoo, I.R., McNab, W.B., Spangler, L. 1999. Risk factors for the 421
between-herd spread of Mycobacterium bovis in Canadian cattle and cervids between 422
1985 and 1994. Prev. Vet. Med. 41:119–133. 423
26. Parra, A., Fernández-Llario, P., Tato, A., Larrasa, J., García, A., Alonso, J.M., 424
Hermoso de Mendoza, M., Hermoso de Mendoza, J. 2003. Epidemiology of 425
Mycobacterium bovis infections of pigs and wild boar using a molecular approach. Vet. 426
Microbiol. 97:123–133. 427
27. Phillips, C.J.C., Foster, C.R.W., Morris, P.A., Teverson, R. 2003. The transmission of 428
Mycobacterium bovis infection in cattle. Res. Vet. Sci. 74:1–15. 429
28. Quigley, F.C., Costello, E., Flynn, O., Gogarty, A., McGuirk, J., Murphy, A., Egan, 430
J. 1997. Isolation of myco-bacteria from lymph node lesions in deer. Vet. Rec. 141:516– 431
518. 432
29. R Development Core Team. R: A language and environment for statistical computing. R 433
Foundation for Statistical Computing, Vienna, Austria. ISBN 3-90005-07-0. 434
http://www.R-project.org 435
20 30. Rhodes, S.G., De Leij, F.A.A.M., Dale, J.W. 2007. Protozoa as an environmental 436
reservoir of bovine tuberculosis. Trends Microbiol. 15:338–339. 437
31. Roring, S., Hugues, M.S., Skuce, R.A., Neill, S.D. 2000. Simultaneous detection and 438
strain differentiation of Mycobacterium bovis directly from bovine tissue specimens by 439
spoligotyping. Vet. Microbiol. 74: 227–36. 440
32. Serraino, A., Marchetti, G., Sanguinetti, V., Rossi, M.C., Zanoni, R.G., Catozzi, L., 441
Bandera, A., Dini, W., Mignone, W., Franzetti, F., Gori, A. 1999. Monitoring of
442
transmission of tuberculosis between wild boars and cattle: genotypical analysis of strains 443
by molecular epidemiology technique. J. Clin. Microbiol. 37:2766–2771. 444
33. Tanner, M., Michel, A.L. 1999. Investigation of the viability of M. bovis under different 445
environmental conditions in the Kruger National Park. Ondersteppoort J. Vet. Res. 446
66:185–190. 447
34. Thoen, C., LoBue, P., de Kantor, I. 2006. The importance of Mycobacterium bovis as a 448
zoonosis. Vet. Microbiol. 112:339–345. 449
35. Walravens, K., Allix, C., Supply, P., Rigouts, L., Godfroid, J., Govaerts, M., Portaels, 450
F., Dufey, J., Vanholme, L., Fauville-Dufaux, M., Saegerman, C. 2006. Ten years of 451
bovine tuberculosis molecular epidemiology in Belgium. Epidemiol. Santé Anim. 49:103– 452
111. 453
36. White, P.C.L., Benhin, J.K.A. 2004. Factors influencing the incidence and scale of 454
bovine tuberculosis in cattle in southwest England. Prev. Vet. Med. 63:1–7. 455
37. Wint, G.R.W., Robinson, T.P., Bourn, D.M., Durr, P.A., Hay, S.I., Randolph, S.E., 456
Rogers, D.J. 2002. Mapping bovine tuberculosis in Great Britain using environmental 457
data. Trends Microbiol. 10:441–444. 458
21 38. Woodroffe, R., Donnelly, C.A., Cox, D.R., Gilks, P., Jenkins, H.E., Johnston, W.T., 459
Le Fevre, A.M., Bourne, F.J., Cheeseman, C.L., Clifton-Hadley, R.S., Gettinby, G., 460
Hewinson, R.G., McInerney, J.P., Mitchell, A.P., Morrison, W.I., Watkins, G.H. 461
2009. Bovine tuberculosis in cattle and badgers in localized culling areas. J. Wildl. Dis. 462
45:128–143. 463
39. Young, J.S., Gormley, E., Wellington, E.M.H. 2005. Molecular detection of 464
Mycobacterium bovis and Mycobacterium bovis BCG (Pasteur) in soil. Appl. Environ. 465
Microbiol. 71:1946-52. 466
40. Zanella, G., Durand, B., Hars, J., Moutou, F., Garin-Bastuji, B., Duvauchelle, A., 467
Fermé, M., Karoui, C., Boschiroli, M.L. 2008. Mycobacterium bovis in wildlife in 468
France. J. Wildl. Dis. 44:99–108. 469
41. Zendejas-Martínez, H., Townsend Peterson, A., Milián-Suazo, F. 2008. Coarse-scale 470
spatial and ecological analysis of tuberculosis in cattle: an investigation in Jalisco, 471
Mexico. Geospat. Health 3:29–38. 472
Figure 1
Trends followed by the number of bTB outbreaks (N) in Belgium between 1995 and 2009, as reported to the World Animal Health Organization; adapted from (12). The situation worsened in 2008 as the number of outbreaks almost tripled compared to the year 2007. 0 5 10 15 20 25 30 35 40 45 50 1996 1997 1998 1999 2000 2001 2002 2003 2004 2005 2006 2007 2008 2009 N Year
* = P<0.05, ** = P<0.01 et *** = P<0.001; PBTB = presence of bTB the previous year; Logtb5km = logarithm of the distance to the centre of the infected pixel ; BOV03 = density of cattle in 2003; Roe deer = density per pixel; Red Deer = density per pixel; FORkm2 = surface of the pixel occupied by forests; CH0107A1 = Land surface temperature annual amplitude (°C); CH0107A2 = Land surface temperature bi-annual amplitude (°C); CH0114P1= Normalized difference vegetation index phase of annual cycle; DTM = altitude (m)
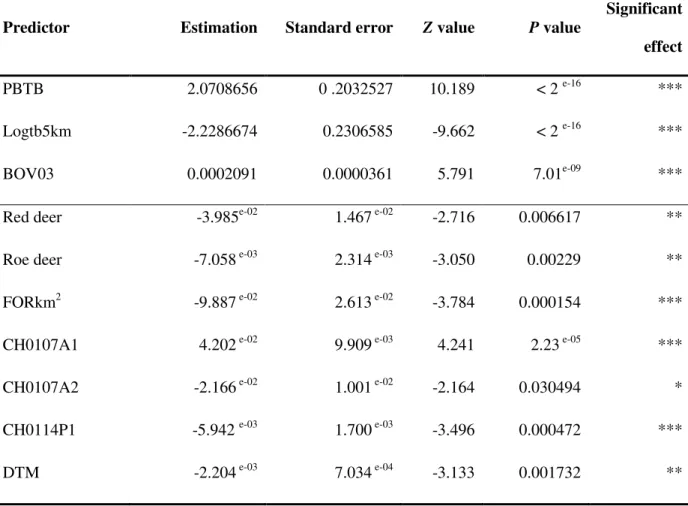
Table I: Summary of statistics for the predictors presenting a significant relationship with the
occurrence of bTB (all isolates) – Multivariate analysis: backward selection approach
Predictor Estimation Standard error Z value P value
Significant effect
PBTB 2.0708656 0 .2032527 10.189 < 2 e-16 ***
Logtb5km -2.2286674 0.2306585 -9.662 < 2 e-16 ***
BOV03 0.0002091 0.0000361 5.791 7.01e-09 ***
Red deer -3.985e-02 1.467 e-02 -2.716 0.006617 **
Roe deer -7.058 e-03 2.314 e-03 -3.050 0.00229 **
FORkm2 -9.887 e-02 2.613 e-02 -3.784 0.000154 ***
CH0107A1 4.202 e-02 9.909 e-03 4.241 2.23 e-05 ***
CH0107A2 -2.166 e-02 1.001 e-02 -2.164 0.030494 *
CH0114P1 -5.942 e-03 1.700 e-03 -3.496 0.000472 ***
* = P<0.05, ** = P<0.01 et *** = P<0.001; PBTB = presence of bTB the previous year; Logtb5km = logarithm of the distance to the centre of the infected pixel ; BOV03 = density of cattle in 2003; Roe deer = density per pixel; Red Deer = density per pixel; FORkm2 = surface of the pixel occupied by forests; CH0107A1 = Land surface temperature annual amplitude (°C); CH0107A2 = Land surface temperature bi-annual amplitude (°C); CH0114P1 = Normalized difference vegetation index phase of annual cycle; DTM = altitude (m)
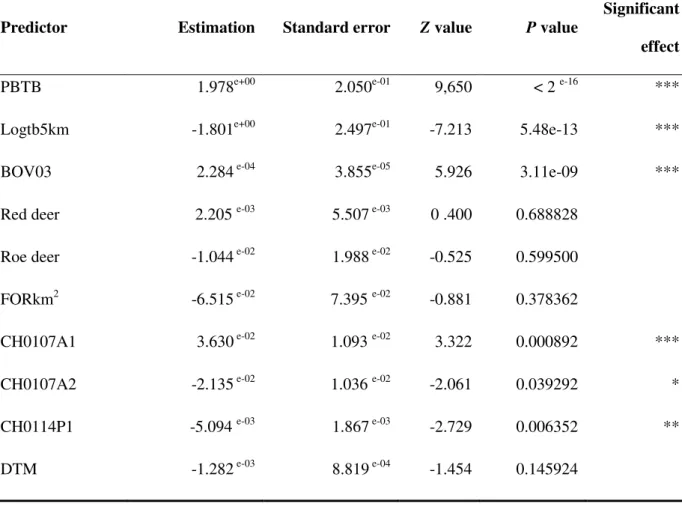
Table II: Summary of statistics for the predictors presenting a significant relationship with the
occurrence of bTB (all isolates) - Multivariate analysis – significant predictors tested together
Predictor Estimation Standard error Z value P value
Significant effect
PBTB 1.978e+00 2.050e-01 9,650 < 2 e-16 ***
Logtb5km -1.801e+00 2.497e-01 -7.213 5.48e-13 ***
BOV03 2.284 e-04 3.855e-05 5.926 3.11e-09 ***
Red deer 2.205 e-03 5.507 e-03 0 .400 0.688828
Roe deer -1.044 e-02 1.988 e-02 -0.525 0.599500
FORkm2 -6.515 e-02 7.395 e-02 -0.881 0.378362
CH0107A1 3.630 e-02 1.093 e-02 3.322 0.000892 ***
CH0107A2 -2.135 e-02 1.036 e-02 -2.061 0.039292 *
CH0114P1 -5.094 e-03 1.867 e-03 -2.729 0.006352 **
* = P<0.05, ** = P<0.01 et *** = P<0.001; PBTB = presence of bTB during the previous year; Logtb5kmNoI = logarithm of the distance to the centre of the infected pixel ; qNB = proportion of movements from infected pixels that took place during the current year; Roe deer density = density per pixel; CROPkm2 = surface of the pixel occupied by crops; CH0107A1 = Land surface temperature annual amplitude (°C); CH0107A2 = Land surface temperature bi-annual amplitude (°C); CH0114P1 = Normalized difference vegetation index phase of annual cycle.
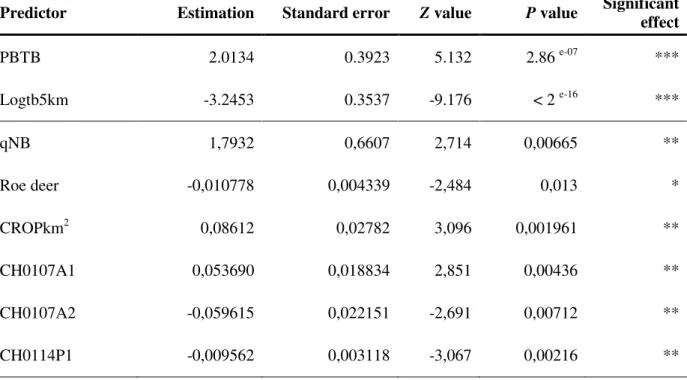
Table III: Summary of statistics for the predictors presenting a significant relationship with the occurrence of bTB (SB0162 type strains) – Multivariate analysis: backward selection approach
Predictor Estimation Standard error Z value P value Significant effect
PBTB 2.0134 0.3923 5.132 2.86 e-07 *** Logtb5km -3.2453 0.3537 -9.176 < 2 e-16 *** qNB 1,7932 0,6607 2,714 0,00665 ** Roe deer -0,010778 0,004339 -2,484 0,013 * CROPkm2 0,08612 0,02782 3,096 0,001961 ** CH0107A1 0,053690 0,018834 2,851 0,00436 ** CH0107A2 -0,059615 0,022151 -2,691 0,00712 ** CH0114P1 -0,009562 0,003118 -3,067 0,00216 **
* = P<0.05, ** = P<0.01 et *** = P<0.001; PBTB = presence of bTB during the previous year; Logtb5km = logarithm of the distance to the centre of the infected pixel ; qNB = proportion of movements from infected pixels that took place during the current year; Roe deer = density per pixel; CROPkm2 = surface of the pixel occupied by crops; CH0107A1 = Land surface temperature annual amplitude (°C); CH0107A2 = Land surface temperature bi-annual amplitude (°C); CH0114P1 = Normalized difference vegetation index phase of bi-annual cycle.
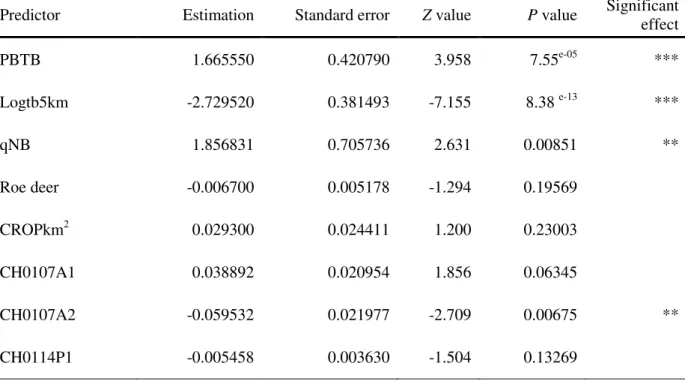
Table IV: Summary of statistics for the predictors presenting a significant relationship with the occurrence of bTB (SB0162 type strains) - Multivariate analysis: significant predictors tested together
Predictor Estimation Standard error Z value P value Significant effect
PBTB 1.665550 0.420790 3.958 7.55e-05 *** Logtb5km -2.729520 0.381493 -7.155 8.38 e-13 *** qNB 1.856831 0.705736 2.631 0.00851 ** Roe deer -0.006700 0.005178 -1.294 0.19569 CROPkm2 0.029300 0.024411 1.200 0.23003 CH0107A1 0.038892 0.020954 1.856 0.06345 CH0107A2 -0.059532 0.021977 -2.709 0.00675 ** CH0114P1 -0.005458 0.003630 -1.504 0.13269