arXiv:1007.2497v1 [astro-ph.EP] 15 Jul 2010
July 16, 2010
Transiting exoplanets from the CoRoT space mission
⋆
XII. CoRoT-12b: a short-period low-density planet transiting a solar analog star
M. Gillon
1, A. Hatzes
2, Sz. Csizmadia
3, M. Fridlund
4, M. Deleuil
5, S. Aigrain
6, R. Alonso
7, M. Auvergne
8, A.
Baglin
8, P. Barge
5, S. I. Barnes
9, A. S. Bonomo
5, P. Bord´e
10, F. Bouchy
11,12, H. Bruntt
8, J. Cabrera
3,13, L. Carone
14, S.
Carpano
4, W. D. Cochran
15, H. J. Deeg
16, R. Dvorak
17, M. Endl
15, A. Erikson
3, S. Ferraz-Mello
18, D. Gandolfi
4, J. C.
Gazzano
5, E. Guenther
2, T. Guillot
19, M. Havel
19, G. H´ebrard
12, L. Jorda
5, A. L´eger
10, A. Llebaria
10, H. Lammer
20, C.
Lovis
7, M. Mayor
7, T. Mazeh
21, J. Montalb´an
1, C. Moutou
5, A. Ofir
21, M. Ollivier
10, M. P¨atzold
14, F. Pepe
7, D.
Queloz
7, H. Rauer
3,22, D. Rouan
5, B. Samuel
10, A. Santerne
5, J. Schneider
13, B. Tingley
16, S. Udry
7, J. Weingrill
20,
and G. Wuchterl
2(Affiliations can be found after the references) Received date / accepted date
ABSTRACT
We report the discovery by the CoRoT satellite of a new transiting giant planet in a 2.83 days orbit about a V=15.5 solar analog star (M∗ =
1.08 ± 0.08 M⊙, R∗= 1.1 ± 0.1 R⊙, Teff= 5675 ± 80 K). This new planet, CoRoT-12b, has a mass of 0.92 ± 0.07 MJupand a radius of 1.44 ± 0.13
RJup. Its low density can be explained by standard models for irradiated planets.
Key words.stars: planetary systems - star: individual: CoRoT-12 - techniques: photometric - techniques: radial velocities - techniques: spectro-scopic
1. Introduction
Because of their special geometric configuration, a wealth of in-formation can be learned about transiting extrasolar planets (e.g., Winn 2010), making them very important for our understand-ing of the vast planetary population hosted by our galaxy. They are the only exoplanets for which accurate measurements of the mass and radius are available. Furthermore, their atmospheric properties can be studied during their transits and occultations (e.g., Deming & Seager 2009).
More than 70 extrasolar planets transiting their parent stars are now known1, most of which having been discovered by dedicated photometric surveys. Among these, the CoRoT (Convection, ROtation, and planetary Transits) space mission (Baglin et al. 2009) stands out as a pionner project. Because of its excellent instrumental capabilities and its low Earth or-bit, CoRoT can monitor the same fields of view with a very high photometric precision for up to five months. This makes possible the detection of planets that would be out of reach for ground-based surveys, as demonstrated for instance by its discovery of the first transiting ‘Super-Earth’ CoRoT-7b (L´eger et al. 2009; Queloz et al. 2009), and the first ‘temperate’ transiting gaseous planet CoRoT-9b (Deeg et al. 2010).
We report here the discovery of a new planet by CoRoT, a ‘hot Jupiter’ called CoRoT-12b that transits a mV = 15.5
so-Send offprint requests to: [email protected]
⋆ The CoRoT space mission, launched on December 27, 2006, has
been developed and is operated by CNES, with the contribution of Austria, Belgium, Brazil , ESA (RSSD and Science Program), Germany and Spain.
1 See, e.g., Jean Schneider’s Extrasolar Planet Encyclopedia at
http://exoplanet.eu
lar analog star. We present the CoRoT discovery photometry in Sec. 2. The follow-up, ground-based observations establishing the planetary nature of CoRoT-12b are presented in Sec. 3, while the spectroscopic determination of the parameters of the host star is described in Sec. 4. A global Bayesian analysis of the CoRoT and follow-up data is presented with its results in Sec. 5. Finally, we discuss the inferred properties of the CoRoT-12 system in Sec. 6.
2. CoRoT photometric observations
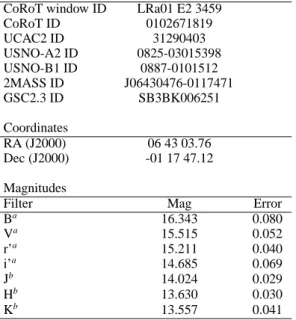
Table 1 presents the ID, coordinates and magnitude of CoRoT-12. This star is located in a field near the galactic anti-center direction, in the Monoceros constellation. It was monitored by CoRoT from October 24, 2007 to March 3, 2008 (CoRoT run
LRa01; see Rauer et al. 2009, Carone et al. in prep.).
The transits of CoRoT-12b were noticed after 29 days by the so-called ‘alarm mode’ pipeline (Surace et al. 2008). The time-sampling was then changed from 512s, the nominal value, to 32s. The processed light curve (LC) of CoRoT-12 is shown in Fig. 1. This monochromatic LC consists of 258 043 photometric measurements for a total duration of 131 days. It results from the processing of the raw CoRoT measurements by the stan-dard CoRoT pipeline (version 2.1, see Auvergne et al. 2009), followed by a further processing (outliers rejection and system-atics correction) similar to what is described by, e.g., Barge et al. (2008) and Alonso et al. (2008). 47 transits of CoRoT-12b are present in the LC, 36 of them being found in its oversam-pled part. Some discontinuities are present in the LC. They were caused by energetic particles hits during the crossings of the South-Atlantic Anomaly by the satellite. A large jump of the measured flux (more than 5%) caused by the impact of a cosmic
CoRoT window ID LRa01 E2 3459 CoRoT ID 0102671819 UCAC2 ID 31290403 USNO-A2 ID 0825-03015398 USNO-B1 ID 0887-0101512 2MASS ID J06430476-0117471 GSC2.3 ID SB3BK006251 Coordinates RA (J2000) 06 43 03.76 Dec (J2000) -01 17 47.12 Magnitudes
Filter Mag Error
Ba 16.343 0.080 Va 15.515 0.052 r’a 15.211 0.040 i’a 14.685 0.069 Jb 14.024 0.029 Hb 13.630 0.030 Kb 13.557 0.041
a Provided by Exo-Dat (Deleuil et al, 2009). b from 2MASS catalog (Skrustkie et al. 2006).
Table 1. IDs, coordinates and magnitudes for the star CoRoT-12.
ray on the detector can also be noticed in the last part of the LC. The processed LC shown in Fig. 1 has an excellent duty cycle of 91%.
Despite that its CoRoT LC shows some kind of irregular variations with a peak-to-peak amplitude of 2.3%, CoRoT-12 appears to be a photometrically quiet star. Except for the tran-sit signal (see below), the discrete Fourier-transform of the LC shows no clear periodicity over the noise level. The rotational period of the star cannot thus be constrained from the CoRoT photometry.
Periodic transit-like signals are clearly visible in the LC, as can be seen in Fig. 1. Initial values for the orbital period P and transit epoch T0 were determined by trapezoidal fitting of
the transit centers, as described by Alonso et al. (2008). The resulting values were T0 = 2545398.6305 ± 0.0002 HJD and
P = 2.82805 ± 0.00005 days. These values were used to
sched-ule the ground-based follow-up observations (see next Section), and also as initial guesses for the global analysis presented in Sec. 5.
3. Ground-based observations
The following ground-based observations were performed to es-tablish the planetary nature of CoRoT-12b and to better charac-terize the system.
3.1. Imaging - contamination
CoRoT has a rather poor optical resolution, so performing high-resolution ground-based imaging of its fields is important, not only to assess the possibility that the eclipse signals detected by CoRoT are due to contaminating eclipsing binaries, but also to estimate the dilution of the eclipses measured by CoRoT caused by contaminating stars (see Deeg et al. 2009 for details).
Imaging of the target field was undertaken with the 2.5m INT telescope during pre-launch preparations (Deleuil et al., 2009) and with the IAC80 telescope during candidate follow-up (Deeg
Fig. 1. T op: Normalized CoRoT LC of the star CoRoT-12. The oversampled part of the LC was binned to the same time bin than its first part for the sake of clarity. Bottom: zoom on a transit of CoRoT-12b.
Fig. 2. The sky area around CoRoT-12 (brightest star near the centre). Le f t: R-filter image with a resolution of 1.3” taken with the INT/WFC. Right: Image taken by CoRoT, at the same scale and orientation. The jagged outline in its center is the photo-metric aperture mask; indicated are also CoRoT’s x and y im-age coordinates and positions of nearby stars from the Exo-Dat (Deleuil et al 2009) database.
et al. 2009). It found no nearby contaminating star that could be a potential false alarm source, i.e. that mimiks CoRoT’s signal while being an eclipsing binary star (see Fig. 2).
Using the method describe by Deeg et al. (2009), the fraction of contamination in the CoRoT-12 photometric aperture mask was estimated to be 3.3 ± 0.5%. It is mostly due to a 3.5 mag fainter star that is 8.5” SW. This small dilution was taken into account in our analysis presented in Sec. 5.
3.2. Radial velocities - spectroscopy
Four radial velocity (RV) measurements were obtained with the HARPS spectrograph (Pepe et al. 2002b, Mayor et al. 2003) on the 3.6-m telescope at ESO La Silla Observatory (Chile), on October 2008 (HARPS program 082.C-0120). These first data were made using the high efficiency mode EGGS in order to establish the planetary nature of the companion, showing a de-tectable and low-amplitude radial velocity variation in phase with the CoRoT ephemeris, with the shortest exposure time. Ten additionnal measurements were recorded with HARPS, from November 27, 2009 to February 05, 2010 (HARPS program 184.C-0639). These newer data points were acquired using the high accuracy mode HAM to increase the precision of the RV measurements compared to the about 30 m s−1of systematic er-rors of the high efficiency mode (Moutou et al. 2009), and with-out simultaneous thorium (obj AB mode) in order to monitor the Moon background light on the second fiber B. Radial ve-locities were obtained from the HARPS spectra by computing weighted cross-correlation with a numerical G2 mask (Baranne et al. 1996; Pepe et al. 2002a).
Sixteen spectra of CoRoT-12 were also acquired with the HIRES spectrograph on the Keck I telescope as part of NASA’s key science project in support of the CoRoT mission. Differential RVs were computed from these spectra with the
Austral code (Endl et al. 2000). First, ten spectra were gathered
during a transit of CoRoT-12b in January 2009. Unfortunately, the used set-up of the slit decker did not allow a proper subtrac-tion of the sky background, leading to RV systematics with an amplitude of a few dozens m s−1, so we decided to reject these
data. Six other HIRES RVs were obtained between December 2009 and January 2010. For these six spectra, the set-up of the slit decker was changed, leading to a proper background subtrac-tion.
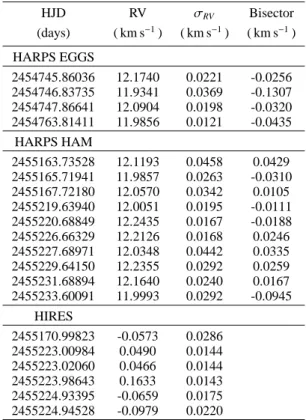
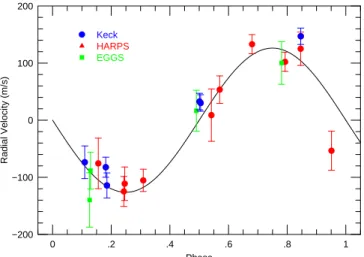
Our HARPS and HIRES measurements are presented in Table 2. An orbital analysis was performed treating the three sets of RV measurements (HARPS HAM, HARPS EGGS, and HIRES) as independent data sets with different zero point ve-locities. The orbital solution was made keeping the period and ephemeris fixed to the CoRoT values, but allowing the zero point offsets to be fit in a least square way. Fig. 3 shows the resulting orbital solution which is in phase with the CoRoT photomet-ric signal. The resulting eccentphotomet-ricity (0.03 ± 0.13) was consis-tent with zero while the semi-amplitude was 124 ±15 m s−1.
Assuming a solar-mass host star, this semi-amplitude translates into a transiting object with a mass of about 0.9 MJ. In Sec. 5 we present a revised orbit obtained using a global analysis.
The residual RVs were analyzed after removing the orbit to look for the possible presence of additional companions. No significant variations were found, but given the sparseness of the measurements we cannot exclude the presence of additional companions with a good confidence.
The HARPS cross-correlation functions were analyzed using the line-bisector technique (Queloz et al. 2000). Fig. 4 shows the correlation between the bisector and RV measurements. The cor-relation coeffient of all the RV-bisector measurements, r, has a value of 0.56 with a probability 0.026 that the data is uncorre-lated. Ostensibly this correlation looks to be significant, but we do not believe that to be the case as this correlation is largely driven by one outlier in the HARPS data and another EGGS measurement. When one examines only the HARPS data the co-efficient drops to r = 0.47 with a probabilty of 0.15 that the data is uncorrelated. Removing one outlier point lowers the
correla-tion coefficient to r = 0.32 with the probability of no correlacorrela-tion being 0.37.
We believe that the modestly high correlation coefficient may be an artifact of the bisector error being more than a factor of two larger than the RV measurement error and the paucity of mea-surements. To test this we generated fake bisector/RV data con-sisting only of random noise that was sampled the same way as the real data. The standard deviations of the fake measurements were consistent with the median error of the RV and bisector measurements. In approximately 40% of the cases the correla-tion coefficient of these random data had correlacorrela-tion coefficients at least as large as that of the real data. The RV-bisector correla-tion coefficient that we measure is consistent with random noise coupled with sparse sampling. This discards the possibility that the periodic signal detected in these RVs is caused by a blended eclipsing binary. Taking into account the fact that CoRoT-12 is a solar analog star (see Sect. 4), we interpret thus the eclipses detected in CoRoT photometry as transits of a new giant planet, CoRoT-12b. HJD RV σRV Bisector (days) ( km s−1) ( km s−1) ( km s−1) HARPS EGGS 2454745.86036 12.1740 0.0221 -0.0256 2454746.83735 11.9341 0.0369 -0.1307 2454747.86641 12.0904 0.0198 -0.0320 2454763.81411 11.9856 0.0121 -0.0435 HARPS HAM 2455163.73528 12.1193 0.0458 0.0429 2455165.71941 11.9857 0.0263 -0.0310 2455167.72180 12.0570 0.0342 0.0105 2455219.63940 12.0051 0.0195 -0.0111 2455220.68849 12.2435 0.0167 -0.0188 2455226.66329 12.2126 0.0168 0.0246 2455227.68971 12.0348 0.0442 0.0335 2455229.64150 12.2355 0.0292 0.0259 2455231.68894 12.1640 0.0240 0.0167 2455233.60091 11.9993 0.0292 -0.0945 HIRES 2455170.99823 -0.0573 0.0286 2455223.00984 0.0490 0.0144 2455223.02060 0.0466 0.0144 2455223.98643 0.1633 0.0143 2455224.93395 -0.0659 0.0175 2455224.94528 -0.0979 0.0220
Table 2. HARPS and HIRES radial velocity measurements for CoRoT-12. The HARPS RVs are absolute, while the HIRES RVs are differential (measured relative to a stellar template). The bi-sectors were not measured from the HIRES spectra.
4. Stellar parameters
Two master spectra were used to determine the atmospheric pa-rameters of the star. The first of them was made by co-addition of the seven HARPS HAM spectra which were not strongly con-tamined by the Moon background light. The resulting master spectrum had a signal-to-noise ratio (SNR) about 40 in the con-tinuum. The second master spectrum was obtained from the
co-0 .2 .4 .6 .8 1 −200 −100 0 100 200 Keck HARPS EGGS Phase Radial Velocity (m/s)
Fig. 3. HARPS and HIRES RVs phase-folded on the CoRoT ephemeris and overimposed on the best fit orbital model.
−200 −150 −100 −50 0 50 100 150 200 −200 −100 0 100 200 Radial Velocity (m/s) Bisector Span (m/s)
Fig. 4. Bisector versus RV measured from the HARPS spectra. Errors of twice the RV errors were adopted for all the bisector measurements.
addition of two Keck spectra and had a SNR about 100 in the continuum.
The methodology used to analyze these two master spectra was mainly based on the semi-automatic package VWA (Bruntt et al. 2002, 2008, 2010), and is thoroughly described by Deleuil et al. (2008) and Bruntt et al. (2010). The derived atmospheric parameters and elemental abundances are presented in Table 3.
The Li I line at 670.78 nm was not detected in both mas-ter spectra, nor any hint of chromospheric activity. From this, the low rotational velocity measured in the spectra, and the low photometric variability noticed in the CoRoT LC, CoRoT-12 ap-pears thus to be a quiet and slowly rotating solar analog star.
Using Teff and log g from the VWA spectroscopic
analy-sis, we estimated the absolute magnitude MV ≃ 4.75 mag and colour excess E(J − K) ≃ 0.08 mag from the Allen’s tables (Cox 2000). We calculated the corresponding interstellar absorption AV ≃ 0.46 (using AV = (5.82 ± 0.1) × E(J − K); Cox 2000), to estimate, with the V apparent magnitude, the distance of the star to be d = 1150 ± 85 pc. Teff 5675 ± 80 K log g 4.52 ± 0.08 νmic 0.6 ± 0.2 km s−1 νmac 1.5 ± 0.3 km s−1 v sin i 1.0 ± 1.0 km s−1 d 1150 ± 85 pc [Fe/H] 0.16 ± 0.10 [Na/H] 0.17 ± 0.06 [Mg/H] 0.13 ± 0.07 [Al/H] 0.15 ± 0.10 [Si/H] 0.12 ± 0.08 [Ca/H] 0.09 ± 0.10 [Sc/H] 0.22 ± 0.15 [Ti/H] 0.05 ± 0.09 [V/H] 0.02 ± 0.08 [Cr/H] 0.17 ± 0.09 [Mn/H] 0.20 ± 0.13 [Co/H] 0.16 ± 0.14 [Ni/H] 0.21 ± 0.08
Table 3. Stellar parameters and elemental abundances derived for CoRoT-12 from our VWA spectroscopic analysis.
5. Global analysis 5.1. Description
We performed a thorough global analysis of the CoRoT transit photometry and HARPS/HIRES RVs to get the strongest con-straints on the system parameters. First, we cut the parts of the CoRoT LC located within 0.15 days of the transit mid-times deduced from the preliminary transit ephemeris presented in Sec. 2, getting thus 47 individual transit LCs. Considering their large number of measurements, we decided to stack the mea-surements of the 36 over-sampled transit LCs per 4, to speed-up our analysis. This binning did not affect our final precision on the system parameters, as the resulting folded LC (see Fig. 5) is still well sampled.
Our analysis was done with the adaptative Markov Chain Monte-Carlo (MCMC) algorithm presented by Gillon et al. (2009; 2010). MCMC is a Bayesian inference method based on stochastic simulations that samples the posterior probabil-ity distributions of adjusted parameters for a given model. Our MCMC implementation uses the Metropolis-Hasting algorithm (see, e.g., Carlin & Louis 2008) to perform this sampling. Our nominal model was based on a star and a transiting planet on a Keplerian orbit about their center of mass. More specifically, we used a classical Keplerian model for the RVs, while we modeled the eclipse photometry with the photometric eclipse model of Mandel & Agol (2002) multiplied by a baseline model consist-ing of a different fourth-order time polynomial for each of the 47 CoRoT time-series. The coefficients of these baseline models were determined by least-square minimization at each steps of the Markov chains (see Gillon et al. 2010 for details).
Our analysis was composed of a nominal MCMC run, fol-lowed by two other MCMC runs having different specificities that are described below and summarized in Table 4. Each of the MCMC runs was composed of five Markov chains of 105
steps, the first 20 % of each chain being considered as its burn-in phase and discarded. For each run, the convergence of the five Markov chains was checked using the statistical test presented by Gelman and Rubin (1992).
The correlated noise present in the LCs was taken into ac-count as described by Gillon et al. (2010), i.e., a scaling factor was determined for each LC from the standard deviation of the binned and unbinned residuals of a preliminary MCMC analysis, and it was applied to the error bars (see also Winn et al. 2008). For the RVs, a ‘jitter’ noise of 5 m s−1was added quadratically to the error bars, this value being an upper limit for a quiet solar-type star like CoRoT-12 (Wright 2005). Practically, this low jitter noise has no impact on the posterior distributions of the system parameters, as CoRoT-12 is faint and the RV precision is photon noise/background contamination limited. For the four HARPS measurements obtained with the EGGS mode, a systematic er-ror of 30 m s−1was also added quadratically to the error bars (see Sec. 3.2).
In all three MCMC runs, the following parameters were jump parameters2: the planet/star area ratio (Rp/Rs)2, the transit width (from first to last contact) W, the parameter b′= a cos i/R
∗
(which is the transit impact parameter in case of a circular or-bit), the orbital period P and time of minimum light T0, the
two Lagrangian parameters e cos ω and e sin ω where e is the orbital eccentricity and ω is the argument of periastron, and the parameter K2= K
√
1 − e2P1/3, where K is the RV orbital
semi-amplitude (see Gillon et al. 2009, 2010). We assumed a uniform prior distribution for all these jump parameters. To take into ac-count the small dilution of the signal due to contaminating stars (see Sec. 3.1), the jump parameters (Rp/Rs)2was divided at each step of the MCMC by a number drawn from the distribution
N(1.033, 0.0052) before being used in the computation of the
eclipse model.
We did not assume a perfectly circular orbit in any of our MCMC runs despite that a circular orbit is compatible with the results of our orbital analysis of the RVs (see Sec. 3.2). Indeed, most short-period planets could keep a tiny but non-zero eccen-tricity during a major part of their lifetime (Jackson et al. 2008), so fixing the eccentricity to zero is not justified by tidal theory and could lead to overoptimistic error bars on the system param-eters.
We assumed a quadratic limb-darkening law, and we allowed the quadratic coefficients u1and u2to float in our MCMC runs,
using as jump parameters not these coefficients themselves but the combinations c1 = 2 × u1+ u2 and c2 = u1 − 2 × u2 to
minimize the correlation of the obtained uncertainties (Holman et al. 2006). To obtain a limb-darkening solution consistent with theory, we decided to use normal prior distributions for u1
and u2 based on theoretical values. Sing (2010) presented
re-cently a grid of limb-darkening coefficients specially computed for the CoRoT non-standard bandpass and for several limb-darkening laws. We deduced the values u1 = 0.47 ± 0.03 and
u2 = 0.22 ± 0.02 from Sing’s grid for the spectroscopic
param-eters of CoRoT-12 and their errors (Table 3). The correspond-ing normal distributions N(0.47, 0.032) and N(0.22, 0.022) were
used as prior distributions for u1and u2in our MCMC analysis.
At each step of the Markov chains, the stellar density de-duced from the jump parameters, and values for Te f f and [Fe/H] drawn from the normal distributions deduced from our spectro-scopic analysis, were used as input for the stellar mass calibra-tion law deduced by Torres et al. (2010) from well-constrained
2 Jump parameters are the parameters that are randomly perturbed at
each step of the MCMC.
detached binary systems3. Using the resulting stellar mass, the
physical parameters of the system were then deduced from the jump parameters at each MCMC step. To account for the uncer-tainty on the parameters of the stellar calibration law, the values for these parameters were randomly drawn at each step of the Markov chains from the normal distribution presented by Torres et al. (2010).
In our second MCMC run (labeled MC MC2 in Table 4), we
also used as data the parts of the CoRoT LC located within 0.2 days of the occultation mid-times deduced from the best fit tran-sit ephemeris of our nominal MC MC run. The goal of this run was to obtain an upper limit for the depth of the occultation in the CoRoT photometry. For this run, the occultation depth was thus also a jump parameter.
Finally, we assessed the perfect periodicity of the transits of CoRoT-12b in our third run (labeled MC MC3 in Table 4). For
this run, a transit timing variation (TTV) was considered as jump parameter for each of the 47 transits. Obviously, the orbital pe-riod could not be determined unambiguously without any prior on these TTVs, so we assumed a normal prior distribution cen-tered on zero for each of them. Practically, we added the follow-ing Bayesian penalty to our merit function:
BPtimings= X i=1,47 T T Vi σT Ti !2 (1)
where T T Viis the TTV for the ithCoRoT transit, and σT Tiis the
error on its timing estimated by a preliminary individual analysis of this transit.
5.2. Results
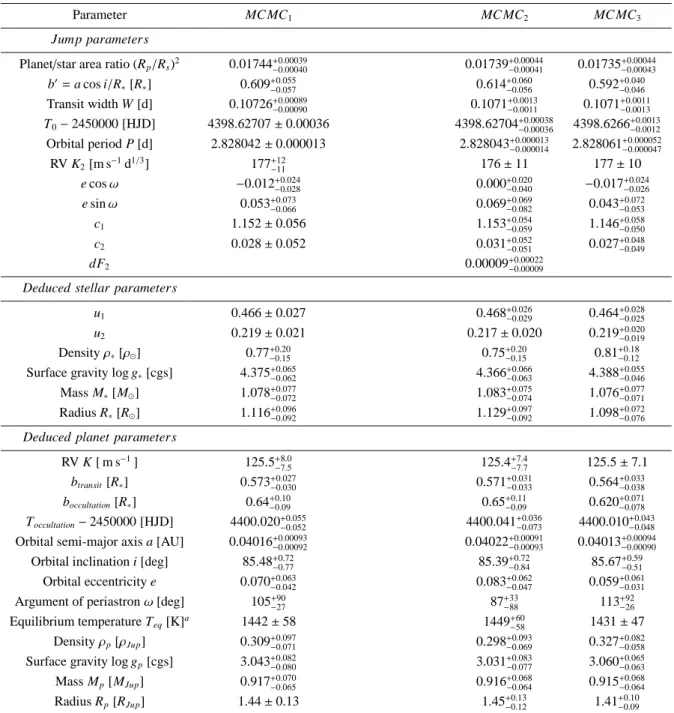
Table 5 present the CoRoT-12 system parameters and 1-σ error limits derived from our nominal MCMC run (MC MC1), and for
the two other MCMC runs.
Our MCMC analysis presents CoRoT-12b as an inflated Jupiter-mass planet (Mp = 0.92 ± 0.07 MJup, Rp = 1.44 ± 0.13
RJup) transiting a solar analog star (M∗ = 1.08 ± 0.08 M⊙,
R∗ = 1.1 ± 0.1 R⊙). Using the stellar density deduced from our MCMC analysis (ρ∗ = 0.77+0.20−0.15 ρ⊙) and the effective temper-ature and metallicity obtained from spectroscopy (Table 3), a stellar evolution modeling based on the code CLES (Scuflaire et al. 2008) leaded to a stellar mass of 1.07 ± 0.10 M⊙, in excellent
agreement with our MCMC result, and to a poorly constrained age of 6.3 ± 3.1 Gyr. It is also worth noticing that the two inde-pendent values obtained for the stellar surface gravity from our spectroscopic and global analysis are in good agreement (1.4 σ), indicating the good coherence of our final solution.
Fig. 5 presents the period-folded CoRoT photometry binned per two minutes time intervals with the best fit transit model su-perimposed. The standard deviation of the residuals of this lat-ter LC is 592 ppm, demonstrating the excellent quality of the CoRoT photometry.
Our results show that the limb-darkening coefficients u1and
u2are poorly constrained by the CoRoT transit photometry,
de-spite its good precision. Indeed, the posterior distributions of u1
and u2 are close to the prior distributions, indicating that the
CoRoT data do not constrain these parameters much.
Our final precisions on the stellar and planetary masses and radii are not excellent (about 7% on the masses and about 10%
3 The stellar calibration law presented by Torres et al. is in fact
func-tion of Te f f, [Fe/H] and log g. We modified it to use as input the stellar
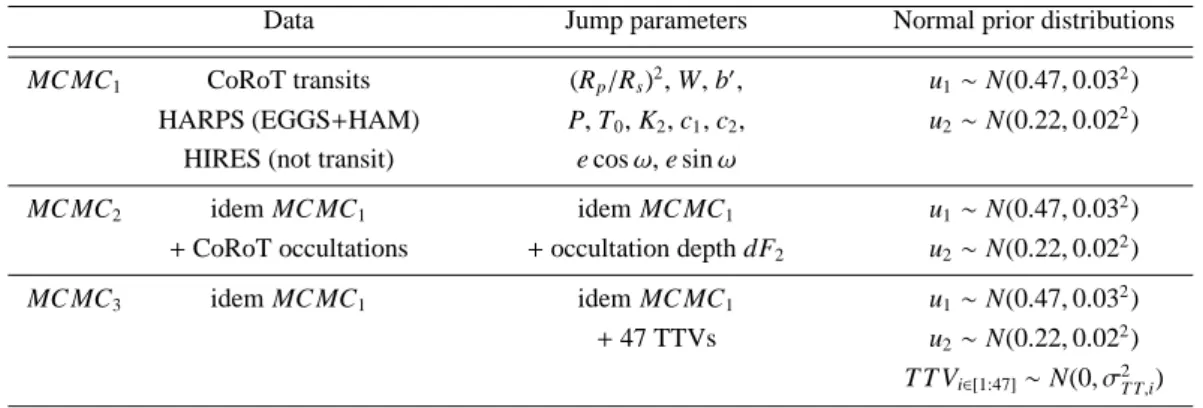
Data Jump parameters Normal prior distributions MC MC1 CoRoT transits (Rp/Rs)2, W, b′, u1∼ N(0.47, 0.032)
HARPS (EGGS+HAM) P, T0, K2, c1, c2, u2∼ N(0.22, 0.022)
HIRES (not transit) e cos ω, e sin ω
MC MC2 idem MC MC1 idem MC MC1 u1∼ N(0.47, 0.032)
+ CoRoT occultations + occultation depth dF2 u2∼ N(0.22, 0.022)
MC MC3 idem MC MC1 idem MC MC1 u1∼ N(0.47, 0.032)
+ 47 TTVs u2∼ N(0.22, 0.022)
T T Vi∈[1:47]∼ N(0, σ2
T T,i) Table 4. Specificities of the three MCMC runs performed during our global analysis. See text for details
on the radii), and more observations are required to thoroughly characterize this system. In this context, improving significantly the precision on the stellar density (about 20%) is desirable. Such an improvement could be achieved mostly through a bet-ter characbet-terization of the orbital paramebet-ters e cos ω and e sin ω with more RV measurements (and possibly occultation photom-etry). Indeed, an new MCMC analysis assuming a perfectly cir-cular orbit leads > 2 times smaller error bars on the planet’s and star’s radii. The characterization of the system would also bene-fit from an improved determination of the transit parameters with more high-precision transit photometry, if possible acquired in a redder bandpass (less significant limb-darkening).
The results of the run MC MC2 show that the occultation of
the planet is not detected in the CoRoT data. We can only put an upper limit on its depth (3-σ upper limit = 680 ppm).
As expected, the errors on T0and P are significantly larger
for the run MC MC3, but the posterior distributions obtained for
the other parameters agree well with ones of the other MCMC runs. The resulting TTVs are shown in Fig. 6. No transit shows a significant timing variation. Still, the resulting TTV series seems to show a correlated structure. Fitting a sinusoidal function in this series leads to a best-fit period of about 24 epochs , i.e. of about 68 days. Nevertheless, the resulting false alarm probability is high, about 15%, indicating that this correlated structure is not very significant. Still, it is interesting to notice that, if we assume a rotational period of 68 days for the star and sin i = 1, and using R∗ = 1.1 R⊙, we obtain a value of 1.2 km s−1for
v sin i, in excellent agreement with the value derived from our
spectroscopic analysis (see Table 3). In this context, a possible interpretation of the low-amplitude structure visible in the TTV series is that it is caused by the rotation of the surface of the star and its influence on the transit barycenters.
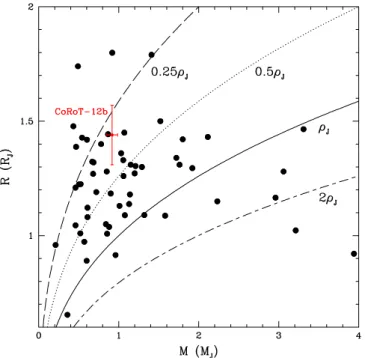
6. Discussion
The position of CoRoT-12b in a planetary mass-radius diagram is shown in Fig. 7. While being denser than the extremely inflated planets WASP-17b (Anderson et al. 2010a), TrES-4b (Mandushev et al. 2007) and WASP-12b (Hebb et al. 2009), CoRoT-12b appears to be a very low-density ‘hot Jupiter’. Using the hypothesis that the planet is a core-less gazeous planet of so-lar composition, we used the planetary evolution code CEPAN (Guillot & Morel, 1995) to assess the ability of standard irra-diated planet models to explain the low-density of CoRoT-12b. Several models were used: a standard model with no extra heat source, a model for which the opacities were artificially mul-tiplied by 30, and three models with a constant energy deposit (1026, 1027and 1028erg.s−1) at the planet’s center. Our results in
Fig. 5. T op: CoRoT transit photometry period-folded and binned per 2 minutes time intervals, with the best fit transit model su-perimposed. Bottom: residuals. Their standard deviation is 592 ppm.
terms of planetary size evolutions are shown in Fig. 8. For recall, we constrain the age of the system to 6.3 ± 3.1 Gyr. Considering this age, the measured size of CoRoT-12b is in good agreement with all four evolution models. At most can we notice that an ex-tra heat source and/or of larger opacities are favored by the data, but a more precise radius measurement is needed to conclude.
In this context, it is worth noticing that the precision on the planet’s radius is mostly limited by the precision on the orbital eccentricity and argument of periastron (see Sec. 5.2). It is thus desirable to obtain more RV measurements of the system. Better constraining the planet’s orbital eccentricity would also make possible the assessment of its past tidal evolution and its influ-ence on its energy budget (e.g., Ibgui et al. 2010).
Acknowledgements. The authors wish to thank the staff at ESO La Silla
Observatory for their support and for their contribution to the success of the HARPS project and operation. A part of the data presented herein were obtained at the W.M. Keck Observatory from telescope time allocated to the National Aeronautics and Space Administration through the agency’s scientific partner-ship with the California Institute of Technology and the University of California. The Observatory was made possible by the generous financial support of the W.M. Keck Foundation. The authors wish to recognize and acknowledge the very significant cultural role and reverence that the summit of Mauna Kea has always had within the indigenous Hawaiian community. We are most fortunate to have the opportunity to conduct observations from this mountain. The team at IAC acknowledges support by grant ESP2007-65480-C02-02 of the Spanish
Fig. 6. T op: median value and 1-σ limits of the TTV posterior distributions obtained in MC MC3. Bottom: same curve obtained
after binning the TTVs per three (error of each bin = error on the mean).
Fig. 7. Position of CoRoT-12b (in red) among the other transiting planets (black circles, values from http://exoplanet.eu) in a mass-radius diagram. The error bars are shown only for CoRoT-12b (C12), WASP-17b (W17), TrES-4b (T4), and WASP-12b (W12) for the sake of clarity.
Ministerio de Ciencia e Innovaci´on. The building of the input CoRoT/Exoplanet catalog (Exo-dat) was made possible thanks to observations collected for years at the Isaac Newton Telescope (INT), operated on the island of La Palma by the Isaac Newton group in the Spanish Observatorio del Roque de Los Muchachos of the Instituto de Astrophysica de Canarias. The German CoRoT team (TLS and University of Cologne) acknowledges DLR grants 50OW0204, 50OW0603, and 50QP07011. The French team wish to thank the ”Programme National de Plan´etologie” (PNP) of CNRS/INSU and the French National Research Agency
Fig. 8. Evolution of the size of CoRoT-12b (in Jupiter units,
RJup) as a function of age (in billion years), compared to con-straints inferred from CoRoT photometry, spectroscopy, radial velocimetry and CESAM stellar evolution models. Red, blue and yellow-green dots correspond to the planetary radii and ages that result from stellar evolution models matching the inferred
ρ∗-Teff uncertainty ellipse within 1σ, 2σ and 3σ, respectively.
Planetary evolution models for a planet with a solar-composition envelope and no core are shown as plain lines and are labeled as follow : standard (black): irradiated planet with no extra heat source ; opacities x 30 (blue): opacities have been artificially multiplied by 30 compared to standard model ; dissipation: mod-els in which 1026(green), 1027(pink), and 1028(pur ple) erg s−1 is deposited at the planet’s center. These models assume a total mass of 0.92 MJupand an equilibrium temperature of 1450 K
(ANR-08-JCJC-0102-01) for their continuous support to our planet search. The Swiss team acknowledges the ESA PRODEX program and the Swiss National Science Fundation for their continuous support on CoRoT ground follow-up. M. Gillon acknowledges support from the Belgian Science Policy Office in the form of a Return Grant, and thanks B.-O. Demory for useful discussions. Finally, the authors thank the anonymous referee for his valuable comments.
References
Alonso R., Auvergne M., Baglin A., et al., 2008, A&A, 482, L21 Anderson D. R., Hellier C., Gillon M., et al., 2010, ApJ, 709, 159 Anderson D. R., Gillon M., Maxted P. F. L., et al., 2010, A&A, 513, L3 Auvergne M., Bodin P., Boisnard L., et al., 2009, A&A, 506, 411
Baglin A., Auvergne M., Barge P., et al., 2009, Transiting Planets, Proceedings of the International Astronomical Union, IAU Symposium, 253, 71 Baranne, A., Queloz, D., Mayor, M., et al. 1996, A&AS, 119, 373 Barge P., Baglin A., Auvergne M., et al., 2008, A&A, 482, L17 Bruntt H.,Catala C., Garrido R., et al., 2002, A&A, 389, 345 Bruntt H., De Cat P., Aerts C., 2008, A&A, 478, 487
Bruntt H., Deleuil M., Fridlund M., et al., 2010, A&A (accepted), arXiv1005.3208
Carlin B. P., Louis T. A., 2008, Bayesian Methods for Data Analysis, Third Edition (Chapman & Hall/CRC)
Claret A., 2000, A&A, 363, 1081 Claret A., 2004, A&A, 428, 1001
Cox A. N., 2000, Allen’s Astrophysical Quantities, AIP Press, Springer Deeg H. J., Gillon M., Shporer A., et al., 2009, A&A, 506, 343 Deeg H. J., Moutou C., Eriksson A., et al., 2010, Nature, 464, 384 Deleuil M., Deeg H. J., Alonso R., et al., 2008, A&A, 491, 889 Deleuil M., Meunier J. C., Moutou C., et al., 2009, AJ, 138, 649 Deming D., Seager S., 2009, Nature, 462, 302
Endl M., K ¨urster M., Els S., 2000, A&A, 363, 585 Gelman A., Rubin D., 1992, Statistical Science, 7, 457
Gillon M., Demory B.-O., Triaud A. H. M. J., et al., 2009, A&A, 506, 359 Gillon M., Lanotte A. A., Barman T., et al., 2010, A&A, 511, 3
Guillot T., Morel P., 1995, A&AS, 109, 109
Hebb L., Collier-Cameron A., Loeillet B., et al., 2009, ApJ, 693, 1920 Holman M. J., Winn J. N., Latham D. W., et al., 2006, ApJ, 652, 1715 Ibgui L., Burrows A., Spiegel D. S., 2010, ApJ, 713, 751
Jackson B., Greenberg R., Barnes R., 2008, ApJ, 681, 1631 L´eger, A., Rouan, D., Schneider, J., et al., 2009, A&A, 506, 287 Mandel K., Agol E., 2002, ApJ, 580, 171
Mandushev G., O ´Donovan F. T., Charbonneau D., et al., 2007, ApJ, 667, L195 Mayor, M., Pepe, F., Queloz, D., et al., 2003, The Messenger, 114, 20 Moutou C., Pont F., Bouchy F., et al., 2009, A&A, 506, 321 Pepe, F., Mayor, M., Galland, F., et al. 2002a, A&A, 388, 632 Pepe, F., Mayor, M., Ruppretch, G., et al. 2002b, The Messenger, 110, 9 Queloz D., Eggenberger A., Mayor M., et al., 2000, A&A, 359, L13 Queloz D., Bouchy F., Moutou C., et al., 2009, A&A, 506, 303 Rauer H., Queloz D., Csizmadia Sz, et al., 2009, A&A, 506, 281 Scuflaire R., Th´eado S., Montalb´an J., et al., APSS, 316, 83 Sing D. K., 2010, A&A, 510, 21
Skrustkie M. F., Cutri R. M., Stiening M. D., et al., 2006, AJ, 131, 1163 Surace C., Alonso R., Barge P., et al., 2008, Proceedings of the SPIE, Volume
7019
Torres G., Andersen J., Gim´enez A., 2010, A&ARv, 18, 67 Winn J. N., Holman M. J., Torres T., et al., 2008, ApJ, 683, 1076
Winn J. N., 2010, to appear in Exoplanets, S. Seager (eds.), University of Arizona Press, Tucson, arXiv:1001.2010
Wright J. T., 2005, PASP, 117, 657
1 Universit´e de Li`ege, All´ee du 6 aoˆut 17, Sart Tilman, Li`ege 1,
Belgium
2 Th¨uringer Landessternwarte, Sternwarte 5, Tautenburg 5, D-07778
Tautenburg, Germany
3 Institute of Planetary Research, German Aerospace Center,
Rutherfordstrasse 2, 12489 Berlin, Germany
4 Research and Scientic Support Department, ESTEC/ESA, PO Box
299, 2200 AG Noordwijk, The Netherlands
5 Laboratoire d’Astrophysique de Marseille, 38 rue Fr´ed´eric
Joliot-Curie, 13388 Marseille cedex 13, France
6 Department of Physics, Denys Wilkinson Building Keble Road,
Oxford, OX1 3RH
7 Observatoire de l’Universit´e de Gen`eve, 51 chemin des Maillettes,
1290 Sauverny, Switzerland
8 LESIA, Observatoire de Paris, Place J. Janssen, 92195 Meudon
cedex, France
9 Department of Physics and Astronomy, University of Canterbury,
Private Bag 4800, Christchurch 8140, New Zealand
10 Institut d’Astrophysique Spatiale, Universit´e Paris-Sud 11 & CNRS
(UMR 8617), Bˆat. 121, 91405 Orsay, France
11 Observatoire de Haute Provence, 04670 Saint Michel
l’Observatoire, France
12 Institut d’Astrophysique de Paris, UMR7095 CNRS, Universit´e
Pierre & Marie Curie, 98bis boulevard Arago, 75014 Paris, France
13 LUTH, Observatoire de Paris, CNRS, Universit´e Paris Diderot, 5
place Jules Janssen, 92195 Meudon, France
14 Rheinisches Institut f¨ur Umweltforschung an der Universit¨at zu
K¨oln, Aachener Strasse 209, 50931, Germany
15 McDonald Observatory, The University of Texas at Austin, Austin,
TX 78731, USA
16 Instituto de Astrof´ısica de Canarias, E-38205 La Laguna, Tenerife,
Spain
17 University of Vienna, Institute of Astronomy, T¨urkenschanzstr. 17,
A-1180 Vienna, Austria
18 IAG-Universidade de Sao Paulo, Brazil
19 Universit´e de Nice-Sophia Antipolis, CNRS UMR 6202,
Observatoire de la Cˆote d’Azur, BP 4229, 06304 Nice Cedex 4, France
20 Space Research Institute, Austrian Academy of Science,
Schmiedlstr. 6, A-8042 Graz, Austria
21 School of Physics and Astronomy, Raymond and Beverly Sackler
Faculty of Exact Sciences, Tel Aviv University, Tel Aviv, Israel
22 Center for Astronomy and Astrophysics, TU Berlin, Hardenbergstr.
Parameter MC MC1 MC MC2 MC MC3
Jump parameters
Planet/star area ratio (Rp/Rs)2 0.01744+0.00039−0.00040 0.01739+0.00044−0.00041 0.01735+0.00044−0.00043
b′= a cos i/R ∗[R∗] 0.609+0.055−0.057 0.614+0.060−0.056 0.592+0.040−0.046 Transit width W [d] 0.10726+0.00089 −0.00090 0.1071 +0.0013 −0.0011 0.1071 +0.0011 −0.0013 T0− 2450000 [HJD] 4398.62707 ± 0.00036 4398.62704+0.00038−0.00036 4398.6266+0.0013−0.0012 Orbital period P [d] 2.828042 ± 0.000013 2.828043+0.000013 −0.000014 2.828061 +0.000052 −0.000047 RV K2[m s−1d1/3] 177+12−11 176 ± 11 177 ± 10 e cos ω −0.012+0.024 −0.028 0.000 +0.020 −0.040 −0.017 +0.024 −0.026 e sin ω 0.053+0.073 −0.066 0.069 +0.069 −0.082 0.043 +0.072 −0.053 c1 1.152 ± 0.056 1.153+0.054−0.059 1.146+0.058−0.050 c2 0.028 ± 0.052 0.031+0.052−0.051 0.027+0.048−0.049 dF2 0.00009+0.00022−0.00009
Deduced stellar parameters
u1 0.466 ± 0.027 0.468+0.026−0.029 0.464+0.028−0.025 u2 0.219 ± 0.021 0.217 ± 0.020 0.219+0.020−0.019 Density ρ∗[ρ⊙] 0.77+0.20 −0.15 0.75 +0.20 −0.15 0.81 +0.18 −0.12
Surface gravity log g∗[cgs] 4.375+0.065
−0.062 4.366 +0.066 −0.063 4.388 +0.055 −0.046 Mass M∗[M⊙] 1.078+0.077 −0.072 1.083 +0.075 −0.074 1.076 +0.077 −0.071 Radius R∗[R⊙] 1.116+0.096 −0.092 1.129 +0.097 −0.092 1.098 +0.072 −0.076
Deduced planet parameters
RV K [ m s−1] 125.5+8.0 −7.5 125.4 +7.4 −7.7 125.5 ± 7.1 btransit[R∗] 0.573+0.027−0.030 0.571 +0.031 −0.033 0.564 +0.033 −0.038 boccultation[R∗] 0.64+0.10−0.09 0.65 +0.11 −0.09 0.620 +0.071 −0.078 Toccultation− 2450000 [HJD] 4400.020+0.055−0.052 4400.041+0.036−0.073 4400.010+0.043−0.048
Orbital semi-major axis a [AU] 0.04016+0.00093
−0.00092 0.04022
+0.00091
−0.00093 0.04013
+0.00094 −0.00090
Orbital inclination i [deg] 85.48+0.72
−0.77 85.39 +0.72 −0.84 85.67 +0.59 −0.51 Orbital eccentricity e 0.070+0.063 −0.042 0.083 +0.062 −0.047 0.059 +0.061 −0.031
Argument of periastron ω [deg] 105+90
−27 87 +33 −88 113 +92 −26 Equilibrium temperature Teq[K]a 1442 ± 58 1449+60−58 1431 ± 47 Density ρp[ρJup] 0.309+0.097−0.071 0.298+0.093−0.069 0.327+0.082−0.058
Surface gravity log gp[cgs] 3.043+0.082−0.080 3.031+0.083−0.077 3.060+0.065−0.063
Mass Mp[MJup] 0.917+0.070−0.065 0.916+0.068−0.064 0.915+0.068−0.064
Radius Rp[RJup] 1.44 ± 0.13 1.45+0.13−0.12 1.41+0.10−0.09
Table 5. Median and 1-σ limits of the posterior distributions obtained for the CoRoT-12 system derived from our three MCMC runs (see Table 4). MC MC1is our nominal analysis (see text for details).aAssuming A=0 and F=1.