HAL Id: hal-00328343
https://hal.archives-ouvertes.fr/hal-00328343
Submitted on 11 Sep 2003
HAL is a multi-disciplinary open access
archive for the deposit and dissemination of
sci-entific research documents, whether they are
pub-lished or not. The documents may come from
teaching and research institutions in France or
abroad, or from public or private research centers.
L’archive ouverte pluridisciplinaire HAL, est
destinée au dépôt et à la diffusion de documents
scientifiques de niveau recherche, publiés ou non,
émanant des établissements d’enseignement et de
recherche français ou étrangers, des laboratoires
publics ou privés.
century inferred from a Nevado Illimani ice core,
Eastern Bolivian Andes (6350 m asl)
A. Correia, R. Freydier, Robert Delmas, J. C. Simões, J.-D. Taupin, B.
Dupré, P. Artaxo
To cite this version:
A. Correia, R. Freydier, Robert Delmas, J. C. Simões, J.-D. Taupin, et al.. Trace elements in South
America aerosol during 20th century inferred from a Nevado Illimani ice core, Eastern Bolivian Andes
(6350 m asl). Atmospheric Chemistry and Physics, European Geosciences Union, 2003, 3 (5), pp.1352.
�hal-00328343�
Atmos. Chem. Phys., 3, 1337–1352, 2003
www.atmos-chem-phys.org/acp/3/1337/
Atmospheric
Chemistry
and Physics
Trace elements in South America aerosol during 20th century
inferred from a Nevado Illimani ice core, Eastern Bolivian Andes
(6350 m asl)
A. Correia1,2, R. Freydier3, R. J. Delmas2, J. C. Sim˜oes4, J.-D. Taupin5, B. Dupr´e3, and P. Artaxo1
1Institute of Physics, University of S˜ao Paulo, S˜ao Paulo, Brazil 2LGGE, CNRS and Universit´e Joseph Fourier, Grenoble, France
3UMR5563, LMTG, CNRS and Universit´e Paul Sabatier, Toulouse, France 4Institute of Geosciences, Federal University of Rio Grande do Sul, Brazil 5LGGE, IRD, Grenoble, France
Received: 31 January 2003 – Published in Atmos. Chem. Phys. Discuss.: 7 May 2003 Revised: 6 August 2003 – Accepted: 26 August 2003 – Published: 11 September 2003
Abstract. A 137 m ice core drilled in 1999 from Eastern
Bolivian Andes at the summit of Nevado Illimani (16◦37’ S, 67◦46’ W, 6350 m asl) was analyzed at high temporal reso-lution, allowing a characterization of trace elements in An-dean aerosol trapped in the ice during the 20th century. The upper 50 m of the ice core were dated by multi-proxy analy-sis of stable isotopes (δ18O and δ2H),137Cs and Ca+2 tent, electrical conductivity, and insoluble microparticle con-tent, together with reference historical horizons from atmo-spheric nuclear tests and known volcanic eruptions. This 50 m section corresponds to a record of environmental vari-ations spanning about 80 years from 1919 to 1999. It was cut in 744 sub-samples under laminar flow in a clean bench, which were analyzed by Ion Chromatography for major ionic concentration, by a particle counter for insoluble aerosol con-tent, and by Inductively Coupled Plasma Mass Spectrometry (ICP-MS) for the concentration of 45 chemical species from Li to U. This paper focuses on results of trace element con-centrations measured by ICP-MS. The high temporal reso-lution used in the analyses allowed classifying samples as belonging to dry or wet seasons. During wet season ele-mental concentrations are low and samples show high crustal enrichment factors. During dry seasons the situation is op-posite, with high elemental concentrations and low crustal enrichments. For example, with salt lakes as main sources in the region, average Li concentration during the 20th cen-tury is 0.035 and 0.90 ng g−1 for wet and dry seasons, re-spectively. Illimani average seasonal concentration ranges cover the spectrum of elemental concentration measurements at another Andean ice core site (Sajama) for most soil-related elements. Regional crustal dust load in the deposits was
Correspondence to: A. Correia
(acorreia@if.usp.br)
found to be overwhelming during dry season, obfuscating the contribution of biomass burning material. Marked tem-poral trends from the onset of 20th century to more recent years were identified for the concentrations of several trace species of anthropic origin, especially for Cu, As, Zn, Cd, Co, Ni and Cr. Among these elements, Cu shows average wet season crustal enrichment factors above 103, while the others range between 102 to about 5×10². P and K show moderate average wet season enrichment factors, suggesting an impact of natural biogenic emissions from the Amazon Basin. Pb has multiple anthropic sources in the region, from mining activities in the beginning of 20th century to auto-motive fuel after 1950s. From the large number of samples analyzed from Illimani, it was possible to derive an effective chemical characterization of the deposited background An-dean soil dust aerosol during 20th century.
1 Introduction
Ice core records represent important tools for reconstructing past environmental conditions, from climatic variations to at-mospheric chemistry. Several snow and ice cores from polar regions were studied in last decades, especially from Green-land and Antarctica (Wolff and Peel, 1985; Clausen and Langway, 1989; Lorius et al., 1989; Delmas, 1992). A lim-ited number of Alpine ice cores studies have also been per-formed (Wagenbach, 1989). Pioneering work by Thompson and co-workers (e.g. Thompson, et al., 1985, 1988; Thomp-son, 2000) showed the importance of high-altitude tropical ice cores, with different features and challenges compared to polar ice cores. As with glaciochemical studies of snow and ice layers at other latitudes, it can be expected that chemical
composition of snow impurities deposited at high elevation sites in the tropics reflects the free tropospheric aerosol com-position on the regional scale. In general, tropical ice cores sites are closer to continental aerosol sources than polar ones, thus making their aerosol load much higher than in polar re-gions. Also moisture sources are typically closer to tropi-cal ice cores, resulting in higher average snow accumulation rates and higher temporal resolution for the records repre-senting environmental changes. Measured impurities may come from a variety of sources, either natural or anthropic in origin, with high spatial and temporal variability of the atmo-spheric concentrations and physicochemical climate-related characteristics. Most Andean ice core studies aimed at pale-oclimate reconstructions. This is partly explained by the dif-ficulties involved in the recovering of tropical ice cores un-der suitable conditions (no melting before analytical work, in particular) for glaciochemical analyses. The knowledge of the chemical composition of aerosol trapped by snow de-posited in the Andes is limited to a few studies (e.g. Thomp-son et al., 1998), where the focus rests over a wide time scale covering several millennia or over a few elemental concentra-tion profiles. This work addresses this issue, exploring a high temporal resolution (i.e. sub-seasonal) ice core record ex-tracted from the Andes covering about 80 years during 20th century, which was analyzed for the concentration profiles of 45 chemical elements ranging from Li to U by Inductively Coupled Plasma-Mass Spectrometry (ICP-MS). The study of major ionic species by Ion Chromatography and the volcanic eruptions recorded at Illimani will be reported elsewhere (De Angelis et al., 2003a, 2003b).
2 Ice core extraction and sample handling
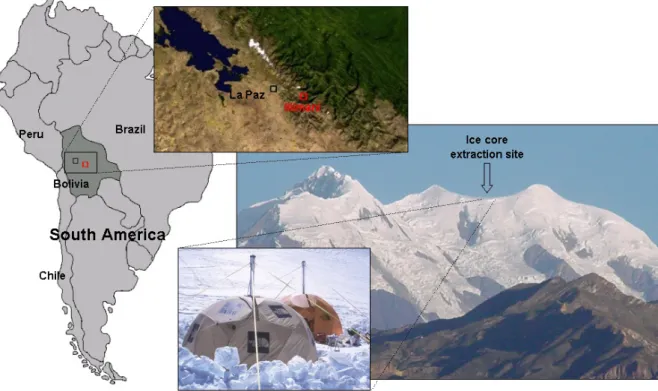
Two ice cores were drilled in 1999 by a French-Swiss team at the summit of Nevado Illimani (16◦37’ S, 67◦46’ W, 6350 m asl, about 40 km SE from La Paz). Figure 1 shows the location of the extraction site over Eastern Bolivian An-des (Cordillera Real). The two cores were separated by about 50 m, and presented total lengths of 137 m (French core) and 139 m (Swiss core). Further details about glaciological fea-tures of the drilling site are given by Sim˜oes et al. (2003). This work discusses results of analyses performed on the French ice core.
Ice core sections drilled at Illimani, measuring about one meter in length and eight centimeters in diameter, were trans-ported in cold conditions from the drilling site to La Paz and then to cold chambers in European laboratories, be-ing kept frozen at all times. This constrainbe-ing procedure adopted for ice core handling makes the core suitable for a comprehensive glaciochemical study. In the cold chambers (−15◦C) of the Laboratoire de Glaciologie et G´eophysique de l’Environnement (LGGE) in Grenoble, France, the ice core sections were weighed and had their lengths measured, then cut in halves which were saved for eventual future
anal-Table 1. ICP-MS setup conditions during analyses
Dwell time 20 ms Sweeps/Reading 10 Readings/Replicates 1 Replicates 10 Acquisition time 1 m 57 s Wash delay 1 m Flush delay 1 m 40 s
Total scan time per sample 4 m 37 s
Nebulizer gas flow 0.86–0.88 l min−1 Auxiliary argon gas flow 1 l min−1 Plasma gas flow 15 l min−1
Power 1200 W
Scanning mode Peak hopping
Tuning solution sensitivity (counts per second per ppb)
Mg 94 000
Rh 560 000
Pb 700 000
ysis. The electrical conductivity in the remaining halves was measured along the profile. About 50 m of the ice core were cut in 744 sub-samples measuring from 6 to 10 cm in length. These sub-samples were decontaminated by removing their external layer with a stainless steel plane under a laminar-flow clean bench. The external debris was used to mea-sure 137Cs content to check dating (Sim˜oes et al., 2003). Sub-samples consisting of the inner part of the core were then taken in double-sealed pre-cleaned plastic vessels to a class 100 clean room and allowed to melt at about 25◦C in a laminar-flow bench. After melting, sub-samples were ho-mogenized by gentle shaking and then split in three parts in pre-cleaned plastic vessels, for analyses of insoluble aerosol content (Sim˜oes et al., 2003), major ionic content by Ion Chromatography (De Angelis et al., 2003a) and trace ele-ment content by ICP-MS (this work). Sub-samples not being immediately analyzed were wrapped in moisture-proof tape (Parafilm M, Structure Probe) to minimize exchanges with the atmosphere, and then they were frozen in cold chambers in double-sealed plastic bags.
2.1 Sample preparation and analysis by ICP-MS
Sub-samples to be analyzed by ICP-MS were allowed to melt and acid-digested before analysis to assure complete disso-lution of insoluble aerosol particles. These procedures were carried out at the Laboratoire des M´ecanismes et Transferts en G´eologie (LMTG), in Toulouse, France. Each sub-sample (5–10 ml) was evaporated in pre-cleaned Teflon beakers in a laminar-flow bench at 50◦C. The dry residues were dissolved for 24 h at 50◦C in a mixture of 1:1 HF:HNO3. The acid
so-lution was then evaporated and the dry residues were diluted in about 7 ml milli-Q water with 2% HNO3(Sholkovitz et al.,
A. Correia et al.: Trace elements in South America aerosol during 20th century 1339
Fig. 1. Ice core extraction site location at Illimani, in Eastern Bolivian Andes, South America. Distance between La Paz and Illimani is about
40 km.
known amount of a solution containing In and Re was added to each sample for calibration and elemental concentration determination by the internal standard with external calibra-tion method.
Experimental conditions for the ICP-MS system (Elan 6000, Perkin Elmer) are reported in Table 1. Each mea-sured elemental concentration is determined as the average of ten replicates, which in turn are averages of ten consec-utive sweeps. The relative standard deviations of such se-quence of measurements are typically under 5% for each el-emental concentration. The sample introduction system is composed of a cyclonic spray chamber, a Meinhard nebu-lizer and a Knauer desolvation unit. This system is very use-ful for the analysis of low concentration natural waters be-cause it increases the sensitivity by a factor of 5–10 relative to simple cross-flow nebulizers (Jakubowski et al., 1992). A fine aerosol cloud produced from the liquid sample enters the plasma torch and undergoes complete dissociation and ion-ization. The ions produced are separated according to their mass/charge ratios and detected using a discrete dynode elec-tron multiplier. The reproducibility of the results in this sys-tem, using a riverine water standard (SLRS-4, National Re-search Council of Canada) during 11 months of analysis was between 7–13% for Li, Na, Mg, Al, P, K, V, Cr, Co, Ni, Zn, Ga, As, Zr, Mo, Cd, Sb, Th, and U, and between 3–6% for Ti, Mn, Fe, Rb, Sr, Y, Ba, La, Ce, Pr, Nd, Sm, Yb, Lu, and Pb.
3 Results and discussions
3.1 General considerations
About 80% of annual precipitation at Illimani occurs during austral summer (DJF), having the Amazon Basin as the main moisture source (Vuille, 1999). Accordingly, prevailing wind pattern at 500 hPa is from E-SE during summer and from W-NW during winter. Precipitation during austral winter (JJA) also comes from Amazon, reaching the site as convective disturbances that break against the prevailing westerly flow (Grootes et al., 1989). As a consequence of this wind flow pattern, coupling of precipitation events to El Ni˜no Southern Oscillation (ENSO) is weak over the Eastern Andes (Vuille et al., 2000).
The applied dating methodology of annual layer count-ing results in about 80 years (1919–1999) of environmental record for the top 50 m of the Illimani ice core. Seasonal variations of several chemical species made possible a year-by-year identification of annual layers over the whole pro-file. Dating was checked against historical horizons (Sim˜oes et al., 2003), such as major volcanic events (eruptions of Pinatubo, 1991, and Agung, 1963) and atmospheric nuclear tests (1962–63).
Quality assurance of sample handling and decontamina-tion procedures was controlled with laboratory blanks. The average of two laboratory blanks per batch of 20–25 samples
Table 2. Average blank levels and standard deviations for handling during ice core sub-sampling, ICP-MS sample preparation, and average
instrumental ICP-MS detection limitsa
Element Average sub-sampling Average sample preparation Average instrumental detection limits (standard deviation) (standard deviation) (standard deviation)
(10−12g g−1) (10−12g g−1) (10−12g g−1) Li 2.9 (2.2) 50 (82) 13 (4.9) Na n.d. 1000 (200) 160 (190) Mg 87 (130) 910 (760) 39 (21) Al n.d. 1500 (470) 56 (68) P 510 (140) 400 (180) 450 (120) K n.d. 1300 (650) 230 (58) Ca 8900 (4900) 7100 (2600) 6600 (1200) Sc 3.1 (1.6) 0.74 (0.62) 6.2 (1.8) Ti 4.1 (2.0) 190 (99) 23 (5.3) V 4.5 (4.1) 50 (83) 9.5 (3.0) Cr 69 (21) 79 (45) 42 (38) Mn 6.6 (0.85) 14 (7.9) 5.2 (0.82) Fe 260 (58) 790 (120) 430 (110) Co 0.39 (0.21) 4.5 (4.1) 2.4 (0.90) Ni 2.1 (0.67) 89 (100) 37 (18) Cu n.d. 280 (480) 120 (210) Zn 19 (6.1) 920 (500) 56 (27) Ga 0.14 (0.010) 1.5 (2.3) 1.7 (0.44) Ge 2.4 (0.66) 1.4 (0.29) 6.5 (1.9) As 7.7 (13) 160 (210) 28 (9.0) Rb 0.39 (0.91) 1.2 (0.44) 1.6 (0.14) Sr 4.6 (2.7) 13 (3.7) 1.5 (0.51) Y 0.019 (0.0010) 0.44 (0.47) 0.37 (0.077) Zr 0.042 (0.014) 4.3(1.8) 5.0 (2.2) Nb 3.7 (3.1) 7.3 (3.5) 2.9 (0.38) Mo 2.7 (2.0) 5.9 (0.83) 25 (40) Pd 0.18 (0.064) 0.48 (0.48) 3.9 (1.3) Ag 1.9 (1.6) 2.7 (1.1) 2.3 (0.12) Cd n.d. 1.2 (0.33) 3.2 (1.3) Inb – – 7.8 (4.4) Sb 0.55 (0.068) 3.1 (1.65) 1.9 (0.47) Cs 1.2 (1.9) 0.47 (0.75) 0.89 (0.35) Ba 1.6 (0.50) 290 (200) 5.2 (2.6) La n.d. 1.3 (0.41) 0.57 (0.37) Ce n.d. 1.7 (0.61) 0.66 (0.39) Pr 0.0088 (0.0028) 0.17 (0.066) 0.26 (0.069) Nd n.d. 0.87 (0.11) 1.5 (0.77) Sm n.d. 0.15 (0.10) 0.99 (0.64) Yb 0.018 (0.0057) 0.097 (0.058) 0.39 (0.19) Lu 0.021 (0.0067) 0.11 (0.12) 0.15 (0.088) Hf 0.079 (0.013) 1.9 (2.8) 1.8 (1.5) Ta 1.2 (1.8) 2.3 (2.4) 4.9 (4.8) Reb – – 130(110) Tl 0.73 (1.0) 0.75 (0.43) 1.1 (0.85) Pb n.d. 14 (1.8) 2.1 (0.75) Th 0.88(1.3) 1.1 (1.2) 1.5 (1.3) U 0.055(0.040) 0.17 (0.18) 0.39 (0.31)
an.d.=not detected; bold values are below average detection limits; belements used as internal standards.
A. Correia et al.: Trace elements in South America aerosol during 20th century 1341
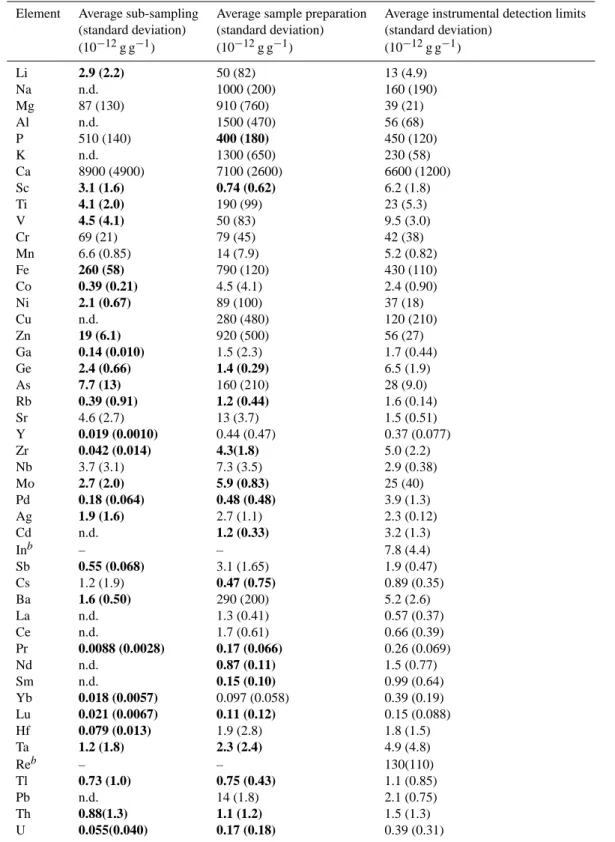
Fig. 2. Lithium concentration measured (a) for the full profile; (b) in the last 20 years of record. The strong seasonality is a common feature
of most elemental concentrations measured.
was subtracted from sample elemental concentrations. For the ICP-MS analyses, specific batches of blanks were used to assess analytical quality and detection limits, calculated as three standard deviations of instrumental blanks (i.e. milli-Q water with 2% HNO3). Detection limits were calculated
dy-namically along sample analyses, i.e., for each batch of about 10 samples, and only elemental concentrations above detec-tion limits were used in all calculadetec-tions in this work. Table 2 summarizes the average results of laboratory blanks for sub-sampling/handling of ice core sections and blanks of sample preparation for the ICP-MS analyses. For comparison, the average ICP-MS instrumental detection limits are listed in the same table. All concentrations in Table 2 are given with two significant figures in parts per trillion (i.e. 10−12g of the element per gram of liquid sample). Several average blank concentration values are under the average detection limits for the analyses performed. Typical sample elemental con-centrations lie in the range of hundreds to thousands of lab blank concentration levels and instrumental detection limits. The ICP-MS analyses resulted in continuous concentra-tion profiles for 45 chemical elements ranging from Li to U in the 744 samples. All elemental concentrations were
de-termined in several hundreds of samples, although a few of them presented more limited numbers due to the low concen-tration levels involved (e.g. Pd, 218 samples, Ag, 234 sam-ples, Ge, 377 samples and Ta, 389 samples). As an exam-ple of the results obtained, Fig. 2 shows the lithium elemen-tal concentration profile measured at Illimani along 80 years from 1919 to 1999. Figure 2a shows the full profile, while Fig. 2b shows the last 20 years of record in detail. Important regional sources of lithium nearby Illimani site are salt lakes (e.g. Salar de Uyuni), which constitute the World’s largest known Li reservoir (Risacher, 1992). Soil dust aerosol pro-duced mechanically by wind friction mobilizes Li-rich par-ticles and act as a regional source with variable strength de-pending on wind direction. As a consequence, average con-centration ratio between Li and Al at Illimani, as measured by ICP-MS, is about three times greater than the mean soil composition determined by Bowen (1979).
One notices in Fig. 2 the strong seasonality evidenced in the Li profile, a common feature for most elemental concen-trations measured. This seasonality is attributed to yearly precipitation regimes at the site, with low concentrations dur-ing the wet season (austral summer) and high concentrations
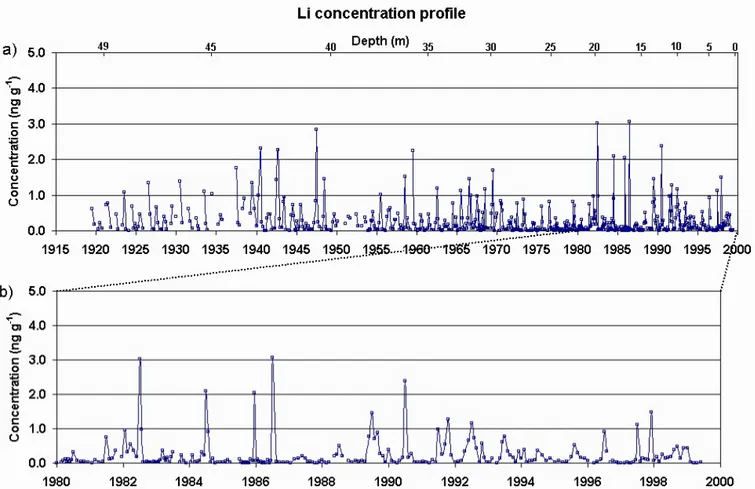
Fig. 3. Li concentration profiles measured for dry and wet seasons, and average dry season δ2H. Dashed line explained in the main text.
during dry season (austral winter). Stable isotopes (δ18O and
δ2H) are more depleted (more negative) for low concentra-tion samples, which is consistent with a greater amount of water precipitating between the moisture source (the Ama-zon Basin) and the site during summer compared to winter, also in agreement with a model proposed by Grootes et al. (1989). The higher concentrations during the dry austral win-ter are a consequence of combined lower precipitation, eas-ing aerosol mobilization due to dryness (De Angelis et al., 2003a), and increased snow sublimation due to availability of solar radiation.
Average annual net snow accumulation at the site is about 0.64 m of water (Sim˜oes et al., 2003), assuring the possibil-ity of high temporal resolution studies compared to ice cores from polar sites, where snow accumulation can be as low as a few centimeters of water per year (Delmas, 1992). Studying the observed seasonality exemplified in Fig. 2 is only pos-sible due to the high number of samples analyzed, which translates into high temporal resolution for the record. This is especially important for snow layers at the top of the core, where they are the least compressed by the weight of subse-quent snowfall, and so the measured elemental concentration profiles have more than ten samples per year. As depth in-creases the deposited layers get progressively compressed, reducing the margin for high-resolution sampling, and thus the concentration profiles show about 4 samples per year by the depth of 50 m. To the authors’ best knowledge this is
the first work studying such panoply of trace elements in ice cores with a continuous high temporal resolution, allowing seasonal segregation of samples to assess differences in at-mospheric chemistry conditions.
For the recent years shown in Fig. 2b, there is no clear re-lationship between Li concentration and ENSO events like 1983, 1997 (warm phase) or 1988 (cold phase), although ob-served concentrations in 1983 and 1997 are very low. This is in accordance with the attributed Eastern major origin for moisture reaching the site, which implies a weak coupling to ENSO-related atmospheric processes (Vuille et al., 2000). 3.2 Seasonal segregation of samples
The detailed study of measured elemental concentration pro-files, such as the Li example in Fig. 2, suggests a bimodal-like behavior for the record, with successive periods of low concentration during the wet season followed by sharp in-creases in the dry season. In order to investigate these two states of the atmosphere, or weather regimes, each sample was classified as belonging to the “dry” or to the “wet” sea-son. This classification was done by analyzing individually each sample and ascribing a classification category such as “dry”, “wet” or “transition”, according to dating and con-centration levels observed for all measured elements. In this work only pure “dry” (76 cases) or “wet” samples (190 cases) are analyzed, avoiding more complex transition cases. In this classification scheme, one has forcefully fewer “dry” than
A. Correia et al.: Trace elements in South America aerosol during 20th century 1343
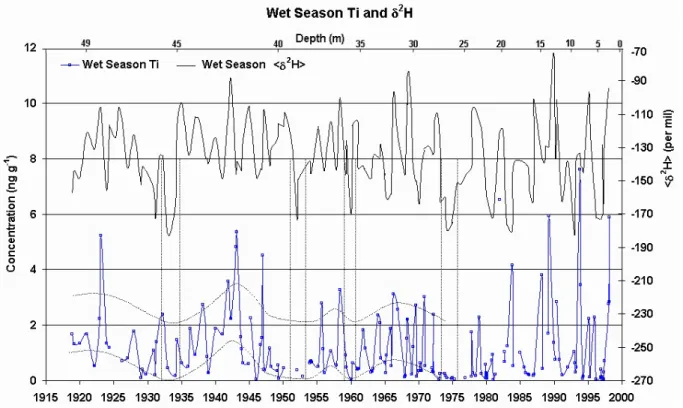
Fig. 4. Ti concentration profile for wet season samples, and average wet season δ2H. Dashed lines explained in the main text.
“wet” samples, as they correspond to periods with less pre-cipitation along the years.
Figure 3 shows the resulting dry and wet season concen-tration profiles for lithium. Wet season concenconcen-trations are very low compared to dry season ones, as expected from the discussion before. There is an oscillatory pattern for the con-centrations during dry seasons in the beginning of 20th cen-tury, with a period ranging from 2 to 5 years, superimposed on an increasing trend. This is a common feature for most elements measured as well as for insoluble aerosol particles, and suggests a relationship to the total amount of solar radi-ation and precipitradi-ation reaching the site, modulating the ob-served concentrations. The pattern gets more complex after the dashed line by mid-50’s, when the amplitude of dry sea-son concentrations suddenly changes. Accordingly, there are distinct patterns for dry season δ2H in the two halves of the century, especially after 1955, as shown in Fig. 3. The δ2H series represents measurements of δ2H made at the Labora-toire des Sciences du Climat et de l’Environnement (LSCE, Gif-sur-Yvette, France), averaged over the same dry season samples. The full analysis of stable isotopic content in Il-limani ice core is given by Ramirez et al. (2003). Stable isotopes in the Andes are inversely related to temperature and precipitation history for short-term fluctuations, but re-main positively related to temperature in long-term variations (Thompson, 2000). In this case the δ2H series in Fig. 3 indi-cates a shift towards warmer temperatures during wintertime (dry season), starting by mid-70s. This suggests a threat to the perspective of future research on Andean ice cores since
low wintertime temperatures are key to preserve ice-sheet in-tegrity.
Another important element, Ti, gives more clues about wet season concentrations that do not appear in Li profile, be-cause of the low concentration values involved. Ti is a typi-cal element associated with regional soil dust aerosol, and re-produces well the behavior of other elements from that same source. Figure 4 shows the wet season concentration profile for Ti, together with the corresponding averages of wet sea-son δ2H. There are pronounced local Ti concentration min-ima around 1930, 1950, 1960 and 1975 assigned by vertical dashed lines, which coincide with minima in the δ2H series. For the most δ2H depleted wet seasons one has wetter condi-tions and largest amounts of precipitation, and then the mea-sured concentrations get to their lowest values. The afore-mentioned years mark roughly five multi-year periods which can more easily be identified in the δ2H series in Fig. 4: from the beginning of the record up to 1930, 1930–50, 1950–60, 1960–75, and then from 1975 to the end at 1999. For all but the last of these periods, concentration values during the wet season experience cycles during which they grow from a minimum value to a maximum value, and then start dimin-ishing towards the next minimum, as roughly indicated by the curved dashed lines. The δ2H record after 1975 is dif-ferent from the years before, but there is no clear trend as it was the case for dry seasons, implying roughly stable aver-age temperatures during summer, but maybe with a different periodicity compared to the years before 1975.
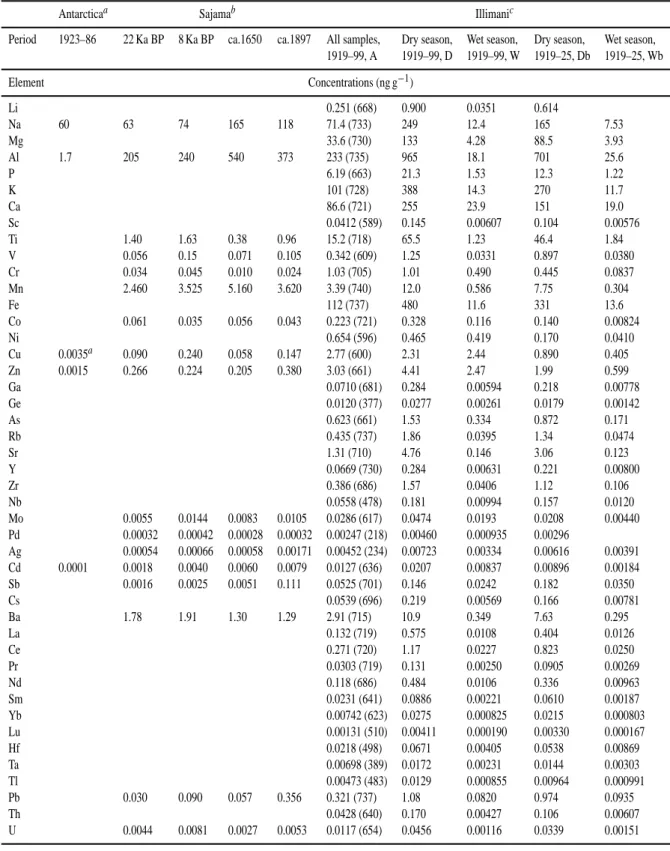
Table 3. Elemental concentrations measured at Illimani and other locations
Antarcticaa Sajamab Illimanic
Period 1923–86 22 Ka BP 8 Ka BP ca.1650 ca.1897 All samples, Dry season, Wet season, Dry season, Wet season, 1919–99, A 1919–99, D 1919–99, W 1919–25, Db 1919–25, Wb Element Concentrations (ng g−1) Li 0.251 (668) 0.900 0.0351 0.614 Na 60 63 74 165 118 71.4 (733) 249 12.4 165 7.53 Mg 33.6 (730) 133 4.28 88.5 3.93 Al 1.7 205 240 540 373 233 (735) 965 18.1 701 25.6 P 6.19 (663) 21.3 1.53 12.3 1.22 K 101 (728) 388 14.3 270 11.7 Ca 86.6 (721) 255 23.9 151 19.0 Sc 0.0412 (589) 0.145 0.00607 0.104 0.00576 Ti 1.40 1.63 0.38 0.96 15.2 (718) 65.5 1.23 46.4 1.84 V 0.056 0.15 0.071 0.105 0.342 (609) 1.25 0.0331 0.897 0.0380 Cr 0.034 0.045 0.010 0.024 1.03 (705) 1.01 0.490 0.445 0.0837 Mn 2.460 3.525 5.160 3.620 3.39 (740) 12.0 0.586 7.75 0.304 Fe 112 (737) 480 11.6 331 13.6 Co 0.061 0.035 0.056 0.043 0.223 (721) 0.328 0.116 0.140 0.00824 Ni 0.654 (596) 0.465 0.419 0.170 0.0410 Cu 0.0035a 0.090 0.240 0.058 0.147 2.77 (600) 2.31 2.44 0.890 0.405 Zn 0.0015 0.266 0.224 0.205 0.380 3.03 (661) 4.41 2.47 1.99 0.599 Ga 0.0710 (681) 0.284 0.00594 0.218 0.00778 Ge 0.0120 (377) 0.0277 0.00261 0.0179 0.00142 As 0.623 (661) 1.53 0.334 0.872 0.171 Rb 0.435 (737) 1.86 0.0395 1.34 0.0474 Sr 1.31 (710) 4.76 0.146 3.06 0.123 Y 0.0669 (730) 0.284 0.00631 0.221 0.00800 Zr 0.386 (686) 1.57 0.0406 1.12 0.106 Nb 0.0558 (478) 0.181 0.00994 0.157 0.0120 Mo 0.0055 0.0144 0.0083 0.0105 0.0286 (617) 0.0474 0.0193 0.0208 0.00440 Pd 0.00032 0.00042 0.00028 0.00032 0.00247 (218) 0.00460 0.000935 0.00296 Ag 0.00054 0.00066 0.00058 0.00171 0.00452 (234) 0.00723 0.00334 0.00616 0.00391 Cd 0.0001 0.0018 0.0040 0.0060 0.0079 0.0127 (636) 0.0207 0.00837 0.00896 0.00184 Sb 0.0016 0.0025 0.0051 0.111 0.0525 (701) 0.146 0.0242 0.182 0.0350 Cs 0.0539 (696) 0.219 0.00569 0.166 0.00781 Ba 1.78 1.91 1.30 1.29 2.91 (715) 10.9 0.349 7.63 0.295 La 0.132 (719) 0.575 0.0108 0.404 0.0126 Ce 0.271 (720) 1.17 0.0227 0.823 0.0250 Pr 0.0303 (719) 0.131 0.00250 0.0905 0.00269 Nd 0.118 (686) 0.484 0.0106 0.336 0.00963 Sm 0.0231 (641) 0.0886 0.00221 0.0610 0.00187 Yb 0.00742 (623) 0.0275 0.000825 0.0215 0.000803 Lu 0.00131 (510) 0.00411 0.000190 0.00330 0.000167 Hf 0.0218 (498) 0.0671 0.00405 0.0538 0.00869 Ta 0.00698 (389) 0.0172 0.00231 0.0144 0.00303 Tl 0.00473 (483) 0.0129 0.000855 0.00964 0.000991 Pb 0.030 0.090 0.057 0.356 0.321 (737) 1.08 0.0820 0.974 0.0935 Th 0.0428 (640) 0.170 0.00427 0.106 0.00607 U 0.0044 0.0081 0.0027 0.0053 0.0117 (654) 0.0456 0.00116 0.0339 0.00151
aWolff et al., 1999. Snowpit at Coats Land, Antarctica, 77◦
34’ S, 25◦22’ W, 1420 m asl. Number of samples about 80 (read from graph). Cu average before 1970: ∼0.0025 ng g−1(read from graph);
bFerrari et al., 2001. One sample per date from Sajama ice core, Bolivia, 18◦06’ S, 68◦53’ W, 6542 m asl;
cThis work. Number of samples used for the averages: number in parenthesis (all samples), 76 (dry season), 190 (wet season), 7 (dry season
A. Correia et al.: Trace elements in South America aerosol during 20th century 1345 3.3 Comparison with other works
Comparison of measured elemental concentrations with val-ues registered in other locations is important, although diffi-cult. Most elements presented here are often not measured in ice core related works, either for a matter of adequacy of the measuring system or due to a more restrictive scientific approach designed to address a specific question. Another problem is the statistical robustness of available data, since quite frequently one has few measured data points, thus com-promising the significance or reliability of the results. In Ta-ble 3 averages of elemental concentrations in this work are compared to measurements at other locations in Antarctica (Wolff et al., 1999) and in the Western Andes (Ferrari et al., 2001). Samples from these sites were not acid-digested be-fore analysis, which may be a problem for the detection of insoluble elements, especially in the case of heavy aerosol-loaded Andean samples. For the site in Coats Land, Antarc-tica (200 km from sea shore), one has averages of about 80 samples (as read from graph) of elemental concentrations measured from a snowpit representing a time series from 1923 to 1986. In Western Andes the measurements were per-formed on four samples from an ice core extracted at Sajama ice cap, Bolivia (about 200 km SW of Illimani), representing different ages before the 20th century. Although the Sajama ice core site is located in the Bolivian Andes, precipitation and weather regimes are quite different from the conditions at Illimani: while the main source of moisture reaching Il-limani is located to its East (Amazon Basin, and ultimately, the Atlantic Ocean), Sajama is impacted by moisture coming from the Pacific Ocean. Also Sajama presents a lower av-erage snow accumulation rate (0.40 m H2O/year) (Ferrari et
al., 2001) compared to Illimani (0.64 m H2O/year) (Sim˜oes
et al., 2003).
The elemental concentrations at Illimani were averaged following different methodologies in order to encompass di-verse possibilities for comparison with the results in Table 3. First, a global average of all 744 samples was computed, cor-responding to the time period from 1919 to 1999 (referred in the text as A). Then, the corresponding seasonal averages for the same period were computed using 76 samples for the dry seasons (marked as D) and 190 for the wet seasons (W). As discussed before, dry season samples give average up-per range limits for the measured concentrations, while wet season averages correspond to lower range limits. Also, av-erages for dry and wet season concentrations (referred as Db and Wb) were calculated for the years at the beginning of the record (7 and 9 samples respectively), from 1919 to 1925, to estimate elemental concentration ranges at the onset of the 20th century.
In Table 3 one notices that several elemental concentra-tions measured at Sajama ice cap are compatible with the val-ues recorded at Illimani. For Na, the range covered by W to D samples brackets the values measured for Sajama. Although this element is usually associated with sea salt aerosol,
Fer-rari et al. (2001) show that crustal enrichment factors for this element are close to unity at Sajama, and it can be associated to soil dust. In Antarctica the measured Na is well within the range measured at Illimani and Sajama, but in this case the origin should be coastal sea salt aerosol, since the frac-tion of exposed soil and the overall aerosol loading are small compared to the Andean sites. This is also reflected in the low Al concentration recorded in Antarctica, compared to Il-limani and Sajama. The concentration range defined by W to D averages at Illimani also encompasses the values at Sa-jama for Mn, Mo, Ba and U, especially when one considers the natural environmental variability expressed as the sample standard deviations (not shown) of the averages calculated for Illimani.
In general Ti, V and Cr measured at Illimani are above the measured values at Sajama. This could be related to different sensitivities of each site to the impact of soil dust aerosol sources, but one may not preclude differences in sam-ple preparation (acidic digestion) discussed before as a possi-ble explanation, since partial ionization of insolupossi-ble aerosol particles may result in decreased or unstable measurements of concentrations for some elements (Freydier, 1997). In the case of Cr, one notices at Illimani an increase of seasonal concentration ranges along 20th century, probably due to an-thropogenic emissions, since this element shows an average wet season enrichment factor of about 102(cf. Fig. 5 discus-sion below).
For Co, the concentration ranges Wb to Db, from the be-ginning of the 20th century at Illimani explain the values recorded at Sajama. The Co average range W to D for the full record suggests a higher level of this element present in the atmosphere for the subsequent years. For Pb the situation is similar, with Wb to Db ranges covering the measurements at Sajama, but also W to D. Remarkably, both ranges are quite similar, i.e., the average ranges of Pb concentration be-tween wet and dry seasons at the beginning of the century are close to the average for the whole record. This could be re-lated to the impact of different sources along the record, like Ag mining (where Pb is rejected openly in the atmosphere) and Pb addition to automotive fuel in the second half of 20th century.
Cd measured at Sajama also corresponds to the range ob-served at Illimani at the beginning of the century (Wb to Db), but the average of all samples in the profile, A, is about one order of magnitude greater than top Db values, evidencing the increase in Cd atmospheric concentrations along the cen-tury. This century-average is nearly two orders of magnitude greater than the average concentration in Antarctica for about the same period (1923–1986).
The Sajama sample dated ca. 1897 has Sb concentration considerably higher than the values measured at the same site for the other three samples. This value is within the W to D and Wb to Db concentration ranges measured at Illimani. The low Sb concentration values for the three oldest sam-ples at Sajama may be due to a limited source strength over
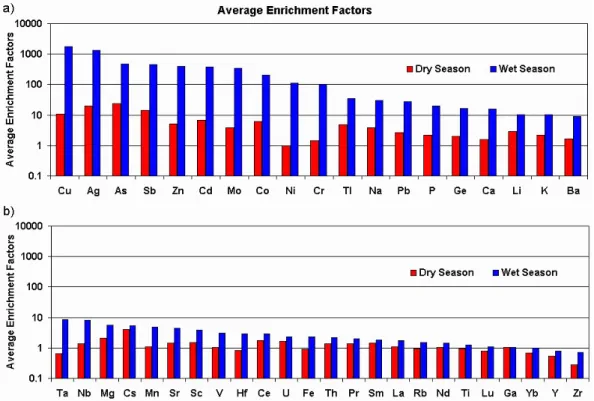
Fig. 5. Average enrichment factors for the measured elements during dry and wet seasons: (a) heavily and moderately enriched elements; (b) lightly enriched elements.
the site, which could indicate a growing impact trend over the Andes, but sample preparation methodology could also account for part of these differences.
The Zn average concentration in Antarctica is about 2000 times below Zn average for the whole record at Illimani, while average Cu concentration in Antarctica before the 1970s is about three orders of magnitude below century-average at Illimani. In the case of Ag, Pd, Cu and Zn, the concentration values at Illimani are always higher than those registered at Sajama. This could be due to a greater impact of mining activities upon Illimani than Sajama. Notice that Cu D and W averages are very similar, in accordance with a mining, rather non-seasonal, origin for this element. Fur-ther discussion on heavy metals measured at Illimani will be given elsewhere.
3.4 Enrichment factors
The concentration profiles for Li (Fig. 3) and Ti (Fig. 4) show general features of the record, which are echoed by most of the measured elements related to regional aerosol sources. An important tool used to estimate the contribution of other sources are enrichment factors, calculated from some refer-ence source. Enrichment factors (EF ) were calculated using the conventional equation:
EF = [X/Ref ]sample [X/Ref ]ref erence
(1)
where X is the concentration of the element one wants to cal-culate the enrichment factor for, and Ref is the concentration of the reference element to be used. After a careful study of several possible choices, Al was assumed as the reference element for soil dust aerosol in this work.
Here the reference concentration ratios correspond to the average soil composition determined by Bowen (1979). This choice poses some difficulties, since there are fractionation processes occurring at the interface between the soil and the atmosphere when the aerosol is produced. Another disad-vantage arises from the fact that one deals with the mean soil composition, which may be different from regional soil con-ditions, such as the presence of the Li-rich salars. Nonethe-less, using this source allows other researchers to compare their results with the ones presented in this work, and so this procedure was adopted.
Figure 5 shows the averages of enrichment factors calcu-lated for all the measured elements, for dry and wet seasons. While wet season elemental concentrations are lower than dry season concentrations, their enrichment factors are al-ways more elevated for all measured elements. This indicates that during the dry winter season the aerosol reaching the site tends to be closer to soil dust, maybe because of enhanced production of regional aerosol due to soil dryness, while dur-ing wet summer the regional coarse soil dust aerosol is more efficiently removed by wet deposition processes than fine remotely-transported aerosol from other sources. Certainly
A. Correia et al.: Trace elements in South America aerosol during 20th century 1347
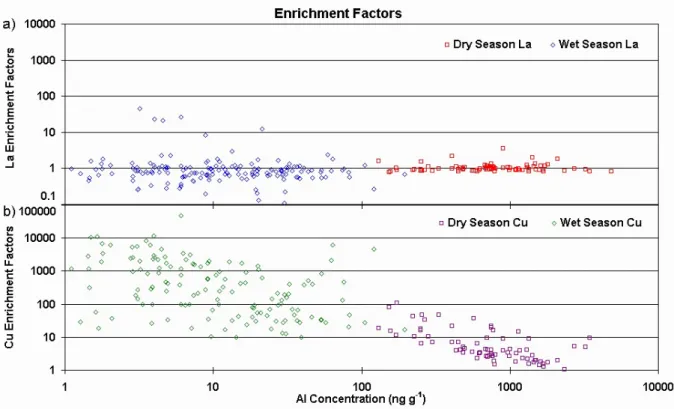
Fig. 6. Crustal enrichment factors and soil dust tracer concentration during dry (76 samples) and wet (190 samples) seasons for (a) La and (b) Cu.
this adds another perspective for the relevance of wet sea-son samples, with moisture coming from Amazon Basin to the East, as one considers evaluating the impact of remote sources to the site.
Considering wet season enrichments, one can distinguish at least three groups of elements:
(a) heavily enriched elements, with EF >100: Cu, Ag (few samples), As, Sb, Zn, Cd, Mo, Co, Ni and Cr;
(b) moderately enriched elements, with 100<EF <10 ap-proximately: Tl, Na, Pb, P, Ge, Ca, Li, K and Ba; (c) lightly enriched elements, with EF <10: Ta, Nb, Mg,
Cs, Mn, Sr, Sc, V, Hf, Ce, U, Fe, Th, Pr, Sm, La, Rb, Nd, Ti, Lu, Ga, Yb, Y, Zr.
Heavily enriched elements are the most prone to originate from other sources than soil dust. Several elements in this group, like Cu, As and Cd for example, are often associ-ated with pollution sources generassoci-ated by human economic activities. Hong et al. (1996) list Chile, to the Southwest of Illimani, as the world’s largest Cu producer. Together with Peru to the North, the two countries (Fig. 1) are among the top 5 main producers of Cu today (Hong et al., 1996), which can explain this element’s high average enrichment. In the group of moderately enriched elements one may have natu-ral species that come from other sources than purely from soil
dust, like Na, Ca and Li (from salars). P and K are elements that take part in natural biogeochemical cycles in Amazonia, upwind from the site. Zn is also present in natural biogenic emissions, but the high enrichment factors observed suggest rather an anthropic influence. Pb frequently has anthropic origins, and a possible explanation for the observed enrich-ments could be mining activities at Chacaltaya to the North of Illimani or leaded automotive gasoline still in use in La Paz (R. Gallaire, personal communication, 2002). Elements with enrichments close to one, like Fe, La and Ti, are as-sociated with the soil dust source, but clearly these values represent averages of all cases, so there may occur special situations where samples deviate from the mean value due to the influence of other sources.
3.5 Characterization of regional soil dust aerosol
In order to investigate the influence of different sources upon the measured elemental concentrations, one may examine the relationship between EF and Al concentration, as shown in Fig. 6 for La (a) and Cu (b). La is a rare-earth element origi-nating from soil dust and with no known other sources in the region, while Cu may originate from mining activities. In Fig. 6a the EF for La show a stable pattern around unity, for both dry and wet seasons, across four orders of magnitude of Al concentration. In other words, the measured La/Al con-centration ratios are near the average soil dust composition,
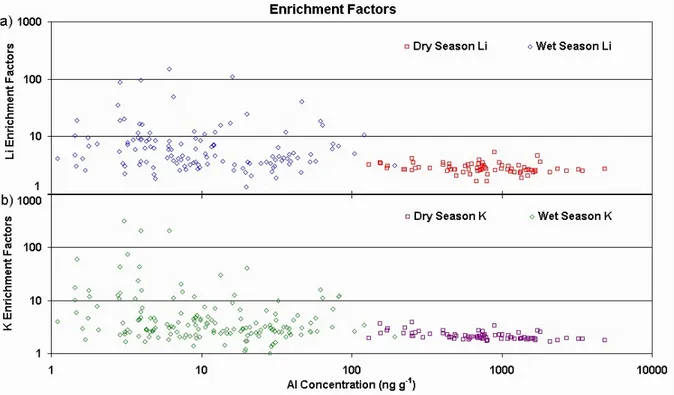
Fig. 7. Crustal enrichment factors and soil dust tracer concentration during dry (76 samples) and wet (190 samples) seasons for (a) Li and (b) K.
irrespective of the soil dust tracer concentration. Wet season La EF are noisier than the dry season’s, but there are more wet season samples, so this may be a mere statistical fluctu-ation effect. In contrast, Fig. 6b shows four orders of mag-nitude of Cu enrichment across the same range of Al con-centrations. As the samples get more heavily loaded with aerosol (i.e. high Al concentration), Cu/Al concentration ra-tios in dry and wet season samples tend toward mean soil dust values, as the regional aerosol outweighs the influence of other sources.
The pattern shown in Fig. 6b is a clear indication of the existence of other sources, which grow in importance as the aerosol loading decreases in the samples. The same relation-ship between EF and Al concentration was investigated for all other measured elements. Figure 7 shows the EF across Al concentrations for Li and K. As discussed before, possi-ble sources for enriched Li are salars present in the region, while K has a variety of possibilities, among which include biomass burning products coming from the Amazon Basin. The patterns for Li and K in Fig. 7 lie intermediate between the ones for La and Cu shown in Fig. 6. Accordingly, they were classified as belonging to the moderately enriched el-ements in Fig. 5a, due to their average enrichment factors. For both Li and K in Fig. 7 the wet season samples show EF value ranges of about two orders of magnitude, implying that most impact from remote aerosol sources occur during the summer season in the region. The biomass burning season
in Amazon Basin corresponds to the dry season, when thick haze plumes leave the region yearly (Longo et al., 1999). This implies that the greatest K EF peaks during the wet season must come from other sources, as this element partic-ipates in biogeochemical cycles in Amazonia. Statistically, if any signal from biomass burning plumes during the dry sea-son gets to Illimani, it must be at least partly obscured by the stronger winter regional aerosol source, which forces the EF to their lowest values.
In Fig. 7 the lowest EF during the dry season for both Li and K are clearly situated above one. As they form a plateau of EF at high aerosol loadings (i.e. high Al concentrations), one may consider this ratio as the “true” (or effective) char-acteristic ratio for the precipitating aerosol at Illimani, which may be different from the mean soil composition ratio due to differences in the local soil composition and due to fractiona-tion during aerosol mobilizafractiona-tion. The hypothesis behind this assumption is that at the highest values of aerosol loadings the only source acting upon the site is the regional soil dust aerosol, and thus the conclusions drawn from it may be con-sidered valid as long as this hypothesis holds.
Most measured elements show the plateau of EF for high Al concentrations in the dry season. By studying in detail each element and plotting histograms of their EF , one can define the plateau levels as they peak in the lowest bins of the histograms. Figure 8 outlines this procedure for Cd en-richment factors during the dry season. This element shows
A. Correia et al.: Trace elements in South America aerosol during 20th century 1349
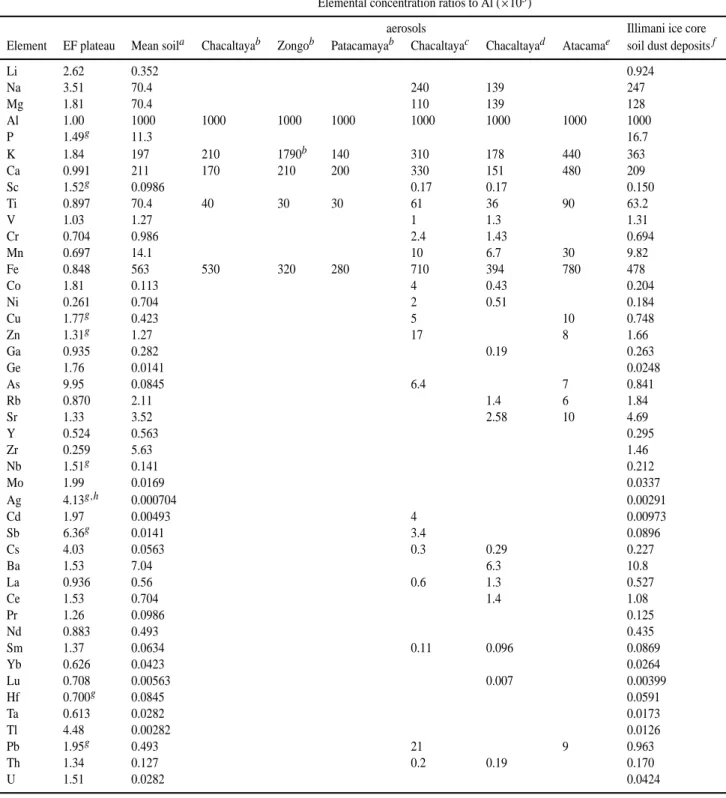
Table 4. EF plateaus, elemental ratios to Al (×103) in mean soil composition and in several measurements of Andean aerosols, compared to Illimani ice core background soil dust deposits
Elemental concentration ratios to Al (×103)
aerosols Illimani ice core
Element EF plateau Mean soila Chacaltayab Zongob Patacamayab Chacaltayac Chacaltayad Atacamae soil dust depositsf
Li 2.62 0.352 0.924 Na 3.51 70.4 240 139 247 Mg 1.81 70.4 110 139 128 Al 1.00 1000 1000 1000 1000 1000 1000 1000 1000 P 1.49g 11.3 16.7 K 1.84 197 210 1790b 140 310 178 440 363 Ca 0.991 211 170 210 200 330 151 480 209 Sc 1.52g 0.0986 0.17 0.17 0.150 Ti 0.897 70.4 40 30 30 61 36 90 63.2 V 1.03 1.27 1 1.3 1.31 Cr 0.704 0.986 2.4 1.43 0.694 Mn 0.697 14.1 10 6.7 30 9.82 Fe 0.848 563 530 320 280 710 394 780 478 Co 1.81 0.113 4 0.43 0.204 Ni 0.261 0.704 2 0.51 0.184 Cu 1.77g 0.423 5 10 0.748 Zn 1.31g 1.27 17 8 1.66 Ga 0.935 0.282 0.19 0.263 Ge 1.76 0.0141 0.0248 As 9.95 0.0845 6.4 7 0.841 Rb 0.870 2.11 1.4 6 1.84 Sr 1.33 3.52 2.58 10 4.69 Y 0.524 0.563 0.295 Zr 0.259 5.63 1.46 Nb 1.51g 0.141 0.212 Mo 1.99 0.0169 0.0337 Ag 4.13g,h 0.000704 0.00291 Cd 1.97 0.00493 4 0.00973 Sb 6.36g 0.0141 3.4 0.0896 Cs 4.03 0.0563 0.3 0.29 0.227 Ba 1.53 7.04 6.3 10.8 La 0.936 0.56 0.6 1.3 0.527 Ce 1.53 0.704 1.4 1.08 Pr 1.26 0.0986 0.125 Nd 0.883 0.493 0.435 Sm 1.37 0.0634 0.11 0.096 0.0869 Yb 0.626 0.0423 0.0264 Lu 0.708 0.00563 0.007 0.00399 Hf 0.700g 0.0845 0.0591 Ta 0.613 0.0282 0.0173 Tl 4.48 0.00282 0.0126 Pb 1.95g 0.493 21 9 0.963 Th 1.34 0.127 0.2 0.19 0.170 U 1.51 0.0282 0.0424
aBowen, 1979;bLawson and Winchester, 1979. 2–4 samples by site (all in Bolivia), from July 1976–March 1977, aerosol particles above
4 µm. K at Zongo from biogenic origin;cAdams et al., 1977. All aerosol particle sizes;d Adams et al., 1980. All aerosol particle sizes, samples from July 1975–August 1977;eRojas et al., 1990. 34 samples from Northern Atacama desert, Chile;f this work;gelements that do not form a clear EF plateau;hfew samples.
Fig. 8. Dry season Cd enrichment factors and Al concentration. On the inset, the peak in the histogram corresponds to the plateau denoted
by the horizontal red line.
a clear EF plateau as one moves towards high Al concen-trations. Using different bin steps for histograms of its EF , as illustrated on the inset of Fig. 8, one gets the lowest peak by 1.97, and this can be defined as the plateau EF for Cd, as shown by the red horizontal line in Fig. 8. This process can be repeated for all measured elements, although some of them may be ill posed, as they do not form a clear plateau level. In these cases the level found may be considered ten-tative, as a first approximation.
With these EF plateau levels for all elements one may proceed with a renormalization of the reference source ele-mental ratios, i.e., to calculate the effective characteristic ra-tios that give unitary EF for samples at the plateau, as they represent the regional soil dust aerosol source deposited at Il-limani. Table 4 summarizes these results for all measured el-ements with three significant figures, showing the calculated
EFplateau levels, the elemental concentration ratios to Al in the original soil composition source by Bowen (1979), sev-eral measurements of aerosol elemental concentrations ratios in Andean sites (Lawson and Winchester, 1979; Adams et al., 1977; Adams et al., 1980; Rojas et al., 1990), and also the values of elemental ratios to Al, calculated by the proce-dure depicted above for characterizing the soil dust aerosol deposited in Illimani ice core.
Most elements present EF plateau levels within a factor of two above or below the mean soil composition, with excep-tions of high EF like As (9.95), Na (3.51) and Li (2.62), but
also with low EF plateaus like Ni (0.261) and Zr (0.259). These departures reflect local differences of soil composi-tion and also fraccomposi-tionacomposi-tion occurring during aerosol produc-tion, as discussed before, but one has to consider they may also arise in part due to local Al concentration divergences from the reference source: since this element was chosen as soil dust tracer it is the only parameter held constant, so any eventual fluctuations will influence the EF calculated for the other elements. At any rate, the identification of EF plateau levels is based on a statistical approach performed over a confined universe of samples during the 20th century, which may embed background levels of anthropic soil pol-lution. For instance, Ferrari et al. (2001) suggest the exis-tence of significant anthropogenic emissions of heavy metals even before the 20th century (Table 3). The aerosol charac-terization, based on elemental ratios to Al shown in Table 4, corresponds to the effective content of background soil dust aerosol for the 20th century as trapped by snow, irrespective of other factors like “true” soil composition or fractionation during mobilization.
In Table 4, comparing the elemental ratios to Al deter-mined on Andean aerosol samples and the ratios on Illimani soil dust aerosol determined by the plateau method, remark-able matches arise for several elements: Na, Mg, K, Ca, Sc, Ti, V, Mn, Fe, Ga, Rb, Cs, La, Ce, Sm and Th are present both in the Andean aerosol determinations as well as in Illimani soil dust at about the same proportion to Al. These elements
A. Correia et al.: Trace elements in South America aerosol during 20th century 1351 are most likely related to natural soil dust produced
region-ally. However, as atmospheric aerosols correspond to a mix-ture of several natural and anthropic sources, one does not expect identical concentration ratios to Al for all elements present in aerosol samples and at Illimani soil dust. In fact, anthropogenic pollution-related elements present higher con-centration ratios to Al in atmospheric aerosols than at soil dust derived from Illimani: Cr, Co, Ni, Cu, Zn, As, Cd, Sb and Pb. Notice, in particular, the high ratios for Cu/Al in Chile (Atacama) and Pb/Al in Bolivia (Chacaltaya), due to anthropogenic activities in the region. Almost all measured elements at Atacama desert by Rojas et al. (1990), except for Pb and Zn, present higher concentrations relative to Al than Bolivian determinations, due to the existence of a signif-icant source of heavy metals in Chile linked to Cu production (Hong et al., 1996).
4 Conclusions
The measurement of concentrations for 45 elements in Il-limani ice core by ICP-MS continuously during the 20th century allowed studying elemental profiles at high tempo-ral, mostly sub-seasonal, resolution. With seasonal segrega-tion of samples thus made possible, one observes during dry austral winter high elemental concentrations and low crustal enrichment factors. During this dry season regime, remote sources get obscured by regional soil dust aerosol, which may render difficult the identification of aerosol sources like biomass burning from the Amazon Basin. The regional Il-limani soil dust aerosol is more easily produced during dry winter in comparison to wet season conditions due to dimin-ishing of wet deposition removal processes and parallel en-hancement of soil dryness. For wet austral summer the situ-ation is the opposite, with low elemental concentrsitu-ations and samples often showing high crustal enrichment factors. Dur-ing the wet season, aerosol deposition processes limit the im-pact of regional soil dust aerosol, allowing the identification of elements with high crustal enrichments associated with anthropic sources, as well as moderately enriched elements from other possible sources of long-range transported aerosol (e.g. salars, Amazonia).
The stable isotopic record, also analyzed under the sea-sonal segregation scheme, indicates a warming of winter-time average temperatures after the 1970s, but with no clear trend for summer. The elemental concentrations record for wet seasons show a degree of modulation together with the stable isotopic record, as long-term, multi-year intervals. In these intervals most isotopic depleted years correspond to greatest amounts of precipitation and consequently to low-est recorded elemental concentrations.
Comparison of Illimani record to a few samples from an-other ice core in the Andes (Sajama, Western Bolivian An-des), shows that the ranges of average elemental concentra-tions between dry and wet seasons at Illimani correspond in
general to the values at Sajama. Differences arise mostly for species of anthropic origin, as indicated in Table 3, and are related to the proximity of Illimani to significant local sources. Mining-related species are more enriched at Illi-mani than Sajama even in the beginning of 20th century.
A detailed chemical characterization for the background soil dust aerosol deposited in the Andes was derived. This effective characterization, shown in Table 4 as concentration ratios to aluminum, was only made possible by following a research paradigm focused on the statistical robustness of elemental concentration measurements, performed over Illi-mani samples covering 80 years during 20th century.
Acknowledgements. A. Correia thanks the IRD fieldwork team for extraction and transportation of the ice cores, the LGGE personnel for fully supporting this work, Dr. Michel Valladon from LMTG for making lab work possible for all those 744 samples and E. Ramirez from LSCE for measurements of stable isotopes content. This work was supported by CNPq grant 142.683/98-1 and CAPES grant BEX 0458/99-6. Ice core drilling expedition photos by Bernard Pouyaud.
References
Adams, F., Dams, R., Guzman, L., and Winchester, J. W.: Back-ground aerosol composition on Chacaltaya mountain, Bolivia, Atm. Env., 11, 629–634, 1977.
Adams, F., Van Craen, M., Van Espen, P., and Andreuzzi, D.: The elemental composition of atmospheric aerosol particles at Cha-caltaya, Bolivia, Atm. Env., 14, 879–893, 1980.
Bowen, H. J. M.: Environmental Chemistry of the Elements, Aca-demic Press, London, 1979.
Clausen, H. B. and Langway Jr., C. C.: The ionic deposits in po-lar ice cores, in: The Environmental Record in Glaciers and Ice Sheets, Oeschger, H. and Langway Jr., C. C. (Eds), John Wiley and Sons, 225–247 1989.
De Angelis, M., Bonnaveira, H., Taupin, J.-D., Correia, A., Ramirez, E., and Delmas, R. J.: Aerosol chemistry (major ions) in the Bolivian Andes from the Illimani ice core, Atm. Chem. Phys., in preparation, 2003a.
De Angelis, M., Sim˜oes, J. C., Bonnaveira, H., Taupin, J.-D., and Delmas, R. J.: Volcanic eruptions recorded in the Illimani ice core (Bolivia): 1918–98 and Tambora periods, Atm. Chem. Phys. Discuss., 3, 2427–2463, 2003b.
Delmas, R. J.: Environmental information from ice cores, Rev. Geo-phys., 30, 1–21, 1992.
Ferrari, C. P., Clotteau, T., Thompson, L. G., Barbante, C., Cozzi, G., Cescon, P., Hong, S., Maurice-Bourgoin, L., Francou, B., and Boutron, C. F.: Heavy metals in ancient tropical ice: initial results, Atm. Env., 35, 5809–5815, 2001.
Freydier, R.: Chimie des pr´ecipitations en Afrique intertropicale: anions et cations majeurs, ´el´ements traces et acides organiques, Ph.D. Thesis, Universit´e Paul Sabatier, Toulouse, 1997. Freydier, R., Dupr´e, B., and Lacaux, J. P.: Precipitation chemistry
in Intertropical Africa, Atm. Env., 32, 749–765, 1998.
Grootes, P. M., Stuiver, M., Thompson, L. G., and Mosley-Thompson, E.: Oxygen isotope changes in tropical ice, Quelc-caya, Peru, J. Geophys. Res., 94, 1187–1194, 1989.
Hong, S., Candelone, J.-P., Soutif, M., and Boutron, C. F.: A recon-struction of changes in copper production and copper emissions to the atmosphere during the past 7000 years, Sci. Total Env., 188, 183–193, 1996.
Jakubowski, N., Feldmann, I., and Stuewer, D.: Analytical im-provement of pneumatic nebulization in ICP-MS by desolvation, Spectrochim. Acta, 47B, 107–118, 1992.
Lawson, D. R. and Winchester, J. W.: A standard crustal aerosol as a reference for elemental enrichment factors, Atm. Env., 13, 925–930, 1979.
Longo, K. M., Thompson, A. M., Kirchhoff, V. W. J. H., Remer, L. A., de Freitas, S. R., Dias, M. A. F. S., Artaxo, P., Hart, W., Spin-hirne, J. D., and Yamasoe, M. A.: Correlation between smoke and tropospheric ozone concentration in Cuiab`a during Smoke, Clouds, and Radiation-Brazil (SCAR-B), J. Geophys. Res., 104, 12 113–12 129, 1999.
Lorius, C., Raisbeck, G., Jouzel, J., and Raynaud, D.: Long-term environmental records from Antarctic ice cores, in The Envi-ronmental Record in Glaciers and Ice Sheets, Oeschger, H. and Langway Jr., C.C. (Eds), John Wiley and Sons, 343–361, 1989. Ramirez, E., Hofmann, G., Taupin, J.-D., Francou, B., Ribstein,
P., Caillon, N., Ferron, F. A., Landais, A., Petit, J.-R., Pouyaud, B., Schotterer, U., Sim˜oes, J. C., and Stievenard, M.: A new Andean deep ice core from Nevado Illimani (6350 m), Bolivia, Earth. Plan. Sci. Let., 212, 337–350, 2003.
Risacher, F.: G´eochimie des lacs sal´es et croˆutes de sel de l’Altiplano Bolivien, Sci. G´eol., Bull., 45, 3-4, 135–214, 1992. Rojas, C. M., Figueroa, L., Janssens, K. H., Van Espen, P. E.,
Adams, F. C., and Van Grieken, R. E.: The elemental compo-sition of airborne particulate matter in the Atacama desert, Chile, Sci. Total Env., 91, 251–267, 1990.
Sholkovitz, E., Church, T. M., and Arimoto, R.: Rare earth element composition of precipitation particles and aerosols, J. Geophys. Res., 98, 20 587–20 599, 1993.
Sim˜oes, J. C., Taupin, J.-D., Ribstein, P., Petit, J.-R., De Ange-lis, M., Ramirez, E., Hoffmann, G., Correia, A., Delmas, R. J., Dupr´e, B., Ginot, P., and Francou, B.: Forty years of environ-mental record from the Nevado Illimani ice core, Central-Eastern Andes, J. Geophys. Res., in preparation, 2003.
Thompson, L. G., Mosley-Thompson, E., Bolzan, J. F., and Koci, B. R.: A 1500-Year Record of Tropical Precipitation in Ice Cores from the Quelccaya Ice Cap, Peru, Science, 229, 971–973, 1985. Thompson, L. G., Davis, M. E., Mosley-Thompson, E., Sowers, T. A., Henderson, K. A., Zagorodnov, V. S., Lin, P.-N., Mikhalenko, V. N., Campen, R. K., Bolzan, J. F., Cole-Dai, J., and Francou, B.: A 25 000-Year Tropical Climate History from Bolivian Ice Cores, Science, 282, 1858–1864, 1998.
Thompson, L. G.: Ice core evidence for climate change in the Trop-ics: implications for our future, Quat. Sci. Rev., 19, 19–35, 2000. Vuille, M.: Atmospheric circulation over the Bolivian Altiplano during dry and wet periods and extreme phases of the Southern Oscillation, Int. J. Climatol., 19, 1579–1600, 1999.
Vuille, M., Bradley, R. S., and Keimig, F.: Interannual climate vari-ability in the Central Andes and its relation to tropical Pacific and Atlantic forcing, J. Geophys. Res., 105, 12 447–12 460, 2000. Wagenbach, D.: Environmental records in Alpine glaciers, in The
Environmental Record in Glaciers and Ice Sheets, Oeschger, H. and Langway Jr., C.C. (Eds), John Wiley and Sons, 69–83, 1989. Wolff, E. and Peel, D.: The record of global pollution in polar snow
and ice, Nature, 313, 535–540, 1985.
Wolff, E. W., Suttie, E. D., and Peel, D. A.: Antarctic snow record of cadmium, copper, and zinc content during the twentieth century, Atm. Env., 33, 1535–1541, 1999.