UNIVERSITÉ DE MONTRÉAL
SYSTEMATIC EQUIPMENT PERFORMANCE ANALYSIS OF A KRAFT
PROCESS THROUGH NEW AND ADAPTED KEY PERFORMANCE
INDICATORS
RADIA AMMARA
DÉPARTEMENT DE GÉNIE CHIMIQUE ÉCOLE POLYTECHNIQUE DE MONTRÉAL
THÈSE PRÉSENTÉE EN VUE DE L’OBTENTION DU DIPLÔME DE PHILOSOPHIAE DOCTOR
(GÉNIE CHIMIQUE) OCTOBRE 2015
UNIVERSITÉ DE MONTRÉAL
ÉCOLE POLYTECHNIQUE DE MONTRÉAL
Cette thèse s'intitule:
SYSTEMATIC EQUIPMENT PERFORMANCE ANALYSIS OF A KRAFT
PROCESS THROUGH NEW AND ADAPTED KEY PERFORMANCE
INDICATORS
présentée par : AMMARA Radia
en vue de l’obtention du diplôme de : Philosophiae Doctor a été dûment acceptée par le jury d’examen constitué de : M. TAVARES Jason-Robert, Ph. D, président
M. PARIS Jean, Ph. D, membre et directeur de recherche
M. FRADETTE Louis, Ph. D, membre et codirecteur de recherche M. SAVADOGO Oumarou, D. d’état, membre
DEDICATION
To my parents, Abdelhak and Souad, for their endless and unconditional love and support. To my grandmother, mama Bariza, with love. You may be gone, but you will
never be forgotten.
---
Now this is not the end. It is not even the beginning of the end. But it is, perhaps, the end of the beginning.
ACKNOWLEDGEMENTS
I would have never been able to finish this dissertation without the guidance, and the academic and financial support of my supervisors, Prof. Jean Paris and Prof. Louis Fradette, and without the help, the encouragement and the support from my friends and family.
First, I owe sincere thankfulness to my research codirector, Professor Jean Paris and my director Prof. Louis Fradette for believing in me and giving me the chance to join this research group and fulfill my PhD. I would like to thank Prof. Jean Paris for his guidance, his always pertinent comments, his patience, his encouragements and also his many constructive criticisms. He encouraged me to grow as an independent thinker, which not only improved my scientific side, but almost all aspects of my life. Working under your close supervision was a privilege and one can only learn from your wide knowledge in science. You are an inspiration of hard work and dedication.
I would also like to show my gratitude to Prof. Louis Fradette whose comments and suggestions were always extremely pertinent and who guided me throughout my PhD, and greatly improved my methodology and publications.
Special thank to Dr. Mariya Marinova for her help and advices especially during the final steps of this research and for always finding the right words to encourage me. Also, very special thanks to my colleagues and valuable friends: Moye, Fatma, Sourour, Francois, Hana, Miyuru, Meriem, Tatiana and all the students who worked in our group, Nesrine, Alexa, Chaima, Anna and all the other interns. The long conversations I had with each and all of you are precious to me.
Je dois également spécialement remercier certaines personnes très proches à mon cœur, ma sœur d’âme (pour ne pas dire âme sœur) Meriem, et ma douce moitié, Amine pour leur support ininterrompu et leurs encouragements continus.
Je remercie également ma famille en Algérie, mes tantes, oncles et cousins qui ont toujours à travers Skype, su trouver les mots pour me réchauffer le cœur, m’encourager et me témoigner leur affection.
Enfin, je remercie ma famille, mes parents Abdelhak et Souad, mon frère Salim, ainsi que le plus frère des cousins, Walid, pour leur amour inconditionnel et ininterrompu, pour leur perpétuel
support, et leurs intarissables encouragements. Je vous aime de tout mon cœur, et ce doctorat, je vous le dois.
RESUME
L’industrie des pâtes et papiers occupe une place importante dans l’économie du Canada et est un acteur clé quant à la croissance de son produit intérieur brut [1]. De plus, l’industrie papetière crée plus de 320 000 emplois directs et indirects pour les Canadiens [1]. Toutefois, cette industrie est l'une des plus grandes consommatrices d'énergie, consommant environ 30 % de l'énergie totale utilisée par les industries manufacturières canadiennes [2]. Cependant, au cours des deux dernières décennies, l'industrie des pâtes et papiers a été confrontée à une crise sans précédent en raison de la concurrence des économies émergentes comme l'Inde et la Chine, des règlementations environnementales strictes et contraignantes et des prix élevés des énergies. Parce que l'énergie est une composante importante des coûts de production (environ 25% des couts de production), pour rester compétitives, les papetières se voient donc obligées de réexaminer leur procédé afin de réduire leurs factures énergétiques et leurs consommations d’eau et de produits chimiques et ainsi ne pas perdre leur position concurrentielle. En outre, le secteur a réduit sa consommation d'énergie en moyenne de 1 % par an depuis 1990 [3]. De ce fait, plusieurs techniques d’intégration de procédés existent. Elles se basent sur des approches conceptuelles et graphiques ou encore mathématiques. Ces méthodes d’optimisation et d’intégration de procédé appliquées sur des usines canadiennes ont donné des résultats intéressants. Toutefois, dans la plupart des méthodes actuelles d’optimisation de procédé, il est assumé que les équipements dans l’usine opèrent efficacement. En réalité, ceci n’est pas toujours le cas ; ce qui peut fausser les résultats d’une analyse de performance.
Par conséquent, l'analyse de performance des opérations unitaires du procédé est une étape préliminaire importante avant toute mesure d'intégration. En fait, les équipements ayant une mauvaise performance peuvent augmenter la demande globale du procédé en énergie et en matière et discréditer les résultats des procédures d’intégration.
L'objectif principal de cette thèse est de développer, d'appliquer et ensuite de valider une méthodologie systématique d'analyse de performance des équipements du procédé Kraft, en termes d'énergie, d'eau et d'utilisation de produits chimiques à l’aide de nouveaux indicateurs de performance.
La méthodologie s’articule autour de quatre étapes successives à travers desquelles les opérations unitaires sont examinées pour évaluer comment leurs besoins énergétiques, d'eau et des produits chimiques peuvent être réduits en augmentant leurs propres performances. La méthodologie comprend: (i) le développement et le calcul des indicateurs de performance clés pour chaque unité opératoire, (ii) l'identification des écarts importants par rapport au rendement cible et donc la localisation d'un mauvais fonctionnement et, (iii) le diagnostique des causes d’inefficacité et des recommandations de mesures correctives.
Les techniques existantes pour évaluer la performance des équipements considèrent l’utilisation efficace d'énergie et d'eau. La présente étude considère l’utilisation de l'eau, l'énergie et les produits chimiques au sein du procédé. En outre, il prend en compte les interactions entre les opérations unitaires et plus d’un indicateur clé est utilisé pour évaluer la performance des équipements. Une étude de ce type n’a jamais été effectuée sur une usine Kraft Canadienne. Ce qui rend cette étude originale tant d’un point de vue méthodologie que résultats obtenus.
Dans un premier temps, la réconciliation de données et la détection des erreurs grossières sont effectués pour produire un modèle fiable du procédé étudié pour ainsi obtenir des résultats cohérents et sûrs lors d’une analyse de performance. La réconciliation des données et la détection des erreurs grossières ont également été utilisées pour localiser et identifier les opérations unitaires présentant des inefficacités. La réconciliation et la détection des erreurs grossières sont considérés dans cette étude comme premiers indicateurs de performance. Une analyse de l'efficacité exégétique a été effectuée afin d’identifier les opérations unitaires thermodynamiquement inefficaces. L’efficacité exégétique est l’indicateur clé pour l'utilisation de l'énergie. Une fois ces deux analyses effectuées, les opérations unitaires soupçonnées d'avoir de mauvaises performances sont identifiées. Ces opérations unitaires sont ensuite analysées avec un ou plusieurs indicateurs de performance qui leur sont spécifiques, développés suite à une analyse adimensionnelle autour des unités opératoires clés, et enfin des projets d'amélioration sont proposés suite aux diagnostics établis.
Enfin, l'intérêt de cette méthodologie est démontré dans le cas d'une usine de pâte kraft située dans l'Est du Canada. L'usine produit une moyenne de 280 adt / j de pâte à partir de laquelle du
papier journal est fabriqué. La méthodologie a été démontrée pour être en mesure d'améliorer l'efficacité globale du procédé en termes d'utilisation d'énergie, d'eau et des produits chimiques.
ABSTRACT
The Canadian pulp and paper sector is an important key player in the country’s economic growth and gross domestic product [1], providing over 320, 000 direct and indirect employment opportunities for Canadians [4].
Pulp and paper industry in Canada is one of the largest energy-consumer amongst all industries in Canada, consuming approximately 30% of the industrial energy [2]. However, during the last two decades, the pulp and paper sector has been facing an unprecedented crisis due to competition from emerging economies like India and China, stringent environmental regulations and high energy prices. Because energy is a significant production-cost component (about 25% of the total production cost), in order to remain competitive, the sector has made efforts towards identifying ways to improve the energy efficiency through implementing energy recovery systems. The sector has also reduced its energy use by an average of 1% annually since 1990 [3]. Despite these improvements, the pulp and paper industry still seeks ways to identify inefficiencies and improve its overall energy and water utilization. Many process integration (PI) techniques have been developed and gave encouraging results. These techniques use both conceptual and mathematical approaches. However, these techniques consider that the unit operations in place function efficiently, which is often not the case in real operating pulp mills. Therefore, analysing the performance of unit operations is an important step prior to any process integration technique. In fact, equipment with poor performance could increase the energy and water demand of the overall process and discredit the results of energy and utility enhancement procedures.
The objective of this thesis is to develop, apply and validate a methodology for Kraft process equipment performance analysis in terms of energy, water and chemical utilization by means of new and adapted key performance indicators.
The core of the methodology consists in four successive stages through which the unit operations are examined to evaluate how their energy, water and chemical requirements can be reduced by increasing their own performance. The steps comprise: (i) the computation of key performance indicators for each piece of equipment, (ii) the identification of significant deviations from the
target performance, and therefore the location of poor performance unit operation and, (iii) diagnosis of the causes of inefficiencies and the proposal of remedial actions.
The existing techniques for the evaluation of equipment performance include either energy or water utilization efficiency. The current study considers water, energy and chemical utilization in the process. It also takes into account the interactions between unit operations and uses more than one KPI to evaluate the performance of the process operations.
At first, data reconciliation and gross error detection are performed to produce a reliable model of the process studied and obtain reliable results when performing performance evaluation. Initially, data reconciliation and gross error detection are used to locate and identify process leaks and biases. A strong measurement adjustment is considered in this study as a first key performance indicator (KPI). An exergy efficiency analysis is performed to identify poor energy efficiency unit operations. Exergy efficiency is the KPI for energy utilization. Once these two analyses have been performed, a list of unit operations suspected to have poor performance is constructed. These unit operations are further evaluated by means of KPIs developed based on a dimensional analysis and enhancement measures and improvement projects are proposed according to the diagnoses established.
The interest of this methodology is demonstrated in the case of an operating Kraft pulp located in Eastern Canada. The mill produces an average of 280 adt/d of pulp from which newsprint is made. The methodology has been demonstrated to be able to improve the overall efficiency of the process in terms of energy, water and chemical utilization through an adequate evaluation of its equipment.
This thesis provides mill engineers with a systematic and strategic way to evaluate the performance of their unit operations by means of new KPIs.
TABLE OF CONTENTS
DEDICATION ... III ACKNOWLEDGEMENTS ... IV RESUME ... VI ABSTRACT ... IX TABLE OF CONTENTS ... XI LISTE OF TABLES ... XV LIST OF FIGURES ... XVI LIST OF SYMBOLS AND ABBREVIATIONS... XVIII LIST OF APPENDICES ... XXICHAPTER 1 INTRODUCTION ... 1
1.1 Context of the study ... 1
1.2 Problem ... 2
1.3 General objective ... 4
1.4 Structure and organisation ... 4
CHAPTER 2 LITERATURE REVIEW ... 5
2.1 Description of the Kraft process ... 5
2.1.1 Importance of paper ... 5
2.1.2 Pulping and paper making processes ... 5
2.1.3 The Kraft process ... 6
2.1.4 Utilities consumption ... 12
2.1.5 The biorefinery concept ... 13
2.2.1 Pinch analysis ... 15
2.2.2 Mathematical optimisation ... 18
2.3 Process simulation ... 19
2.4 Data reconciliation and gross error detection ... 20
2.4.1 Data reconciliation: problem formulation ... 23
2.4.2 Gross error detection ... 28
2.5 Exergy analysis ... 34
2.6 Dimensional analysis ... 37
2.7 Equipment performance analysis (EPA) ... 39
2.8 Synthesis of literature review ... 40
2.8.1 Summary of literature review and scientific gaps ... 40
2.8.2 Overall methodology approach ... 42
CHAPTER 3. ARTICLE 1: DATA RECONCILIATION AND GROSS ERROR DETECTION OF AN OPERATING CANADIAN KRAFT MILL ... 44
3.1 Presentation of the article ... 44
3.2 Abstract ... 44
3.3 Nomenclature: ... 45
3.4 Introduction ... 46
3.5 Process description ... 48
3.6 Methodology ... 50
3.7 Results and discussions ... 62
3.8 Conclusion ... 70
CHAPTER 4. ARTICLE 2: EXERGY ANALYSIS OF A CANADIAN KRAFT MILL USING
NEW PRACTICAL EXERGY CONCEPTS ... 77
4.1 Presentation of the article ... 77
4.2 Abstract ... 77
4.3 Introduction ... 78
4.4 Case Study ... 80
4.5 Methodology ... 82
4.6 Results and Discussion ... 90
4.7 Conclusion ... 101
4.8 Nomenclature ... 102
4.9 References ... 103
CHAPTER 5. ARTICLE 3: EQUIPMENT PERFORMANCE ANALYSIS OF A CANADIAN KRAFT MILL. PART I: DEVELOPEMNT OF NEW KEY PEROFRMANCE INDICATORS (KPI) ... 107
5.1 Presentation of the article ... 107
5.2 Abstract ... 107
5.3 Introduction ... 107
5.4 Context of the study: Kraft process ... 110
5.5 Background of the dimensional analysis and the Buckingham II theorem ... 111
5.6 Characterization of key-equipment and dimensional analysis of the Kraft process ... 112
5.7 Conclusion ... 133
5.8 References ... 133
CHAPTER 6. ARTICLE 4: EQUIPMENT PERFORMANCE ANALYSIS OF A CANADIAN KRAFT MILL. PART II: DIAGRNOSTICS AND IDENTIFICATION OF IMPROVEMENT PROJECTS ... 138
6.1 Presentation of the article ... 138 6.2 Abstract ... 138 6.3 Introduction ... 139 6.4 Case study ... 141 6.5 Methodology ... 143 6.6 Results ... 150
6.7 Conclusion and recommendations ... 156
6.8 References ... 157
CHAPTER 7. GENERAL DISCUSSION ... 160
Process simulation of the case study ... 160
Date Reconciliation and Gross Error Detection ... 160
Exergy Analysis ... 163
Key performance indicators ... 164
Equipment Performance Analysis ... 164
Context of the Canadian Kraft pulp mills ... 165
Scope of application of the methodology ... 166
CHAPTER 8. CONCLUSION AND RECOMMENDATIONS... 167
Original Contribution ... 168
Recommendations for Future Research ... 168
BIBLIOGRAPHY ... 170
APPENDIX A – DATA RECONCILIATION ... 178
APPENDIX B – THERMAL ENERGY EFFICIENCY ANALYSIS AND ENHANCEMENT OF CANADIAN KRAFT MILLS ... 185
LISTE OF TABLES
Table 2-1 : Average energy consumption and production for bleached Kraft pulp ... 13
Table 2-2 : Definition of important data reconciliation parameters ... 21
Table 3-1 : Model description ... 63
Table 3-2 : Results of the global test ... 65
Table 4-1: Exergy efficiency calculation for the different system components ... 88
Table 4-2: Exergy efficiency calculation for the different departments of the mill ... 89
Table 4-3: Breakdown of exergy improvement potential per department ... 101
Table 5-1: List of major equipment per department ... 112
Table 5-2: Parameters characterising the Steaming Vessel ... 114
Table 5-3: Parameters characterising the Heat Exchangers ... 115
Table 5-4: Parameters characterising the Washing ... 118
Table 5-5: Parameters characterising the Paper Machine ... 121
Table 5-6: Parameters characterising the Recovery Boiler and Power Boiler ... 124
Table 5-7: Parameters characterising the Slaking ... 128
Table 5-8: Parameters characterising the Clarifier ... 129
Table 5-9: Parameters characterising the Dregs filter ... 131
LIST OF FIGURES
Figure 2-1 : Simplified diagram of the case study Kraft pulp mill ... 7
Figure 2-2 : Simplified schematic of the washing department ... 8
Figure 2-3 : Simplified schematic of the bleaching sequences: D0EopD1 ... 9
Figure 2-4 : Simplified schematic of the paper or pulp machine department ... 9
Figure 2-5 : Simplified schematic of the chemical recovery line ... 11
Figure 2-6 : Scheme of the integrated forest biorefinery [18] ... 14
Figure 2-7 : Simplified schematic of the pinch analysis basic principles [20] ... 16
Figure 2-8: Classification of process variables ... 21
Figure 2-9: Instrument types of faults [51]. ... 29
Figure 2-10 : Overall methodology ... 43
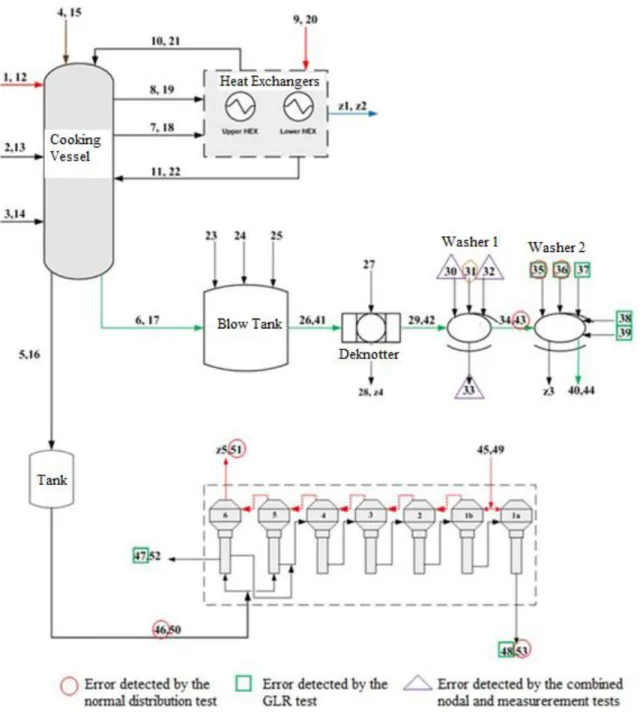
Figure 3-1: Simplified diagram of the Kraft process ... 49
Figure 3-2: Organigram of the data reconciliation methodology ... 51
Figure 3-3: Gross error handling strategy ... 56
Figure 3-4: Variable classification ... 64
Figure 3-5: The results of the gross error detection by the combined procedure for the measurements in the washing department ... 66
Figure 3-6: Variables suspected of containing gross errors, detected by the different gross error detection techniques applied ... 67
Figure 3-7: Results of the reconciliation of the mass flow measurements - (%) adjustment ... 68
Figure 3-8: Results of the reconciliation of the temperature measurements- (%) adjustment ... 69
Figure 3-9: Variables strongly adjusted by the reconciliation ... 70
Figure 4-1: Simplified diagram of a Kraft process. ... 81
Figure 4-3: Exergy efficiency analysis per department and for the entire mill (%) ... 92
Figure 4-4: Overall exergy flow per department (kW) ... 92
Figure 4-5: Type of exergy flow entering the different departments of the mill ... 93
Figure 4-6: Type of exergy flow entering the different departments of the mill ... 94
Figure 4-7: Exergy efficiency for the power plant and its major equipment ... 95
Figure 4-8: Exergy efficiency for the digester department and its major equipment ... 98
Figure 4-9: Digester's thermal exergy efficiency before and after improvement ... 99
Figure 5-1 : Simplified diagram of the Kraft process ... 110
Figure 5-2: Schematic of the digesting department ... 113
Figure 6-1: Simplified diagram of the Kraft pulp mill ... 142
LIST OF SYMBOLS AND ABBREVIATIONS
Adt Air dried tonA Incidence matrix
Au Incidence matrix of unmeasured variables
Ax Incidence matrix of measured variables
BL Black liquor
Cp Heat capacity
DR Data reconciliation
GE Gross error
GED Gross error detection GL Green Liquor
GLR Generalized likelihood ratio gm Function of the model constraints
H Enthalpy
H0 Null hypothesis, no gross error is present
H1 Alternate hypothesis, at least one gross error is present
LS Least squares
m Number of constraints
n Number of variables in the system
NLP Non linear programming Odt Oven dried ton
P Projection matrix (in chapter 3)
Q Matrix of dimension (m x m)
Q1 Matrix of dimension (m x n)
Q2 Matrix of dimension (m x m-n)
r Vector of constraints residuals
R1, R2 Triangular matrices obtained by QR factorization of the incidence matrix
R Ideal gas constant
s Standard deviation of a sample
T Temperature
u Vector of unmeasured, observable variables
V Matrix of variance of the system
W Matrix of covariance of the system
WBL Weak black liquor x Vector of true variables
y Vector of measured variables
SUPERSCRIPTS
T Transpose
GREEK
α Confidence level, or significance level, used in statistical hypothesis test
β Modified confidence level for statistical power test
ε Vector of errors
μ Mean value of a sample
σ Standard deviation
χ2
LIST OF APPENDICES
Appendix A – Data reconciliation ... 178 Appendix B – Thermal energy efficiency and enhancement of Canadian Kraft Mills...177
CHAPTER 1:
INTRODUCTION
1.1 Context of the study
The economic stability of any developed country depends strongly on the dynamism of its industries. On account of its rich and abundant natural resources, Canada produces and exports fossil fuel energy, forestry and pulp and paper products, among its major outputs. However, these natural resources industries are energy intensive. In 2008, the manufacturing sector accounted for 67% of the total consumption of the country; 14% are directly attributable to the pulp and paper industry [5, 6]. Wood from the forest is an abundant source of renewable biomass provided it is managed responsibly. Indeed, Canada has about 10% of the world's forests with a total of 229 million hectares (ha). Because of this, the turnover in total exports of forest products reaches 68,4 billion dollars, of which 33.5 billion dollars from pulp and paper (P&P), representing 1.2 % of the gross domestic product [1, 3].
However, the Canadian pulp and paper industry has been facing a long lasting crisis for the past twenty years. With the rising costs of energy and chemicals, and with the introduction of new environmental standards, the industry must improve its current process to face this new reality. Several other factors contribute to the worsening of the financial crisis that the industry has been experiencing. The emergence of information technology systems provides a new medium of information, other than paper and thus, decreasing the demand for commodity paper products such as newsprint, the traditional mainstay of the Canadian industry, as well as other printing and writing grades. The gross domestic product from the paper sector has steadily declined since 2007, ranging from $ 5.8 billion in 2007 to $ 3.6 in 2012 [1, 3]. Moreover, major fluctuations in the prices of raw materials have been fundamentally changing the way companies act, react and move up and down the value-chain. This has been the topic of much research interest for the past few years. Simultaneously, new large and modern P&P plants have been built in tropical regions endowed with low labor costs and fast growing forests with 10 to 20 year-maturation periods versus 50 to 75 in Canada. To overcome this crisis, some companies have adopted merger and acquisition strategies. Others have invested capital and effort to reduce their operating costs by reassessing their heat transfer networks. Paradoxically, at the same time, investments in research and development have been significantly reduced (like all other variable costs of the companies). Canadian Pulp and Paper companies must reinvent themselves in the long term by investing in
projects centered on technological innovation and improve existing processes by increasing equipment performance and optimizing the use of material and energy.
It is in this uncertain and volatile economic environment that some companies have tried to expand their product portfolios to diversify their sources of income, while consolidating their assets by reducing their operating costs. The Canadian P&P industry has been implementing novel transformative technologies and developing products derived from wood biomass to penetrate new markets. Biosensitive packaging materials for food products, security papers with embedded codes or nanocrystalline cellulose are examples of such products. They are essentially cellulose based, as is paper. The forest biorefinery is also an appropriate solution to help the paper industry face the crisis. The concept of the biorefinery is to exploit the main components of the wood to produce high value-added products. This alternative offers the pulp and paper industry, which has been struggling to operate in this highly unstable environment, a solution to deal with the crisis, and a way to contribute to the development of a bio-economy.
This implementation of alternative papermaking-biorefinery would be possible insofar as the receptor-mother-plant is optimized in terms of energy use, water and chemicals, and certain pieces of equipment are modified or improved. Optimization methods and process integration techniques applied to Canadian plants have produced encouraging results, providing enough energy and material to allow the implementation of a biorefinery [7]. However, it is assumed in most current optimization methods, that the equipment and unit operations in the plant operate effectively. In reality, this is not always the case; and this could make the optimization procedure biased. A new approach that takes into account this scientific gap is necessary.
1.2 Problem
The Canadian paper industry is one of the oldest industries in the country. It emerged in an environment (in the 1930's) where energy and water costs were very low, which is not the current reality. It is therefore essential to improve the performance of the Kraft process and reduce energy, water and chemicals consumption in order to help the integration of biorefinery, face a competitive market and make it more profitable and economically sustainable. Several optimization techniques already exist and have been widely applied. One can cite the pinch analysis applied to energy and water or the mathematical optimization methods, as presented and
explained in the literature review. However, these optimization methods have been mostly used with the view that the equipment operates efficiently or as it has been intended, which is often not the case. Equipment performance analysis is an essential step before any measure of improvement that requires major investments.
One way to evaluate the performance of equipment is to use specific key indicators. The use of indicators as a calibration tool is a common practice to measure the variability and correct the operation of a process. Several performance indicators exist but definitions as well as mode of use vary, even though they all have the same goal which is to evaluate the performance of an operation of a process from a particular point of view.
Although some performance indicators already exist, there are still major gaps in their industrial application. Most existing performance indicators are generic (no specific to the Kraft process) and therefore ill-suited to the processes of pulp and paper. In addition, existing performance indicators do not take into account the specificities of the equipment in place, moreover, there are no performance indicators linking the operating conditions of an operation to the intrinsic design of the equipment.
On the other hand, the performance evaluation studies of pulp and paper processes take into account the energy and water variables only, and exclude the chemicals. The chemicals used in the Kraft process have become more expensive over the past decades. Thus, the evaluation of the performance of the unit operations should include the evaluation of the chemical process performance. It is therefore necessary to develop new performance indicators that take into account the specific design of the equipment, the operating conditions, and the relevant parameters to control or optimize energy, water and raw material usage by the Kraft process during its operations. These indicators will not only facilitate the assessment of the performance but also the diagnosis of the inefficiencies.
The synthesis of the knowledge gaps leads to the necessity to develop a systematic approach that will contribute to reach the following objectives:
Build a simulation based on a congruent set of data that represent the steady-state of the process (data reconciliation);
Systematically identify equipment and unit operations that have poor performances with respect to energy, water, and raw materials utilization;
Diagnose effectively the causes of inefficiencies, and;
Propose improvement projects to address inefficiencies.
The work carried out within the framework of this thesis addresses these issues by developing a systematic methodology for equipment performance analysis.
1.3 General objective
The main objective of this work is to develop new key performance indicators, specially tailored for the Kraft process, and to quantify the performance of individual equipment for the use of energy, water and products, in order to improve the performance of the overall process.
1.4 Structure and organisation
This thesis consists of eight chapters and is supported by four papers submitted for publication. A brief introduction was presented in Chapter 1. Chapter 2 is devoted to the review of the literature followed by a description of the methodology. Chapters 3, 4, 5 and 6 are submitted papers on data reconciliation, exergy analysis, development of new key performance indicators based on dimensional analysis, and the results of the equipment performance analysis, respectively. A general discussion about the thesis is presented in Chapter 7, followed by a concluding Chapter. Scientific contributions and recommendations for future work are clearly stated in the individual papers.
CHAPTER 2:
LITERATURE REVIEW
The background and literature review is divided into three parts; the first one presents the description of the Kraft process specifications followed by the process integration techniques and the optimization methods. The second part is devoted to the dimensional analysis, the equipment performance analysis, the data reconciliation, the gross error detection techniques and the exergy efficiency analysis. The final part is a summary and synthesis of the literature review, the identification of the scientific gaps and the presentation of the methodology to fulfill the main objective of the thesis.
2.1 Description of the Kraft process
2.1.1 Importance of paper
Paper is a product of daily consumption, called a commodity product [8]. A trip to a grocery store provides a glimpse of the industry’s influence on our daily life [9]. Paper is used for packaging, marketing personal care tissues, and so on. It supports most of our communications. It provides means for the identification of documents, of banking transactions, of the dissemination of information, etc. It is closely tied to activities of humankind. Although paper consumption has declined since the emergence of electronic information and web technologies that have supplanted it [10], the paper remains a necessity of daily life. The uses and applications of paper products are limitless. Also, new specialty products such as biosensitive or smart packaging papers are in constant development.
2.1.2 Pulping and paper making processes
Pulping is the process by which the wood or any other cellulosic raw fibrous material is reduced into fibers. In other words, the lignin which binds the fibers together is dissolved or broken (depending on the process), leaving the cellulose and hemicelluloses free and in fibrous form. This can be accomplished by various methods: mechanical, chemical or, semi-chemical. The latter is a hybrid between the two other methods. Chemical processes are the most commonly used pulping method. They represent 70% of the North American production, 90% of it being attributed to Kraft or the so-called sulphate process [10].
The mechanical pulping consists in mechanically forcing the logs against a revolving stone/wheel (stone ground wood, SGW) which grinds the wood into pulp, under the effect of pressure and heat, by buffing or mechanical friction. The surface of the abrasive stone is washed to recover the liberated fibers and prevent its damage.
The chemical pulping, as opposed to the mechanical pulping, consists in cooking wood chips with appropriate chemicals in an aqueous solution at elevated pressure and temperature. The objective is to chemically dissolve the maximum of lignin while leaving the cellulose and hemicelluloses in the form of intact fibres. The two main chemical methods are the Kraft process (alkaline) and the sulfite process (acid) [10].
2.1.3 The Kraft process
The Kraft process is known to be energy intensive and a large consumer of chemicals. The main purpose of a Kraft pulp mill is to produce pulp at a given Kappa number1 or brightness while minimizing energy costs, utilities and chemicals used [11]. The Kappa number describes directly the amount of lignin dissolved. The Kraft pulping entails treatment of woodchips with a mixture of sodium hydroxide (NaOH) and sodium hydro-sulfide (NaSH). The process can be divided into 2 main lines, the fiber line and the chemical recovery line. Figure 2-1 depicts a simplified flowsheet of the Kraft process. The Kraft process is characterized by its chemical recovery loop, which makes it economically viable and independent in terms of energy and chemicals, if the mill is well managed.
1 Kappa number is an indication of the residual lignin content or bleachability of wood pulp by a standardised
Figure 2-1 : Simplified diagram of the case study Kraft pulp mill
The main purpose of the pulp line is to remove the lignin from the fibers and produce a pulp of good properties of brightness and strength. The lignin is removed in 3 main departments: digesting, washing and bleaching. The lignin removal is accomplished with such chemicals as sodium hydroxide (NaOH) and sodium hydro-sulfide (NaSH) in digesting, and oxygen (O2) and
chlorine dioxide (ClO2) in bleaching. The two ‘’driving forces’’ for Kraft pulping reactions in the
digester are the alkali concentration (as measured either by effective alkali or active alkali) and the temperature [11].
The fiber line starts with the wood reception. The wood is mechanically debarked and chipped; then, the chips are screened to eliminate the fine and over-sized pieces. The removed bark is combusted in the bark boiler and the wood chips retained are sent to the digester after being impregnated by injection of superheated steam. The wood chips are introduced in the cooking vessel along with the white liquor the solution of sodium hydroxide and sodium hydrosulfide and heated up to 170 ° C for about 1 to 2 hours to complete the delignification reactions [8]. The digester is one of the most important unit operations of the Kraft process. It is where the cellulosic fibers are separated from the lignin to form the pulp. After the digesting, the pulp is sent to the brown stock washing section. The washing is performed through a series of counter-current brown stock washers using displacement washing to remove the residual lignin from the
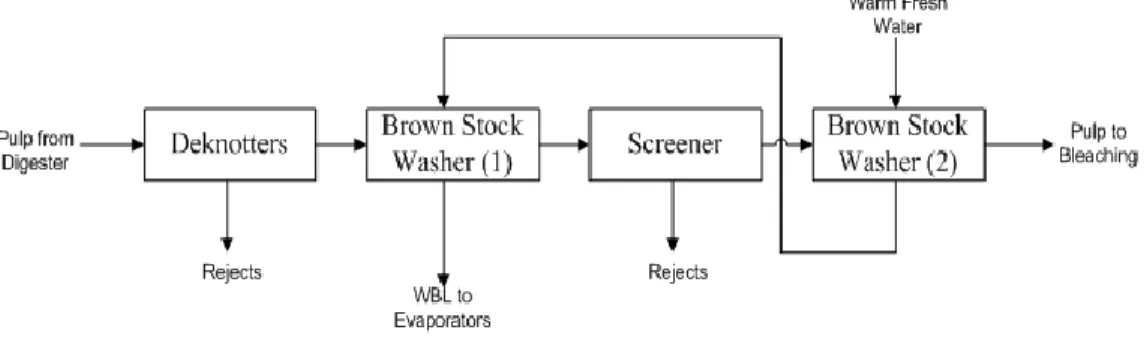
fibres. The dissolved lignin and chemicals removed are sent to chemical recovery or back to the digester as dilution water. Figure 2-2 shows a simplified schematic of the washing section.
Figure 2-2 : Simplified schematic of the washing department
The washed pulp is sent to the bleaching section where a series of bleaching steps take place using specific reducing or oxidizing bleaching agents. The objectives of bleaching are to remove the residual lignin, to maintain cellulose chain length and to brighten the fibers through different bleaching stages at different pH and temperature conditions and using different bleaching chemicals. A bleaching stage is composed of a bleaching tower, a storage tower and a washer. The simplified bleaching sequence for the case-study mill is depicted in figure 2-3. The bleaching towers are described using the standard name convention for bleaching sequences, more specifically, bleach towers are referenced using letters and subscripts, where the first capital letter refers to the oxidizing/reducing chemical used in the tower and subscripts are used when there is more than one tower using the same bleaching chemical to identify such towers in increasing order. Therefore, as showed in figure 2-3, the bleaching sequence for the studied mill is: D0EopD1.
Figure 2-3 : Simplified schematic of the bleaching sequences: D0EopD1
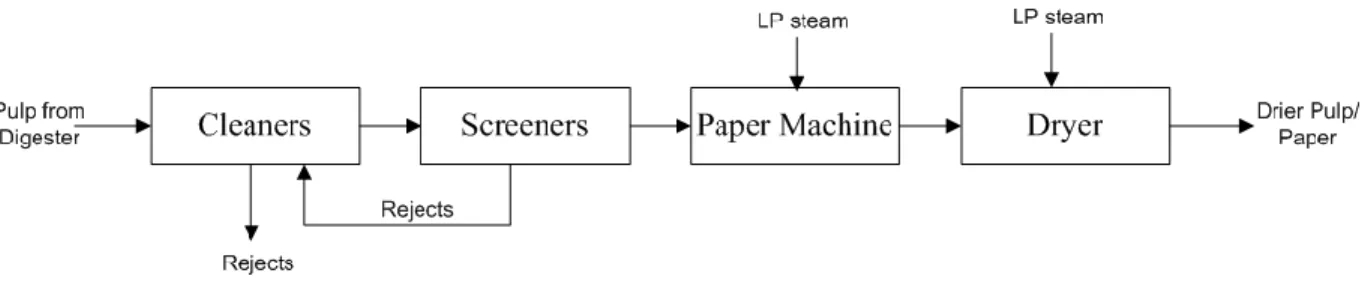
The bleached pulp is sent to the pulp or paper machine to finally produce dried pulp or paper to be sold. At this department, the pulp undergoes a final cleaning and screening to remove oversized and bad quality fibers. The filtrate containing fibers is recycled to the bleaching department. Low pressure (LP) steam is injected in the paper machine and in the dryer. This department is generally highly energy intensive. Up to 40% of the total steam consumption is attributable to this department. Figure 2-4 presents a simplified schematic of the unit operations in the paper machine department.
Figure 2-4 : Simplified schematic of the paper or pulp machine department
The chemical recovery line consists in regenerating the chemical agents used in the cooking vessel, and producing steam to supply for the energy demand of the mill. It is necessary to have a recovery loop to make the pulping process economically feasible.
The cooking liquor coming from the digester is sent to the evaporator department. The lignin dissolved in the weak black liquor (WBL) is concentrated (from 15% to more than 60% of dissolved solids) in the multi-effect evaporators and then burnt in the recovery boiler to produce the steam required for the process and to recover the spent chemicals as a smelt, which is sent to the recausticizing department where it encounters a series of reactions to regenerate the white liquor which closes the liquor loop. Impurities introduced from the recovery boiler and from the lime kiln are also removed in this department. Non Process Elements (NPEs)2 are also removed at this stage; otherwise the overall efficiency of the mill would be compromised. The calcium carbonate is burnt in the lime kiln to regenerate the lime. Some make-up chemicals are sometimes added to the system to maintain the same white liquor quality and therefore the same brightness and quality of the pulp produced. Natural gas is used as a fuel in the lime kiln and also in the power boilers. Figure 2-5 shows the simplified schematic of the chemical recovery department.
2 Non process elements are introduced into the Kraft pulp mainly through the wood chips. The elements of concern
are primarily those that do not form insoluble inorganic compounds in alkaline solutions, i.e. AI, Si, Cl and K, and also transition elements, i.e. Mn, Cu and Fe, and the alkaline earth metals Ca and Ba.
Dissolving smelt Recovery boiler Green Liquor Clarifier Slaker Water Water S m e lt W e a k B la c k L iq u o r Concentrated Black Liquor White Liquor Clarifier Causticizers White Liquor Mud storage Water Lime kiln Lime Water CaCO3 Evaporators
Figure 2-5 : Simplified schematic of the chemical recovery line
To meet the mills energy demand in cold winter conditions, power boilers fired with natural gas are used to supplement the recovery boiler. The number of power boilers in use depends on the production capacity of the mill, the efficiency of its unit operations and the design of the heat transfer network.
Three main reactions take place in the recausticizing department. First, the causticizing reaction that occurs in two steps: the lime reacts first with water (“slaking”) to form calcium hydroxide Ca(OH)2, which in turn reacts with sodium hydroxide:
CaO + H2O → Ca(OH)2 (exothermic reaction)
Ca(OH)2 + Na2CO3 ↔ CaCO3 + 2NaOH (equilibrium reaction)
Then, the calcium carbonate is converted to lime in the lime kiln: CaCO3 + Heat → CaO + CO2 (combustion of the lime mud)
The bleaching and recausticizing departments are the largest consumers of chemicals and are significant contributors to environmental pollution problems (the sulphide in the white liquor is a
contributing factor to the environmental problems) [11]. Several patents have been developed and offer significant improvements over the original process. Blackwell [12] proposes a new design for the recausticizing department, which involves a recirculation of causticizing reaction products to prolong the contact time between the reactants, in order to increase the yield of the reaction. The bleaching department uses significant quantity of chemicals, and thus generates a large amount of effluents to be treated, and therefore, is a factor of environmental deterioration. Paleos [13] proposes a new method for the treatment of bleaching effluents by discoloration through a macroreticular-resins bed. The effluents lose their organic pigments adsorbed on the resins, and can be discharged, reducing environmental pollution.
Moy and Styan [14] proposed a method for sodium chloride recovery in the chemical recovery loop to reduce the non process elements load and accumulation through an acidification process, precipitation and filtration. Singh [15] proposed a new bleaching process which reduces the amount of water and chemicals used, as well as the quantity of effluents generated. In this method the effluents from the final bleaching step in the chemical recovery department are recycled. Kooi [16] patented a design which does not use any sulfide nor chlorine in the bleaching department, thus reducing the consumption of chemicals and the production of effluents.
2.1.4 Utilities consumption
The Department of Natural Resources of Canada in collaboration with the Pulp and Paper Research Institute of Canada (now called FPInnovations) produced a benchmark for the energy consumption of North American P&P mills. This reference can help a mill position itself versus its competitors and compare its energy consumption in the various parts of the process to that of similar mills.
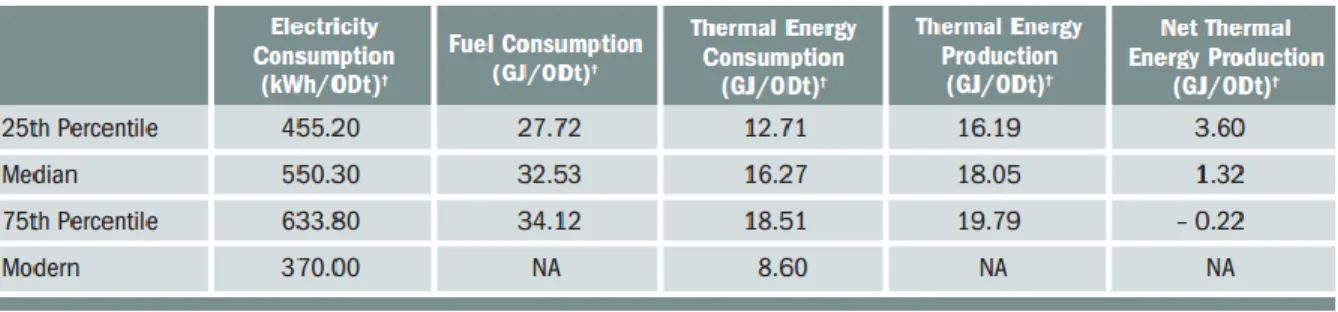
The main results of the survey are presented in table 2-1. The energy consumptions are normalized to a unit of production, the oven dried ton (odt) to facilitate the comparison.
Table 2-1 gives the average energy consumptions for a Kraft mill producing bleached pulp. Values were taken from 20 Canadian Kraft mills. The table highlights the large difference
between the most efficient and the least efficient plants [2]. The disparity in efficiencies shows that there is definitely potential for improvement in most Canadian Kraft mills.
Table 2-1 : Average energy consumption and production for bleached Kraft pulp
The energy efficiency depends strongly on the processes and technology used, and on the mill’s energy management and utilization strategy.
2.1.5 The biorefinery concept
The biorefinery is an industrial complex for the production of fuel, energy and various chemicals from biomass, by means of various specific processes [17]. This concept is very similar to oil refining through which combustible and various value-added products are manufactured. However, the biorefinery uses a renewable feedstock: lignocellulosic biomass. This biomass contains lignin, hemicelluloses and cellulose. These compounds are found in plant materials in varying proportions.
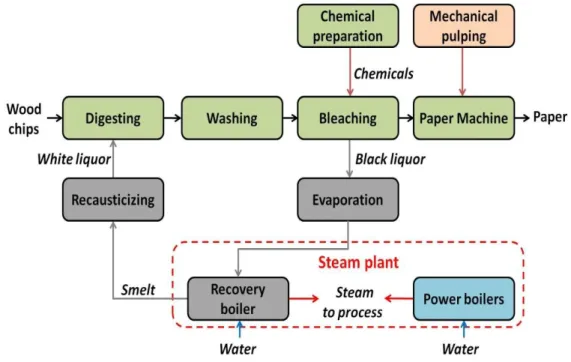
A biorefinery can exist as a standalone process or incorporated into an existing process as an integrated biorefinery. Implementation of the integrated forest biorefinery has significant advantages for both the P&P mill and the biorefinery. The infrastructures in place, the available manpower and the raw materials constitute an advantage to the P&P mill and make them good candidates as biorefinery receptors. The biorefinery is an effective way for the P&P mill to diversify its product portfolio and regain its economic prosperity. Figure 2-6 schematically shows the concept of the integrated biorefinery.
Figure 2-6 : Scheme of the integrated forest biorefinery [18]
The concept of the integrated forest biorefinery presented in figure 2-6 shows the material and energy streams exchanged between the processes. In the Kraft pulping process, only 42% of the woody biomass is converted to pulp and the rest (lignin and hemicelluloses) is combusted to produce energy for the process. This portion can be better utilized to increase the revenue margins of the mills. It can be converted into higher value products. Part of a process stream from the receptor mill rich in hemicelluloses, lignin or cellulose, could be diverted and fed to a converting biorefinery plant to produce value-added products. Kraft pulping is the prevalent pulp making process worldwide and is suitable for biorefinery integration because it is independent in terms of energy and material. The integration of the forest biorefinery process in P&P process permits the use of waste as inputs to one another and the use of common infrastructure to reduce the cost of both the pulp and paper and the biorefinery plants [19]. However, this implementation is subject to constraints and limitations. One constraint for the pulp and paper plant is high energy efficiency that ensures independence from fossil fuels. A prerequisite to the sustainability of the integrated forest biorefinery is a high level of efficiency of the receptor P&P mill in particular in regards to the consumption of steam and water. Before integrating the biorefinery, the receptor P&P plant must be optimized to provide enough energy to supply for the biorefinery demand. Enhancement modifications could be required for certain equipment of the Kraft receptor mill, before implementing the integrated biorefinery process.
2.2 Process Integration Techniques
Process Integration (PI) is an efficient approach that can be used to increase the profitability of paper mills through reduction of energy, water and raw material consumption and thereby, their operating costs. PI encompasses several methods that can be based on mathematics, thermodynamics or economics.
Process integration, combined with other tools such as process simulation, data reconciliation or life cycle analysis, is a powerful and efficient approach to systematically analyse the performance of an industrial process and understand the interactions between its various parts.
PI techniques serve to address many industrial issues such as debottlenecking of critical areas in a given process, utility system optimization, energy saving, and GHG emission reduction [20]. The PI techniques can be classified according to the approaches on which they are based. Thus, one can identify 3 types of PI for the design and optimization of heat exchangers networks:
Conceptual approaches based on thermodynamic principles, better known as pinch analysis [21].
Numerical approaches based on mathematical models.
Hybrid approaches combining graphical and mathematical methods. 2.2.1 Pinch analysis
Pinch analysis is the most widely used PI approach, whereby it is possible to visualize a global picture of the energy use in the process. This method can be used to quickly identify areas of rule violations, which are symptomatic of energy inefficiencies in a process. Other more complex mathematical methods have been developed to optimize energy use in a plant, taking into account the specific constraints of each of the process components.
a) Thermal Pinch
Pinch Analysis is a structured approach to utility management. It is a standard tool to increase internal heat recovery. The purpose of pinch analysis is to maximize internal heat recovery within a process and to minimize the need for hot and cold energy supplied by utilities. It was developed
at the beginning of the 1980’s [22-24] and has been proven to achieve energy reductions. Pinch analysis significantly improves both process design and design process [25, 26]. Rather than complex mathematical methods, pinch analysis uses a simple concept. The principle is that the process is defined in terms of supplies and demands (sources and sinks) of commodities (energy, water, etc.). In that sense, composite curves are constructed and displayed in a temperature vs. enthalpy diagram (all possible heat transfers within the process). Figure 2-7 illustrates the pinch principle. The optimal solution is achieved by appropriately matching suitable sources and sinks.
Figure 2-7 : Simplified schematic of the pinch analysis basic principles [20]
The composite curves constructed from the energy sources and sinks identify the potential savings. The pinch point represents the minimum temperature interval between the two curves. In old Canadian pulp and paper mills, the heat exchangers network was designed and installed without considering the pinch rules. Therefore, economically attractive energy savings can be obtained simply by respecting the pinch rules.
The application of pinch analysis to industrial sectors such as petrochemicals and pulp and paper can typically represent around 10 to 25% savings in energy consumption and around 25 to 40% in water consumption [20].
• It is a graphical method that provides a visual approach to the phenomena, whereas most of the optimization methods are purely numerical.
• It reduces the investment and operating costs.
• Optimization can be performed before making assumptions about the network configuration. b) Water Pinch
The integration of the water network was used primarily to serve the energy integration [27]. Originally, the 'Thermal Pinch' method has inspired a water pinch method to identify areas of violation of the pinch rules and reduce water consumption in the plant based on similar principles. A water consumption reduction would also reduce the overall energy consumption. The water pinch method provides a graphical solution for the potential reduction of water intake and effluents rejects.
The fundamental theoretical formulations for water pinch have been pioneered by Linnhoff. [24] Wang and Smith [28] and El-Halwagi [29]. These concepts have been successfully applied to a wide range of chemical process industries with typical fresh water savings in the range of 15-40% and wastewater savings of 20-25% [30].
c) Energy-Water Integration
Improving the energy efficiency of pulp and paper mills is strongly related to the proper management of water because water is the main medium of heat transfer, pulp washing and material transport. The larger the amount of water consumed and effluent produced within the mill, the larger the energy required for heating/cooling and pumping the process streams [31-34]. This strong correlation between water and heat underlines the necessity to develop a methodology that can address the simultaneous reduction of energy and water requirements [18]. Several authors have developed pinch-based methodologies investigating energy and water utilization. Schaareman et al. [35] applied in sequence and iteratively energy and water pinch analyses. However, thermal aspects were not taken into consideration to propose water reduction measures. Koufos and Retsina [30, 36] applied a similar study on a de-ink treatment facility. Savulescu et al. [37] suggested a combined procedure to simultaneously analyse water and
energy consumption taking into consideration systems interactions. Brown et al. [31] developed a methodology combining pinch, exergy and mathematical optimization to identify and evaluate thermal efficiency of pulp and paper process. Mateos et al. [38-42] studied the complete process to determine the water reuse opportunities and analyse the impact on the overall thermal performance. The methodology has been applied to a Canadian Kraft mill. Performance indicators and the evolution of composite curves have served in the application of the method to monitor the process performance [18].
A pinch-based approach for a combined energy and water efficiency enhancement methodology has been developed by Keshtkar et al. [18, 32] which is an extension of the methodology developed by Mateos et al. [43] . Its application to three Canadian Kraft mills revealed over 26% of energy savings and over 33% of water reduction [18], which is far superior than engineering practice. An exhaustive report of the results obtained by the application of the methodology is found in the appendix B of this thesis, and is published in PAPTAC Journal in 2015.
2.2.2 Mathematical optimisation
In addition to the graphical methods, mathematical methods have been developed for energy and water optimisation and integration. An optimization problem consists of maximizing (in the case of power generation) or minimizing (in the case of energy use or production costs) an objective function, of n decision variables, subject to a set of constraints (mass or thermodynamic balance) expressed in the form of linear equations or inequalities. Several mathematical energy integration methodologies have been developed and presented.
Goortani et al. [44] used a mathematical optimization method to study the impact of the implementation of a cogeneration unit, along with other measures, to improve the energy efficiency of a Kraft mill. The results of their study showed a significant improvement in energy savings and a production of a considerable surplus of energy. Savulescu et al. [34] studied and developed a systematic method, based on the pinch tool for the energy integration and the identification of an optimal design of heat exchanger networks. Rafione et al. [45] developed a mathematical model to optimize the integration of energy and water networks in a green integrated Kraft forest biorefinery. Mathematical optimization for water and energy integration of
Kraft processes or Kraft integrated biorefineries is an interesting tool to identify potential savings. Its practical application is however complicated and is not part of the tool kit of mill engineers. This is its main limitation.
2.3 Process simulation
A thorough understanding of the physical or chemical phenomena and knowledge of related properties of the involved components are a prerequisite for process simulation. Process simulation is a model-based representation of a chemical, physical or biological process and unit operations, using a computer software. This computerized representation of a process enables engineers to perform optimization, integration or validation analyses and also to find optimal operating conditions. Hence, it is a useful tool to address many engineering issues. The use of process simulation plays a key role in developing an integrated approach to process design. It also saves time and money before the implementation of a real concept. This practice can assist engineers and mill operators with troubleshooting design, control, and revamping of unit operations. Many petrochemical and chemical industries have been using process simulations for these reasons. Many types of software have been used; one can name, for example, ASPEN Plus® for simulation of macroscopic unit operations and COMSOL Multiphysics® for microscopic and dynamic simulation of physical phenomena.
However, the simulation of a pulp and paper process is very different from petrochemical processes because of the nature of the reactions involved, the different phases and compounds interactions. Several softwares for pulp and paper process simulation are commercially available such as WinGEMS, BALAS or CADSIM. These Softwares operate either in continuous or dynamic mode and are specially designed to simulate the pulp and paper process. They include software modules representing the specific unit operations of pulping processes.
The simulation software used in this research study is CADSIM Plus, developed and distributed by Aurel Systems. CADSIM Plus is a specialized software, focused on P&P processes widely used by the forest industry in Canada.
2.4 Data reconciliation and gross error detection
Process simulation and data reconciliation are complementary tools with appreciable synergetic effects. The construction of a simulation that accurately represents the process configuration and operating conditions is preliminary to any process performance analysis. The objective of process simulation is to supply data for performance evaluation or process integration studies. However, a real pulp and paper plant is never in a true and rigorous steady-state; adjustment of operating conditions, change in the source of raw materials, equipment turnover, feed rate variations, or maintenance shutdown cause the system to constantly fluctuate, perturbing its steam, water and raw material consumption [41]. Therefore, measurements are needed to monitor the process efficiency, to verify that the operating conditions remain within required range, to ensure good product quality, and to avoid equipment failure or any hazardous conditions.
However, the measurements inherently contain errors, whether random or gross errors. Therefore, the mass and energy equations around unit operations often do not balance. Data reconciliation aims to adjust the measurements so that the energy and mass conservation laws are respected. Data reconciliation is essential for efficient development of coherent simulation models that supply reliable data.
Figure 2-8 displays the classification of process variables in a system and table 2-2 summarizes the basic fundamentals, necessary for the understanding of the concepts of data reconciliation and gross error detection.
Figure 2-8: Classification of process variables
Table 2-2 : Definition of important data reconciliation parameters Parameter Definition
Random error If a measurement of a process is repeated under identical conditions, the same value is not obtained. This is due to the presence of random errors, or ‘noise’ in the system. Random errors occurrence is governed by the probability laws. They cannot be predicted nor explained. They can be adjusted and their impact can be minimized with large sample sizes of observations.
Gross error Refers to a deviation in a measurement that is not only due to randomness of occurrence. Probable sources are improper calibration of the measurement device, deterioration of the equipment or the device, wrong operating conditions, etc. A gross error has a magnitude and a direction (positive or negative sign), and does not follow the probability law. It is consistent and large number of observations does not eliminate its effect. It must be eliminated otherwise the conclusions of the analysis may be
invalid.
Residual The residual is the difference between any observation and its most probable value. The residual of balance of constraints is the remainder when the conservation laws are not conserved. The residual vector reflects the degree of violation of material ad energy conservation laws.
Observable variable
An observable variable is an unmeasured variable that can be estimated from measured variables through the process constraints.
Unobservable variable
An unobservable variable is an unmeasured variable for which no information is available.
Redundant variable
A redundant variable is a measured variable that can be estimated by other measured variables through process constraints, in addition to its measurement.
Non-redundant variable
A non redundant variable is a measured variable that cannot be estimated other than by its own measurement.
Process constraints
The model process constraints are typically mass and energy conservation laws.
Redundancy (spatial and temporal)
A measurement is spatially redundant if there are more than enough data to completely define the process at any instant in time. A measurement is temporally redundant if its past measurements can be used to estimate the current state. A typical case for a temporally redundant measurement is that, at the current sampling time, t, the true value of the process variable can be predicted by dynamic models, in addition to the raw measurement. Observability A system is observable when all the unmeasured variables can be estimated
via process constraints and the available measurements. Reconciliation
feasibility
The reconciliation is possible only if the system considered is both observable and redundant. In other words, all the unmeasured variables can
be estimated, and there is additional information (redundancy) to validate the computations, and adjust the redundant measurements.
Bilinear systems Bilinear systems are a special case of non linear systems, in which non linear terms are constructed by multiplication of control vector and state vector such as: yTAx = constant.
Level of confidence
A level of confidence is a measure of reliability of a statistical result. For a 95% (α=5%) confidence interval, the probability of observing a value outside of this area is less than 0.05.
Data reconciliation techniques have only been applied since recently to P&P [46]. In fact, in the P&P industry, it has been noted that there are few examples of large-scale simulations that are actually based on reconciled data collected from processes in operation [46]. Data reconciliation requires a large amount of data to solve the modeling equations. In spite of the abundance of information that can be acquired using process sensors, a considerable amount of additional measurements are still required to reach a satisfactory level of redundancy and thus, perform data reconciliation in an operating P&P mill. This is due to the fact that measurement devices in a P&P mill have not been placed to perform effective data reconciliation. In fact, P&P mills perform as few measurements as necessary to produce a product of constant quality and to estimate daily expenses and revenues. Jacob and Paris [46] presented an off-line data reconciliation technique for data calibration of a paper deinking process and a newsprint mill. Bellec et al. [47] used an on-line systematic method to improve data quality of real-time measurements of pulp and paper mills. However, no data reconciliation of a Canadian Kraft or pulp and paper mill has been published.
2.4.1 Data reconciliation: problem formulation
Data reconciliation is an optimization problem that aims to minimize the weighted sum of squared differences between the measured and the reconciled values under constraints that correspond to mass and heat balances. Mathematically, it can be formulated by the following constrained weighted least-squares optimization problem [48]:
(1)
In vector form, this equation becomes,
(2)
It is subject to the constraints:
(3)
The number of constraints in the model is m, and y is the measurement vector that can be written:
(4)
The vector x, is the vector of true values of the measurement variables, and is the vector of random measurement errors, that are normally distributed with zero mean and possess a covariance matrix W. The vector u is the vector of unmeasured observable variables that should be estimated by the reconciliation procedure. The (m) constraints correspond to mass and energy balances that must be satisfied, and are encapsulated in the term .
Several methods presented in the literature have been developed to solve optimization problems. The complexity of the techniques depends strongly on the constraints imposed, which can be linear (case of global mass balances) or non linear (case of energy balances and individual component mass balances).
The analytical solution of the optimization problem under linear constraints, with all variables measured, is obtained by means of Lagrangian multipliers [49, 50], and is given by:
(5)
Under the constraints:
(6)
The details of the mathematical development can be found in appendix A of the thesis. The incidence matrix (A) corresponds to the Jacobians of the constraints, and V is the covariance matrix of random errors as mentioned earlier.
![Figure 2-6 : Scheme of the integrated forest biorefinery [18]](https://thumb-eu.123doks.com/thumbv2/123doknet/2322982.29522/35.918.266.658.145.413/figure-scheme-integrated-forest-biorefinery.webp)