“ 'Gainst the wall of knowledge I
All my little wisdom try. ”
“Pangur Bán”
I dedicate this work to the MS patients and their families for the courage, understanding and patience needed to live with this condition.
I would like to thank my thesis director, Dr. Maria Martinez, and co-director, Prof. David Brassat, for this life changing experience. I am deeply indebted to you, David, for giving me this opportunity and to you, Maria, for making sure I do not waste it. David, thank you for your great sense of humor and constant positive attitude but I especially thank you for explaining to me the many complexities of MS. Maria, thank you for pushing me to excel both professionally and personally and for introducing me to the fascinating field of genetic epidemiology. Both of you encouraged me to attend courses and conferences and to develop my scientific skills. Both of you provided me with many opportunities to meet with leading scientists in the respective fields. I am very grateful to you for that. Most of all, however, I am grateful to both of you for giving me a project that I loved working on.
I sincerely thank the reviewers of my thesis, Dr. Emmanuelle Génin and Prof. Laurent Becquemont, for accepting to judge my work and for the time and effort they devoted to it. I also express my regret that Dr. Justo Lorenzo Bermejo could not serve on my jury.
I thank the members of the comité de suivi, namely, Prof. Bertrand Fontaine, Dr. Nicolas Blanchard and Dr. Frédéric Taieb, for evaluating the status of my work and advising me on its progress halfway through my studies. I especially thank Nicolas who, as my parrain de thèse, continued to advise and help me when needed.
Given the multidisciplinary nature of my project, it is no surprise that it required the collaboration of people with different expertise. While this presented challenges in itself, it made my experience richer and I thank Prof. Roland Liblau and Dr. Abdelhadi Saoudi (Team 5: Inflammatory diseases of the central nervous system: mechanisms and therapy), and Dr. Marie-Paule Roth and Dr. Hélène Coppin (Team 13: Genetics and iron metabolism regulation) for welcoming me in their respective teams. The CRs in these teams were like mentors to me. I would like to specifically thank Lennart Mars (Team 5) for numerous fruitful discussions on my project as well as on many other topics and François Canonne-Hergaux (Team 13) for his honesty and scientific integrity. I also thank François for his valuable and refreshing company during the lunchtimes and for introducing me to Lorenne Robert and Thierry Duprat who added to the animated and varied discussions during the lunches that I much appreciated.
I thank the ladies of Prof. David Brassat’s research and clinical teams, and notably the research team, Florence Bucciarelli, Béatrice Pignolet, Lise Scandella and Florence Umuhoza, for their positive attitude and encouragement especially towards the end. Florence B., I admire your efficiency and skillful management of the projects. Béatrice, your kindness on many occasions has marked me. Lise, while I missed seeing you around in the lab, the few times you brought us Coralie all made up for it. Florence U., there is such grace and style in you. Thank you all for making it a pleasure to work with you.
I further thank all my past and current officemates for creating a pleasant working environment including, recently, Myriam Hayder and Raphaelle Romieu-Mourez, who were also very supportive in these final steps.
I thank all members of Teams 5 and 13 as well as of the teams of Daniel Dunia, Nicolas Blanchard and Renaud Lesourne with whom I also interacted although on a less frequent basis throughout these
I am very grateful to Andrés Legarra, from INRA Toulouse (Auzeville), for introducing me to the multi-marker models and explaining to me the software tools to conduct the multi-marker analyses which became an integral part of this thesis.
It is a pleasure to thank Institut national de la santé et de la recherche médicale, INSERM U1043, and Centre de Physiopathologie de Toulouse Purpan, CPTP, where I conducted my work for the excellent working conditions that were provided to me. I also thank the administrative staff from these institutions, especially, Dominique Rozet, Nathalie Frances and Jennifer Galtié from CPTP and Stéphanie Azalbert from INSERM U1043 for their kindness, efficiency and their indispensable help through the bureaucratic labyrinth on numerous occasions.
Similarly, I thank Christine Ferran and Sabine Aubineau from INSERM U1043 Communications with whom I enjoyed organizing the annual “rencontres chercheurs patients”. I take this opportunity also to thank once again all the researchers who kindly accepted to participate in these meetings. These meetings required a certain level of scientific maturity and skill and that is why I particularly acknowledge the effort made by those in earlier stages of their careers to present their projects: Charlotte Foret, Caroline Charlier, Liliana Lucca, Myriam Hayder, Anne Dejean, Sophie Laffont-Pradines and Lennart Mars.
Throughout my PhD years, I had the absolute pleasure of meeting many MS patients professionally as well as informally. Special mention goes to Anne-Marie Blech and Sonia Mazoyer for the pleasant moments we shared.
My studies were financed by two different grants. It is a privilege for me to acknowledge them here: United Europeans for the development of PHArmacogenomics in Multiple Sclerosis (UEPHA*MS, Marie Curie Initial Training Network) and la Fondation pour l’Aide à la Recherche sur la Sclérose En Plaques.
I extend a special thank you to my friends and colleagues from Statistics Canada. Your support was much valued. I am especially grateful to my former supervisor, Pierre Daoust, and my colleague and friend, Olena Frolova, for their support during the year prior starting my PhD. Referring to that year, I also acknowledge the advice I received from my master’s thesis supervisor, Prof. David Wolfson. Already seven years have passed since I last worked with you and learnt from you, David, but your influence continues to this day.
Throughout the PhD years, I faced many difficult moments but today all this is irrelevant simply because I only remember how good it felt to share these moments, as well as great ones, with the following people: Aude Saint-Pierre, Mohamad Saad, Myriam Lawand, Amit Saxena, Abdulraouf (Raouf) Ramadan, Matthias Macé, Sahar Kassem, Amine Benarbia, Elodie Persyn, Cristina Bucur, Liliana Marques and Audrey Cauchard.
I thank Aude and Mohamad for the warm welcome in their team right from day one and for constantly reminding me of the reward of perseverance. I thank Myriam and Amit for making an unforgettable ambiance in the office in my first year and for the memorable moments we have shared outside it. I have not stopped missing you. I thank Raouf for his humanity and extreme generosity. Matthias, your free spirit and intelligence are unique and precious. Sahar, I admire your maturity and mental force…and, of course, your culinary skills. Thank you for being by my side in crucial moments and
the French translation of this thesis abstract. Elodie, how lucky we were to have you! Cristina, not once you failed to “entertain” us with your stories. Luck is a relative concept, never think of it in absolute terms! Liliana, where do I begin…if it was not for you, I would not have had the stamina to work as hard as I did completing my thesis. Thank you for teaching me that everything should be given the time it deserves even if time is not on our side. Audrey, you know how much I appreciated your presence and the team dynamic you created. I am only sorry we crossed paths so briefly.
Being in Europe gave me the opportunity to meet again some of my Canadian friends who have returned to their roots including Danae Mahera and Daniele Toninelli. That was truly special and I thank you for keeping our friendship lit after so many years.
I enjoyed living in Toulouse and there are few places in this city the beauty and majesty of which gave me comfort at times of distress and which are engraved in my memory. I thank my flatmates in my first year, Claire-Léa Boccard and, especially, Hélène Fassolis. You were my first contact with life outside work here in Toulouse and, to this day, I find hard to believe the luck I had in finding you. In the two years that followed, I lived chez Mme. Anne-Lise Couineau and, this, quite frankly, was one of the most enriching encounters of my life. I have always said that you are an extraordinary woman, Anne-Lise. Thank you for your attentive gestures and artistic creations, for constantly reminding me of the importance of humor in our lives, for sharing your treasures - your books and written works - with me and for the long and deep discussions on so many varied topics. It is two years rich in memories, precious memories, thank you. Unforgettable is also my encounter with Jianli, my Chinese characters teacher. The world of Chinese characters is truly fascinating, Jianli, and you managed to instill in me great admiration for it but what most impressed me was your unbounded benevolence.
I have often wondered where I would be if I did not have the constant love and support from my family and, especially, my parents and my brother. You have been the backbone of every single achievement of mine and no words are enough to thank you for this. Yet, education begins at home and it is the kind of education that can be attained with no academic degree - that of love, compassion and devotion. There were times when I would cease to believe in the essence of the immense effort required behind this PhD. It is precisely the education you have given me that helped me regain my belief and keep going.
The field of genetics is rapidly expanding and evolving. As more and more is understood on the genetics of complex human traits, a natural question arises as to how these findings can be translated to the everyday medical practice. While a little more than a decade ago sequencing the entire human genome was achieved by the largest international scientific collaboration ever undertaken in biology, today it is not farfetched to expect that in the near future obtaining the genetic profile of each patient may become routine medical practice. Pharmacogenomics, a blend of pharmacology and genomics, aims to determine the most suitable treatment for each patient as a function of his or her genetic makeup. Pharmacogenomic studies have increasingly provided evidence that there are gains to be achieved by incorporating genetic information when determining the optimal treatment choice for a patient. The case of warfarin, an anticoagulant, has often been considered as one of the most motivating success stories to pursue such type of studies. The success as well as the need of such studies, however, depend on a multitude of factors and vary greatly across traits.
The objective of this thesis is to evaluate the current state of the art for Multiple Sclerosis (MS), a debilitating neurological disorder affecting primarily young adults. To date, no cure exists for MS but a number of disease-modifying therapies have been approved with varying degree of efficacy and toxicity. So far, little is known on the genetic factors that influence response to treatment in MS patients. Moreover, even if such factors are known apriori, evaluating and proving their utility at the clinical level is not as straightforward as one may be inclined to think. In this thesis, we highlight why the road to translate such findings to medical practice remains rough and challenging.
In particular, relying on the association and prediction studies that we have conducted, we expose the design and limitations of each and discuss model choice in each context. Specifically, we conducted marker association analysis of response to interferon-β in MS patients. We compared single-marker to multi-single-marker models in the context of association and also in that of prediction using both real and simulated datasets. Different approaches to multi-marker modeling exist. We focused on polygenic score analyses and Bayesian estimation methods and evaluated several of the properties of these modeling approaches.
Our findings showed that, in the context of association, the use of more complex and computationally heavy multi-marker models that has been recently advocated may lead to little, if any, benefit over the classical single-marker association analysis. On the other hand, multi-marker models that take into account the effect of many markers simultaneously clearly appear better suited to predict genetic risk. Nevertheless, focusing on polygenic score analyses, we demonstrated that many factors such as the study sample size and the heritability of the trait influence the predictive performance of a model. Pharmacogenomic studies may revolutionize patient care. However, in all the excitement of the promise that they hold, in the concluding part of this thesis we also address the social, ethical and economic issues that they raise.
KEYWORDS: pharmacogenomics, multiple sclerosis, interferon-β, association study, prediction study, genetic markers, polygenic scores, Bayesian estimation methods, ethics
L’expansion ainsi que l’évolution du domaine de la génétique au cours de ces dernières années a été fulgurante. Cela s’accompagne par la génération d’une masse importante d’information génétique sur les traits complexes chez l’homme. Une question naturelle est de savoir comment utiliser cette information dans la pratique médicale quotidienne. Il y a dix ans à peine le séquençage du génome humain nécessitait une collaboration scientifique d’envergure internationale entre les différents acteurs de la recherche biomédicale. Aujourd’hui, il n'est pas exclu à ce que, dans un avenir proche, on puisse obtenir le profil génétique de chaque patient dans la pratique médicale courante. La pharmacogénomique, une fusion de la pharmacologie et de la génomique, vise à déterminer le traitement le plus approprié à chaque patient en fonction de son patrimoine génétique. En effet, plusieurs études pharmacogénomiques ont pu démontrer l’intérêt d’intégrer l'information génétique du patient pour déterminer son traitement optimal. Le cas de la warfarine, un anticoagulant, a souvent été considéré comme l'un des succès les plus motivants pour poursuivre ce type d'études. Cependant, le succès ainsi que le besoin de ces études dépendent de multiples facteurs et varient considérablement selon les traits étudiés.
L'objectif de ce travail est d'évaluer l'état actuel des connaissances pour la sclérose en plaques (SEP), une maladie neurologique invalidante touchant principalement les jeunes adultes. À ce jour, il n'existe aucun remède à la SEP, mais il existe des traitements modificateurs de la maladie avec des degrés d'efficacité et de toxicité variable. Les facteurs génétiques qui influencent la réponse au traitement chez les patients atteints de SEP sont à ce jour mal connus. Même si ces facteurs peuvent être mis en évidence dans le futur, il n’en demeure pas moins que leur utilisation en routine clinique n’est pas aussi simple que supposée. Dans ce travail, nous avons essayé de mettre en évidence la complexité du passage de l’utilisation de données génétiques à grande échelle à la pratique médicale pour les traits complexes.
Nous avons mené des études d’association et de prédiction. Tout d’abord, nous exposons leurs concepts et revisitons les différences dans leurs objectifs. Plus précisément, nous avons effectué une analyse d’association simple-marqueur de la réponse à l'interféron-β chez les patients atteint de SEP. Ensuite, nous avons comparé les modèles simple-marqueur et multi-marqueur dans le contexte de la recherche d’association puis dans celui de la prédiction en utilisant des données réelles et des données simulées. Différentes approches de modélisation multi-marqueur existent. Nous nous sommes basés sur l'analyse des scores polygéniques et des méthodes d'estimation bayésienne en évaluant plusieurs des propriétés de ces approches de modélisation.
Nos résultats montrent que, dans la cadre d’une étude d’association pangénomique, les modèles multi-marqueurs, récemment préconisés, ne sont pas forcément plus puissants que les modèles classiques simple-marqueur. En revanche, les modèles multi-marqueurs qui prennent en compte l'effet de plusieurs marqueurs simultanément apparaissent clairement mieux adaptés pour prédire le risque génétique. Néanmoins, en se concentrant sur l'analyse des scores polygéniques, nous montrons que de nombreux facteurs comme la taille de l'échantillon de l'étude et l'héritabilité du trait influencent la performance prédictive d'un modèle.
Les études pharmacogénomiques peuvent révolutionner les soins aux patients. Cependant, en dehors de l'enthousiasme qu’elles peuvent susciter, nous discutons dans la dernière partie de cette thèse les questions sociales, éthiques et économiques qu'elles soulèvent.
MOTS-CLÉS: pharmacogénomique, sclérose en plaques, interféron-β, étude d’association, étude de prédiction, marqueurs génétiques, scores polygéniques, méthodes d'estimation bayésienne, éthique
ACKNOWLEDGEMENTS I
ABSTRACT V
RESUME VII
TABLE OF CONTENTS IX
LIST OF FIGURES XIII
LIST OF TABLES XVII
1 INTRODUCTION 1
1.1 THE GENETIC MATERIAL 1
1.2 BIOMARKERS 3
1.3 PHARMACOGENETICS AND PHARMACOGENOMICS 3
1.4 STUDY DESIGNS 4
1.5 MULTIPLE SCLEROSIS 6
1.6 MULTIPLE SCLEROSIS GENETICS 9
1.7 MULTIPLE SCLEROSIS THERAPIES 11
1.8 RESPONSE DEFINITION TO MULTIPLE SCLEROSIS THERAPIES 13
1.9 PHARMACOGENOMIC STUDIES OF MULTIPLE SCLEROSIS TO DATE 16
1.10 THESIS OBJECTIVE 19
2 LAYING THE FOUNDATIONS 21
2.1 UNDERSTANDING THE HUMAN GENOME 22
2.2 GENETIC VARIATIONS 24
2.3 LINKAGE EQUILIBRIUM/DISEQUILIBRIUM 25
2.3.1 RECOMBINATION 29
2.3.2 MUTATION,GENETIC DRIFT,NATURAL SELECTION AND MIGRATION 32
2.4 TAG SNPS 32
2.5 SNPGENOTYPING 33
2.6 SNPCHIPS 34
2.7 TESTING FOR HARDY-WEINBERG EQUILIBRIUM 34
2.8 WHERE ARE WE NOW? 36
3 GENETIC ASSOCIATION STUDIES 39
3.1 TRAITS 39
3.1.1 QUANTITATIVE TRAITS 39
3.2.2 BINARY TRAITS 42
3.3 PENETRANCE (GENETIC EFFECT) 43
3.4 METHODS 45
3.4.1 ALLELIC TESTS 46
3.4.2 GENOTYPIC TESTS 49
3.4.3 ANOTE ON QUANTITATIVE TRAITS 52
3.4.4 THE POWER OF TESTS FOR CONTINGENCY TABLES 54
3.5 PITFALLS AND LIMITATIONS OF GENOME-WIDE ASSOCIATION STUDIES 56
3.5.1 MULTIPLE TESTING 56
3.5.2 DIRECT,INDIRECT AND CONFOUNDED ASSOCIATIONS 56
3.5.3 EFFECT SIZE AND ALLELIC FREQUENCY 58
3.5.4 STUDY SAMPLE SIZE 59
3.5.5 MISSING HERITABILITY 61
3.5.6 UNDERLYING GENETIC MODEL 61
3.5.7 MODELING STRATEGIES 61
3.6 APPLICATIONS 62
3.6.1 ROLE OF THE 2'-5'-OLIGOADENYLATE SYNTHETASE 1(OAS1) GENE IN INTERFERON RESPONSE
IN MS PATIENTS 62
3.6.2 ROLE OF THE INTEGRIN ALPHA 4 SUBUNIT (ITGA4) GENE IN NATALIZUMAB RESPONSE IN MS
PATIENTS 71
3.6.3 MULTI-MARKER MODELING OF GWASDATA ON PARKINSON’S DISEASE 75 3.6.4 POLYGENIC SCORE ANALYSES OF SIMULATED DIASTOLIC BLOOD PRESSURE DATA 82
4 GENETIC PREDICTION STUDIES 99
4.1 METHODS 100
4.1.1 CAREFUL CONSIDERATION OF THE PREDICTION PROBLEM 100
4.1.2 CODING THE PREDICTORS IN THE MODEL 101
4.1.3 SPECIFICATION OF THE MODEL 101
4.1.4 ESTIMATION OF THE MODEL PARAMETERS 102
4.1.5 EVALUATION OF THE MODEL PERFORMANCE 102
4.1.6 GENERALIZABILITY OF THE MODEL 109
4.1.7 PRESENTATION OF THE MODEL 116
4.2 PITFALLS AND LIMITATIONS OF GENETIC PREDICTION STUDIES 118
4.2.1 DIRECT,INDIRECT AND CONFOUNDED ASSOCIATIONS:IMPLICATIONS ON PREDICTION
ACCURACY 118
4.2.2 HYPOTHESIS-DRIVEN VERSUS HYPOTHESIS-FREE 119
4.2.3 GUARDING AGAINST FALSE PREDICTIONS 119
4.2.4 GENETIC ARCHITECTURE OF COMPLEX TRAITS AND DISEASES 120
4.2.5 STUDY SAMPLE SIZE AND MARKER PANEL COVERAGE 120
4.2.6 PHENOTYPE ISSUES 124
4.2.7 CLINICAL USE OF THE FINDINGS 124
4.2.8 MODELING STRATEGIES 126
4.3 APPLICATIONS 126
5 CONCLUSION 139
5.1 WHAT HAVE WE LEARNED? 139
5.1.1 SUSCEPTIBILITY TO MULTIPLE SCLEROSIS 139
5.1.2 RESPONSE TO MULTIPLE SCLEROSIS THERAPIES 140
5.2 FUTURE DIRECTIONS 142
5.3 OTHER CONSIDERATIONS OF PHARMACOGENOMIC STUDIES 143
REFERENCES 147
I. APPENDIX I: GENE NAMES FOR GENES CITED THROUGHOUT THE THESIS 159
II. APPENDIX II: CLINICAL CHARACTERISTICS OF THE COHORTS INCLUDED IN
THE OAS1 STUDY 161
FRANCE 161
GERMANY 162
ITALY 163
SPAIN 164
ALL PATIENTS (FRANCE/NON-FRANCE) 165
III. APPENDIX III: BASELINE CHARACTERISTICS OF THE PATIENTS INCLUDED IN
THE PREDICTION STUDY ON NATALIZUMAB RESPONSE (SECTION 4.3.1) 167
CLINICAL CHARACTERISTICS 167
BIOLOGICAL CHARACTERISTICS 168
RADIOLOGICAL CHARACTERISTICS 169
IV. APPENDIX IV: SCIENTIFIC PRODUCTION 171
SELECTED ORAL PRESENTATIONS 171
SELECTED POSTER PRESENTATIONS 171
FIGURE 1.1:HOW GENETIC INFORMATION IS STORED IN OUR BODIES.ADAPTED FROM (MAYO CLINIC STAFF,2011). ... 2 FIGURE 1.2:EPIDEMIOLOGICAL STUDY DESIGNS.ADAPTED FROM (LONDON SCHOOL OF HYGIENE AND TROPICAL
MEDICINE,2013). ... 5 FIGURE 1.3:MS DISEASE PROGRESSION MAY BE GROUPED INTO FOUR MAJOR CATEGORIES: RELAPSING-REMITTING MS(A), PROGRESSIVE-RELAPSING MS(B), SECONDARY-PROGRESSIVE MS(C) AND PRIMARY-PROGRESSIVE MS(D).ADAPTED FROM (MSSOCIETY OF WESTERN AUSTRALIA,2013). ... 8
FIGURE 1.4:WORLD ATLAS OF MS PREVALENCE.ADAPTED FROM (WORLD HEALTH ORGANIZATION,2008). ... 9 FIGURE 1.5:ESCALATION APPROACH TO MS TREATMENT. ... 12 FIGURE 1.6:ASSESSING TREATMENT RESPONSE IN RELAPSING FORMS OF MS BASED ON EDSS PROGRESSION AND
NUMBER OF RELAPSES EXPERIENCED OVER THE EVALUATION PERIOD. ... 14 FIGURE 2.1:THE FLOW OF GENETIC INFORMATION AS DESCRIBED BY FRANCIS CRICK TAKEN FROM AN EARLY
DRAFT OF THE ORIGINAL ARTICLE PUBLISHED IN 1958((CRICK,1956);(CRICK,1958)). ... 21 FIGURE 2.2:THE FLOW OF GENETIC INFORMATION AND THE TYPE OF ANALYTICAL APPROACHES PERFORMED
DEPENDING ON THE UNIT OF ANALYSIS AT EACH LEVEL. ... 22 FIGURE 2.3:TYPES OF HUMAN GENETIC VARIATIONS.ADAPTED FROM (FRAZER ET AL.,2009). ... 24 FIGURE 2.4:A TYPICAL LD PLOT WITH AS THE MEASURE OF LD.SNPS 1 AND 2 ARE IN WEAK LD WITH
WHILE SNPS 5 AND 6 ARE IN STRONG LD WITH .THE SHADING OF EACH DIAMOND IS PROPORTIONAL TO THE VALUE RANGING FROM WHITE FOR TO BLACK FOR .ADAPTED FROM (LESSARD ET AL.,2012). ... 28 FIGURE 2.5:LD PLOTS BASED ON AS THE MEASURE OF LD FOR A REGION ON CHROMOSOME 9 AND FOR THREE
HAPMAP POPULATIONS:CEU(EUROPEAN),CHB+JPT(ASIAN) AND YRI(AFRICAN).THE SHADING OF EACH DIAMOND IS PROPORTIONAL TO THE VALUE RANGING FROM WHITE FOR TO RED FOR . ADAPTED FROM (FRAZER ET AL.,2009). ... 29 FIGURE 2.6:DURING MEIOSIS, HOMOLOGOUS CHROMOSOMES UNDERGO CROSSING-OVER PRODUCING
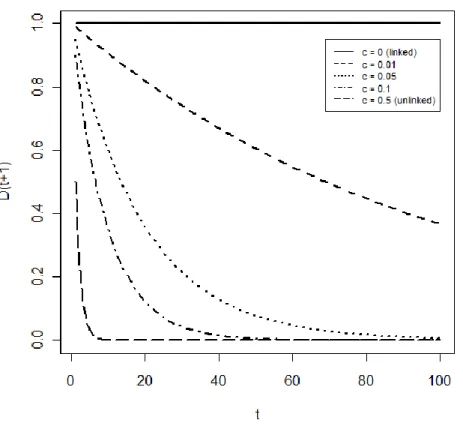
CHROMOSOMES CONTAINING GENETICALLY HETEROGENEOUS REGIONS.ADAPTED FROM (GENETICSSUITE, 2013)... 30 FIGURE 2.7:LD DECAY AS A FUNCTION OF GENERATION AND RECOMBINATION FREQUENCY . ... 31 FIGURE 2.8:DESCRIBING COMMON PATTERNS OF HUMAN GENETIC VARIATION.(A)DNA SEQUENCES OF FOUR
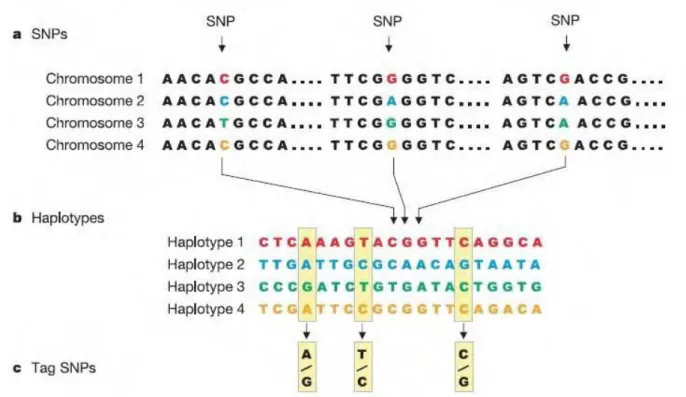
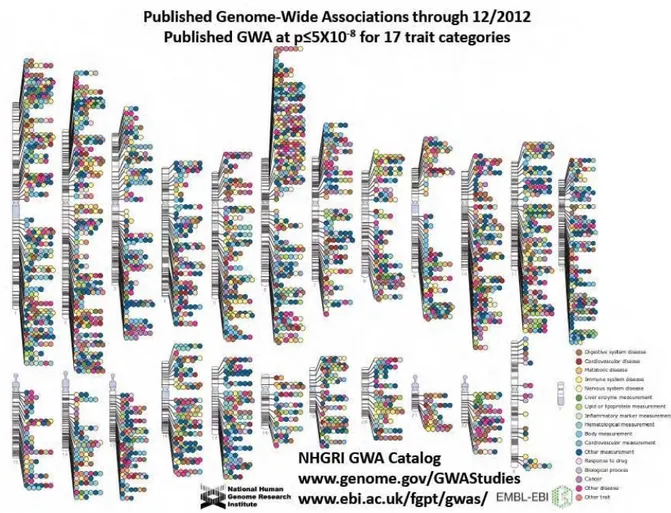
INDIVIDUALS INCLUDING THREE SNPS.(B)HAPLOTYPES FORMED BY NEARBY SNPS INCLUDING THE THREE SNPS FROM PANEL (A).(C)THE THREE SNPS WHICH UNIQUELY IDENTIFY THE FOUR HAPLOTYPES.ADAPTED FROM (INTERNATIONAL HAPMAP CONSORTIUM,2003). ... 33 FIGURE 2.9:PUBLISHED GENOME-WIDE ASSOCIATIONS AT STRINGENT SIGNIFICANCE CRITERIA AS OF DECEMBER
2012.ADAPTED FROM WWW.GENOMES.GOV.LAST ACCESSED AUGUST 2013. ... 37 FIGURE 3.1:DIRECT (A) AND INDIRECT (B) ASSOCIATION STUDIES.IN DIRECT ASSOCIATION STUDIES, ONLY ONE
SNP, THE CAUSAL (IN RED), IS ANALYZED.IN INDIRECT ASSOCIATION STUDIES, SEVERAL SNPS (IN RED) THAT ARE CORRELATED WITH THE CAUSAL SNP(IN BLUE) ARE ANALYZED.ADAPTED FROM (HIRSCHHORN AND
DALY,2005). ... 57 FIGURE 3.2:EFFECT SIZE (OR) PLOTTED AGAINST RISK ALLELE FREQUENCY.ADAPTED FROM (MANOLIO,2013). 58 FIGURE 3.3:REQUIRED NUMBER OF CASES AND CONTROLS TO ACHIEVE 80% POWER AT P-VALUE <10-6TO DETECT
ASSOCIATIONS FOR GIVEN ALLELIC FREQUENCIES AND EFFECT SIZES (OR, SHOWN NEAR EACH
CORRESPONDING CURVE).PERFECT LINKAGE DISEQUILIBRIUM BETWEEN THE TEST MARKERS AND THE DISEASE VARIANTS AND THE MULTIPLICATIVE GENETIC MODEL IS ASSUMED.ADAPTED FROM (WANG ET AL., 2005)... 60 FIGURE 3.4:FOREST PLOT OF THE STRATIFIED ANALYSES BY COHORT EVALUATING THE ASSOCIATION BETWEEN
THE OAS1 SNP RS2660 AND RESPONSE TO INTERFERON-Β. ... 65 FIGURE 3.5:ASSOCIATION TEST RESULTS UNDER THE DOMINANT GENETIC MODEL FROM THE ITGA4 CANDIDATE
GENE STUDY ON RESPONSE TO NATALIZUMAB.RESULTS ARE EXPRESSED AS THE NEGATIVE LOGARITHM OF THE P-VALUE OF THE ASSOCIATION TEST FOR ALL 60SNPS TESTED.THE MOST SIGNIFICANT FINDING IS
FIGURE 3.6:LD PLOT (BASED ON ,EQUATION (2.6)) FOR THE ITGA4 GENE.THE SNP RS155106 FROM THE CANDIDATE GENE STUDY (CIRCLED IN BLUE) AND TWO SNPS FROM THE PRELIMINARY STUDY CONDUCTED BY (COUTURIER,2010) (CIRCLED IN RED) ARE NOTED.GRAPH GENERATED WITH HAPLOVIEW (BARRETT ET AL., 2005)... 74 FIGURE 3.7:ABSOLUTE VALUE OF SNP EFFECT ESTIMATES OBTAINED BY MODEL II(TOP) AND MODEL III
(BOTTOM) PLOTTED AGAINST THE SNP POSITION.THE RED DASHED LINE ON THE GRAPH OF MODEL III CORRESPONDS TO THE MAXIMUM ABSOLUTE SNP EFFECT ESTIMATE UNDER MODEL II. ... 80 FIGURE 3.8:SCHEMA OF THE STUDY DESIGN FOR THE GAW18 DATA. ... 85 FIGURE 3.9:PERCENTAGE OF REPLICATES (OUT OF REPLICATES 2 THROUGH 200) WITH SIGNIFICANT EVIDENCE OF
ASSOCIATION OF PS WITH DBP AT A GIVEN NOMINAL P-VALUE BY SNP SET DERIVED USING EITHER SINGLE-MARKER OR BLUP STRATEGIES IN REPLICATE 1. ... 87 FIGURE 3.10:RATIO OF EMPIRICAL TYPE IERROR RATES OF SINGLE-MARKER TO BLUP FOR PERMUTED DBP
(LEFT) AND FOR THE RANDOM SNP SET (RIGHT).A DASH “-” IN THE TABLE ABOVE THE RIGHT GRAPH INDICATES THAT THE REPLICATION RATE UNDER BLUP WAS ZERO. ... 94 FIGURE 4.1:HYPOTHETICAL ROC CURVES.ADAPTED FROM (ZOU ET AL.,2007). ... 107 FIGURE 4.2:A SIMPLE DATASET GENERATED WITH ONE DEPENDENT VARIABLE ( ) AND ONE INDEPENDENT
VARIABLE ( ) FOR SUBJECTS. ... 110 FIGURE 4.3:THE FITTED MODEL (RED LINE) TO THE DATASET IN FIGURE 4.2.THE BLUE LINES ILLUSTRATE THE
DIFFERENCE BETWEEN THE SIMULATED AND THE PREDICTED VALUES. ... 111 FIGURE 4.4:RANDOM SPLIT OF THE DATASET IN FIGURE 4.2 INTO TRAINING (RED POINTS) AND TESTING (BLUE)
POINTS.THE MODEL IS FITTED (RED LINE) ON THE TRAINING DATASETS AND ITS LOSS FUNCTION EVALUATED IN THE TESTING DATASET. ... 112 FIGURE 4.5:THE -FOLD CROSS VALIDATION ILLUSTRATED ON THE DATASET IN FIGURE 4.2.THAT IS, IN EACH
ITERATION, THE MODEL IS TRAINED ON OBSERVATIONS (RED) AND TESTED ON OBSERVATIONS (BLUE).THIS PROCESS IS REPEATED UNTIL ALL OBSERVATIONS IN THE DATASET HAVE BEEN USED FOR TESTING.HERE, . ... 113 FIGURE 4.6:LEAVE-ONE-OUT CROSS VALIDATION ILLUSTRATED ON THE DATASET IN FIGURE 4.2.IN EACH
ITERATION, THE MODEL IS TRAINED ON OBSERVATIONS (RED) AND TESTED ON ONE OBSERVATION (BLUE).THIS PROCESS IS REPEATED UNTIL ALL OBSERVATIONS IN THE DATASET HAVE BEEN USED FOR TESTING. ... 114 FIGURE 4.7:REPEATED K-FOLD CROSS VALIDATION ILLUSTRATED ON THE DATASET IN FIGURE 4.2.THE -FOLD
CROSS VALIDATION ILLUSTRATED IN FIGURE 4.5 IS REPEATED THREE TIMES ( ). ... 115 FIGURE 4.8:SNAPSHOT OF THE FREE WEBSITE CREATED TO HELP PHYSICIANS AND HEALTH PROFESSIONALS
ASSESS THE WARFARIN DOSE TO ADMINISTER TO PATIENTS BASED ON THE PREDICTIVE MODELS THAT HAVE BEEN BUILT FOR THAT PURPOSE.ADAPTED FROM (THE WARFARIN DOSE REFINEMENT COLLABORATION AND
INTERNATIONAL WARFARIN PHARMACOGENETICS CONSORTIUM,2013)... 116 FIGURE 4.9:SNAPSHOT OF THE FREE WEBSITE CREATED FOR ANYONE WISHING TO ASSESS THEIR 10-YEAR RISK OF
HEART ATTACK.ADAPTED FROM (NATIONAL HEART LUNG AND BLOOD INSTITUTE,2013). ... 117
FIGURE 4.10:THE EXPLAINED VARIATION, , AS A FUNCTION OF DISCOVERY SAMPLE SIZE, , FOR DIFFERENT PROPORTIONS OF TOTAL VARIANCE EXPLAINED BY THE GENOTYPED SNPS, .ADAPTED FROM (WRAY ET AL.,2013). ... 121 FIGURE 4.11:MAXIMUM ACHIEVABLE AUC AS A FUNCTION OF SAMPLE SIZE (NUMBER OF CASES AND CONTROLS)
FOR CROHN’S DISEASE (RARE, HIGHLY HERITABLE) AND FOR BREAST CANCER (COMMON, MODESTLY
HERITABLE).ADAPTED FROM FIGURE 4 IN (DUDBRIDGE,2013). ... 124
FIGURE 4.12:CORRESPONDENCE BETWEEN THE ACCURACY CURVES AND THE ORS FOR BINARY MARKERS WITH ORS AS INDICATED ON THE VARIOUS CURVES.ADAPTED FROM (PEPE ET AL.,2004). ... 125 FIGURE 4.13:ROC CURVES FOR THE LR AND THE BT APPROACHES FOR A RANDOMLY CHOSEN REPETITION. .... 131 FIGURE 4.14:THE MEAN EXPLAINED VARIATION, (A), AND MSE(B) AVERAGED OVER REPLICATES 2 THROUGH
TABLE 1.1:LIST OF PHARMACOGENOMIC STUDIES CARRIED OUT TO DATE. ... 17 TABLE 2.1:TABLE OF ALLELE AND HAPLOTYPE FREQUENCIES FOR TWO BI-ALLELIC SNPS,SNP1 AND SNP2. ... 26
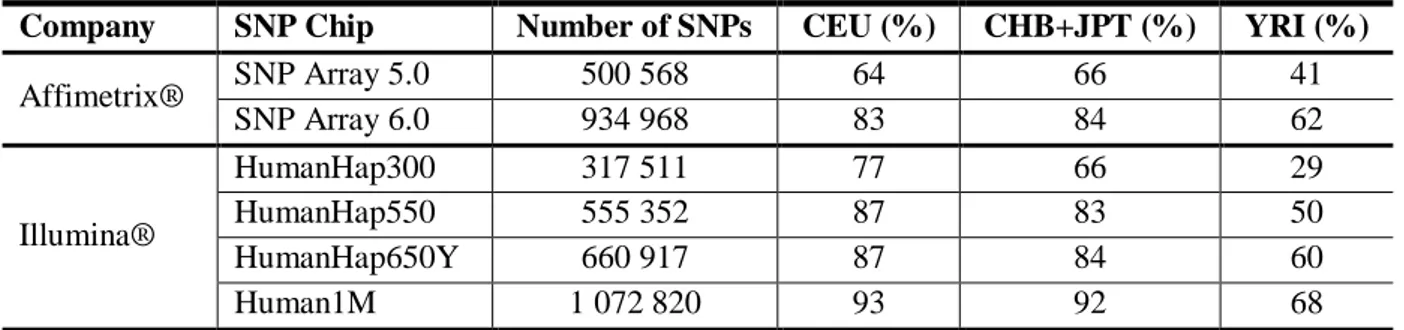
TABLE 2.2:GLOBAL COVERAGE OF THE GENOME FOR SEVERAL COMMERCIAL SNP CHIPS FOR THE CEU
(EUROPEAN),CHB+JPT(ASIAN) AND YRI(AFRICAN)HAPMAP POPULATIONS.ADAPTED FROM (LI ET AL., 2008)... 34 TABLE 2.3:PUNNET SQUARE GIVING THE PROBABILITIES OF AN OFFSPRING HAVING A PARTICULAR GENOTYPE AT A BI-ALLELIC LOCUS IN A POPULATION IN HARDY-WEINBERG EQUILIBRIUM. ... 35 TABLE 2.4:OBSERVED AND EXPECTED (UNDER HWE) GENOTYPE COUNTS AT A SINGLE BI-ALLELIC LOCUS IN A
POPULATION OF SIZE ... 35 TABLE 3.1:THE CONTINGENCY TABLE OF DISEASE STATUS BY GENOTYPE COUNTS FOR A SINGLE BI-ALLELIC SNP
WITH ALLELES A AND A AND FOR INDIVIDUALS. ... 45 TABLE 3.2:THE CONTINGENCY TABLE OF DISEASE STATUS BY ALLELE COUNTS FOR A SINGLE BI-ALLELIC SNP
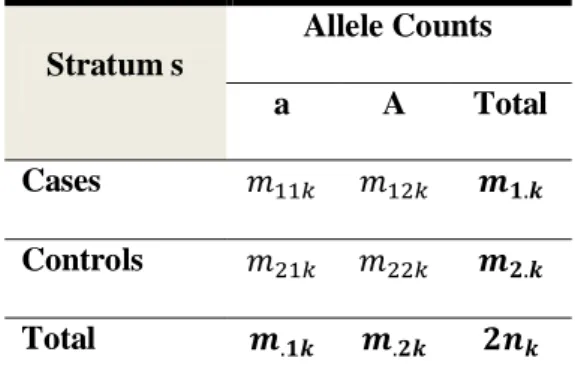
WITH ALLELES A AND A AND FOR INDIVIDUALS WITH THE ALLELIC COUNTS RELATED TO THE GENOTYPE COUNTS IN TABLE 3.1 AS FOLLOWS: AND FOR . ... 46 TABLE 3.3:ALLELIC CONTINGENCY TABLE PER STRATUM WITH INDIVIDUALS IN EACH
STRATUM. ... 47 TABLE 3.4:CONTINGENCY TABLES ARISING UNDER THE DOMINANT (A) AND RECESSIVE (B) MODELS DERIVED
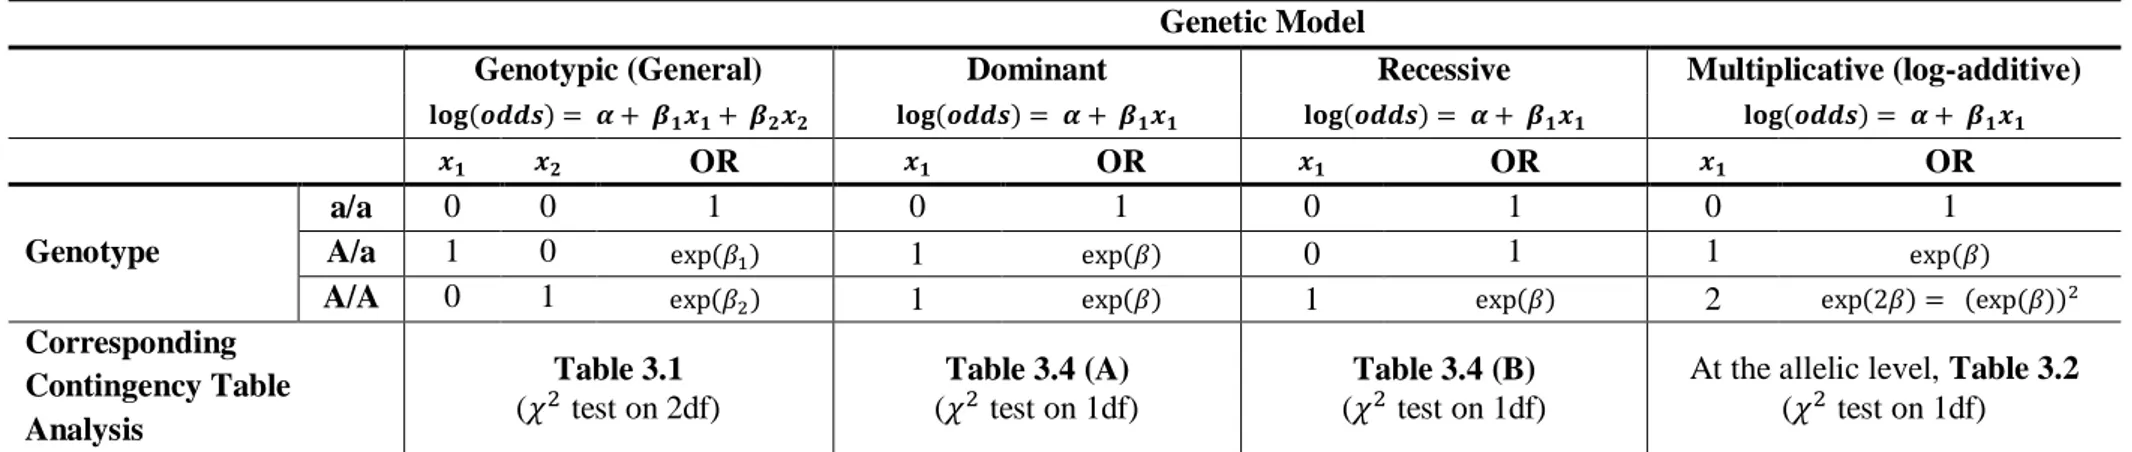
BASED ON THE GENOTYPE COUNTS IN TABLE 3.1. ... 50 TABLE 3.5:PARAMETERIZATION OF GENETIC MODELS IN A LOGISTIC REGRESSION FRAMEWORK AND THE
CORRESPONDING CONTINGENCY TABLE ANALYSES DESCRIBED IN THE TEXT... 53 TABLE 3.6:GENOTYPE FREQUENCIES IN CASES AND CONTROLS DERIVED FROM THE GENOTYPE COUNTS IN TABLE
3.1. ... 55 TABLE 3.7:ALLELE AND GENOTYPE FREQUENCIES BY RESPONSE STATUS AND COHORT FOR THE MS PATIENTS
INCLUDED IN THE STUDY.THE P-VALUE FOR THE HWE EXACT TEST IS GIVEN AS WELL. ... 64 TABLE 3.8:CMH AND BD TEST RESULTS AFTER EXCLUDING ONE COHORT AT A TIME. ... 65 TABLE 3.9:ASSOCIATION RESULTS FOR LOGISTIC REGRESSION ANALYSIS INCLUDING COHORT AS A COVARIATE
AND MODELING DIFFERENT GENETIC MODELS.STATISTICALLY SIGNIFICANT RESULTS FROM THE LRT (UNCORRECTED P-VALUE <0.05) ARE HIGHLIGHTED IN RED.AIC:AKAIKE INFORMATION CRITERION;R: RESPONDERS;NR:NON-RESPONDERS. ... 66 TABLE 3.10:ASSOCIATION RESULTS FOR LOGISTIC REGRESSION ANALYSIS IN FEMALE (A) AND MALE PATIENTS (B)
INCLUDING COHORT AS A COVARIATE AND MODELING DIFFERENT GENETIC MODELS.STATISTICALLY SIGNIFICANT RESULTS FROM THE LRT(UNCORRECTED P-VALUE <0.05) ARE HIGHLIGHTED IN RED.AIC: AKAIKE INFORMATION CRITERION;R:RESPONDERS;NR:NON-RESPONDERS. ... 67 TABLE 3.11:THE ESTIMATED SNP EFFECT AND ITS SIGNIFICANCE AFTER ADJUSTING FOR VARIOUS COVARIATES. 69 TABLE 3.12:ALTERNATIVE RESPONSE DEFINITIONS AND HOW THEY COMPARE TO THE DEFINITION WE ADOPTED
FOR THIS STUDY. ... 70 TABLE 3.13:RESPONSE CLASSIFICATION FOR NATALIZUMAB-TREATED PATIENTS. ... 72 TABLE 3.14:COMPARING THE PARAMETERIZATION OF BAYES A,B,C AND D MODELS. ... 77 TABLE 3.15:MULTI-MARKER MODELS WE EVALUATED ON THE PDGWAS DATASET. ... 78 TABLE 3.16:THE SNP EFFECT ESTIMATE AND THE CORRESPONDING SNP RANK WITHIN KNOWN PD GENES (±
1MB) FOR THE THREE MULTI-MARKER MODELS,MODELS I,II,III AND GWAS. ... 79 TABLE 3.17:EMPIRICAL TYPE IERROR RATES AND 95% CONFIDENCE INTERVALS (CI) UNDER THREE SCENARIOS:
(1) WITH TRAIT Q1 UNINFLUENCED BY ANY OF THE SNPS,(2) WITH PERMUTED DBP WITHIN FAMILY THUS BREAKING THE ASSOCIATION BETWEEN THE SNPS AND DBP, AND (3) WITH DBP USING A RANDOMLY CHOSEN SETS OF TOP SNPS (THE SAME SETS WERE USED FOR BOTH SINGLE-MARKER AND BLUP).RATES WERE ESTIMATED BASED ON 199 REPLICATES.DUE TO THE SMALL NUMBER OF REPLICATES, ONLY ESTIMATES AT NOMINAL P-VALUE =5% ARE GIVEN.CASES WHERE THE EMPIRICAL ESTIMATE SIGNIFICANTLY EXCEEDS THE NOMINAL VALUE ARE UNDERLINED. ... 89
000 TIMES IN 100 REPLICATES (N=100 000).CASES WHERE THE EMPIRICAL ESTIMATE SIGNIFICANTLY EXCEEDS THE NOMINAL VALUE ARE UNDERLINED. ... 90 TABLE 3.19:EMPIRICAL TYPE IERROR RATES AND 95% CONFIDENCE INTERVALS (CI) FOR SCENARIO (3) OF
TABLE 3.17 FOR STRICTER SIGNIFICANCE THRESHOLDS.CASES WHERE THE EMPIRICAL ESTIMATE
SIGNIFICANTLY EXCEEDS THE NOMINAL VALUE ARE UNDERLINED.IF THE CONFIDENCE LIMIT EXCEEDED 0 OR 1, THE INTERVAL WAS TRUNCATED (DENOTED BY “[” OR “]”). ... 91 TABLE 4.1:TWO-BY-TWO TABLE OF PREDICTED VERSUS OBSERVED DISEASE STATUS.TP: TRUE POSITIVE COUNT,
FP: FALSE POSITIVE COUNT,FN: FALSE NEGATIVE COUNT,TN: TRUE NEGATIVE COUNT. ... 105 TABLE 4.2:SUMMARY OF SEVERAL PERFORMANCE MEASURES FOR A BINARY OUTCOME. ... 106 TABLE 4.3:MAXIMUM ACHIEVABLE AUC(IN ITALIC) FOR TWO DISEASES, CORONARY ARTERY DISEASE (CAD)
AND CROHN’S DISEASE, WITH SIMILAR HERITABILITY BUT WITH VERY DIFFERENT PREVALENCE.THE MAXIMUM ACHIEVABLE AUC IS GIVEN UNDER THE CURRENT DISCOVERY SAMPLE SIZES AND FOR MARKER PANELS EXPLAINING HALF ( ) OR FULL ( ) HERITABILITY.IN PARENTHESIS, THE AUC ACHIEVABLE WITH INFINITE DISCOVERY SAMPLE SIZES, THAT IS, WHEN , IS GIVEN.VALUES ADAPTED FROM TABLE 2 IN (DUDBRIDGE,2013). ... 122 TABLE 4.4:MAXIMUM ACHIEVABLE AUC(IN ITALIC) FOR TWO DISEASES, SCHIZOPHRENIA AND PROSTATE
CANCER, WITH SIMILAR PREVALENCE BUT WITH VERY DIFFERENT HERITABILITY.THE MAXIMUM ACHIEVABLE AUC IS GIVEN FOR THE CURRENT DISCOVERY SAMPLE SIZES AND FOR MARKER PANELS EXPLAINING HALF ( ) OR FULL ( ) HERITABILITY.IN PARENTHESIS, THE AUC
ACHIEVABLE WITH INFINITE DISCOVERY SAMPLE SIZES, THAT IS, WHEN , IS GIVEN.VALUES ADAPTED FROM TABLE 3 IN (DUDBRIDGE,2013). ... 123 TABLE 4.5:THE NUMBER AND PROPORTION (OUT OF 531 PATIENTS) OF MISSING VALUES PER PREDICTOR VARIABLE IN OUR STUDY DATASET. ... 129 TABLE 4.6:SENSITIVITY, SPECIFICITY,PPV,NPV AND OVERALL ACCURACY FOR THE LOGISTIC REGRESSION (LR)
AND THE BINARY TREES WITH RECURSIVE PARTITIONING (BR) MODELS AVERAGED OVER 1000 REPETITIONS OF TWO-FOLD CROSS VALIDATION RUNS. ... 130 TABLE 4.7:PREDICTORS RANKED BY THE PERCENTAGE OF TIMES OVER THE 1000 REPETITIONS THAT THEY WERE
SELECTED WHEN USING THE LOGISTIC REGRESSION WITH BACKWARD SELECTION (LR) OR THE BINARY TREE WITH RECURSIVE PARTITIONING MODEL (BT). ... 132 TABLE 4.8:SUMMARY OF MEAN AND VALUES FOR DBP UNDER THE SINGLE-MARKER AND BLUP
APPROACHES WHEN TAKING ONLY TOP TWO INDEPENDENT SNPS FROM THE MAP4 GENE, AND UNDER BLUP WHEN TAKING ALL SNPS.N/A:NOT APPLICABLE. ... 136 TABLE I.1:GENE SYMBOLS AND CORRESPONDING NAMES.(SOURCE: HTTP://WWW.NCBI.NLM.NIH.GOV/GENE/) . 159 TABLE II.1:CLINICAL CHARACTERISTICS OF THE FRENCH COHORT IN THE OAS1 STUDY. ... 161 TABLE II.2:CLINICAL CHARACTERISTICS OF THE GERMAN COHORT IN THE OAS1 STUDY. ... 162 TABLE II.3:CLINICAL CHARACTERISTICS OF THE ITALIAN COHORT IN THE OAS1 STUDY. ... 163 TABLE II.4:CLINICAL CHARACTERISTICS OF THE SPANISH COHORT IN THE OAS1 STUDY. ... 164 TABLE II.5:CLINICAL CHARACTERISTICS OF THE FRANCE/NON-FRANCE COHORTS IN THE OAS1 STUDY. ... 165 TABLE III.1:CLINICAL CHARACTERISTICS OF A SUBSET OF PATIENTS FROM THE BIONAT COHORT (DATABASE
VERSION NOVEMBER 2013) INCLUDED IN THE PREDICTION STUDY ON NATALIZUMAB RESPONSE (SECTION 4.3.1.2). ... 167 TABLE III.2:BIOLOGICAL CHARACTERISTICS OF A SUBSET OF PATIENTS FROM THE BIONAT COHORT (DATABASE
VERSION NOVEMBER 2013) INCLUDED IN THE PREDICTION STUDY ON NATALIZUMAB RESPONSE (SECTION 4.3.1.2). ... 168 TABLE III.3:RADIOLOGICAL CHARACTERISTICS OF A SUBSET OF PATIENTS FROM THE BIONAT COHORT
(DATABASE VERSION NOVEMBER 2013) INCLUDED IN THE PREDICTION STUDY ON NATALIZUMAB RESPONSE (SECTION 4.3.1.2)... 169
1 INTRODUCTION
1.1 The Genetic Material
“We wish to suggest a structure for the salt of deoxyribose nucleic acid (D.N.A.). This structure has
novel features which are of considerable biological interest.” (Watson and Crick, 1953) Such is the
opening of the 1953 monumental paper by James Watson and Francis Crick postulating on the structure of the molecule of life carrying our genetic information, the DNA.
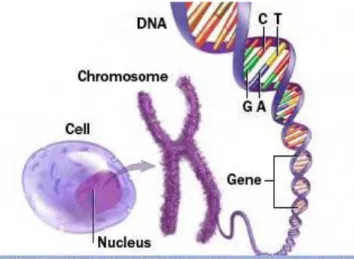
The human body is composed of trillions of cells which store our genetic information. In particular, the nucleus of each cell contains two copies of 23 different chromosomes with one copy inherited from each of our parents. Of the 23 chromosomes, one is a sex chromosome (X or Y) determining the gender of an individual where females carry two copies of the X chromosome (XX) and males carry a copy of each (XY). The chromosomes comprise long strings of double-stranded DNA, made up of four nucleotide bases, namely, Cytosine (C), Adenine (A), Guanine (G), and Thymine (T). The two strands of the DNA are connected through hydrogen bonds between complementary base pairs where A always pairs with T and C always pairs with G. This is illustrated in Figure 1.1 below.
Figure 1.1: How genetic information is stored in our bodies. Adapted from (Mayo Clinic staff, 2011).
The human genome consists of roughly 3 billion DNA base pairs. A specific sequence
of these bases forms genes. It was long believed that genes coded for a single protein but this
simplified assumption has been refuted. Specifically, the same gene can code for more than
one protein or for none at all (directly transcribe to ribonucleic acid, or RNA, a
single-stranded molecule similar to the DNA with the nucleotide base Thymine (T) replaced by
Uracil(U)). It is complicated to come up with a precise definition of a gene and as such the
estimated number of genes in the human genome vary based on the definition used (Pennisi,
2003). The most recent estimate lies somewhere around 20 500 genes. (Clamp et al., 2007)
The regions of the DNA between genes are referred to as intergenic regions. The DNA
comprises roughly 75% of intergenic regions. Of the remaining 25% of the DNA spanned by
genes, only 1% are exons (coding for RNA or protein) while the remaining 24% are introns
(non-coding sequences) (Venter et al., 2001).
Individuals share more than 99% of their DNA sequence. The remaining 1% or so of our genetic variation influences disease susceptibility and other complex traits and has proven important in the study of human health. Most of the genetic variation occurs in intergenic regions but some occur in
genes and may thus directly impact their function. Nevertheless, even if the variations lie in intergenic regions, they may still be implicated in the susceptibility to diseases and in the phenotypic variation of other complex traits.
1.2 Biomarkers
The term biomarker is short for biological marker. In 1998, the National Institutes of Health Biomarkers Definitions Working Group defined a biomarker as “a characteristic that is objectively
measured and evaluated as an indicator of normal biological processes, pathogenic processes, or pharmacologic responses to a therapeutic intervention”. (Biomarkers Definitions Working Group, 2001) There are many different applications of biomarkers leading to three major categories of
biomarkers: diagnostic, prognostic and predictive. A diagnostic biomarker is a diagnostic tool for the identification of a disease. A prognostic biomarker is an indicator for disease prognosis. Lastly, a predictive biomarker predicts response to an intervention or treatment.
The United States Food and Drug Administration (US FDA) industry guidelines, proposed in 2008, narrow down the definition of a genomic biomarker as a “measurable DNA and/or RNA
characteristic that is an indicator of normal biologic processes, pathogenic processes, and/or response to therapeutic or other interventions.” (FDA, 2008) DNA characteristics include but are not
limited to variations in a single DNA base (a Single Nucleotide Polymorphism or SNP) and other more complex forms of genetic variations discussed by (Frazer et al., 2009). Alternatively, RNA characteristics can refer to RNA sequences, microRNA levels and others. Thus, a genomic biomarker may simply consist of a single SNP or of a more complex combination of several DNA and/or RNA characteristics.
1.3 Pharmacogenetics and Pharmacogenomics
The terms pharmacogenetics and pharmacogenomics are often used interchangeably. The US FDA proposed industry guidelines in 2008 define pharmacogenomics as “the study of variations of DNA
and RNA characteristics as related to drug response” and pharmacogenetics, as a subset of
pharmacogenomics, and define it as “the study of variations in DNA sequence as related to drug
response.” (FDA, 2008) Thus, pharmacogenetic studies, by definition, do not involve the study of
variation in RNA characteristics. More recently, the terms are distinguished based on the scope of the study. A pharmacogenetic study focuses on variations related to drug response in a targeted gene. On the other hand, a pharmacogenomic study investigates the variations related to drug response across multiple genes or even at the genome-wide level (Ritchie, 2012).
Such studies may be conducted at all stages of the drug development process from drug discovery to clinical practice. Further, drug response is a broad term encompassing drug disposition (that is, absorption, distribution, metabolism, and excretion, known by the acronym ADME) and drug effects (that is, efficacy and adverse effects).
Presently, the US FDA website (FDA, 2013) lists roughly 120 drugs with pharmacogenomic information in their labels. For instance, the label of the drug carbamazepine (Tegretol®, Novartis), one of the most widely used and effective treatments of epilepsy, recommends against the treatment of patients carrying a specific variant in the human leukocyte antigen (HLA) region. This variant, found almost exclusively in patients of Asian ancestry, has been associated with serious side effects in these populations. (Novartis, 2007) Alternatively, the gene CYP2C19 is implicated in the metabolism of many drugs. The translation of CYP2C19 pharmacogenetics into clinical practice, however, is currently limited to a small number of functional variants although more than 2000 variants have already been discovered. (Lee, 2012)
1.4 Study Designs
Pharmacogenomic studies do not differ significantly from traditional epidemiological studies but important considerations specific to pharmacogenomic studies exist. Major epidemiological study designs are summarized in Figure 1.2 below.
Two main types exist, experimental and observational. In the former, the investigators aim to control for all main forms of bias. In the latter, the information is passively observed and collected by the investigator. The most common example of an experimental study design is a randomized controlled trial (RCT) where subjects are randomly assigned to one of several treatment groups. This type of study design most closely resembles a controlled experimental setting and typically leads to the most rigorous scientific results.
Figure 1.2: Epidemiological study designs. Adapted from (London School of Hygiene and Tropical Medicine, 2013).
However, oftentimes such studies are infeasible due to cost or ethical issues, so a large portion of the epidemiologic research is conducted using observational study designs the most common types being the case-control or cohort studies. In case-control studies, as their name suggests, subjects are classified into cases and controls and their risk exposure history is compared. In cohort studies, subjects are followed up examining multiple health effects of exposure. Other less common types of observational study designs include cross-sectional study designs where the relationship between exposure and disease is examined at a single point in time and ecological study designs where this
relationship is compared at group rather than individual level. Cohort studies are typically prospective where the information is yet to be collected to answer a specific research question in mind, while case-control studies are typically retrospective where the information has already been collected not necessarily with the specific research question in mind.
The main study designs among those described above used in pharmacogenomic studies are RCT and case-control studies. However, given the high-dimensional data context of genetic studies atypical to traditional epidemiological studies, a third important study design that has been emerging in the field of pharmacogenomics is a type of prospective observational study design where DNA biobanks are linked to electronic health records. Such a study design, for instance, has been successfully applied for determining the appropriate dose of warfarin (an anticoagulant) to administer to patients. (Ramirez et al., 2012) Pharmacogenomic studies have been carried out for a wide variety of diseases. The focus of this thesis is on Multiple Sclerosis.
1.5 Multiple Sclerosis
Multiple Sclerosis (MS) was first characterized in 1868 by a French neurologist, Jean-Martin Charcot. (Charcot, 1868) MS is a chronic inflammatory disease of the central nervous system (CNS). Healthy nerve fibers, or axons, are surrounded with a protective covering, the myelin sheath. Myelin is a material that is primarily comprised of protein and fat and is essential for the proper functioning of the nervous system. When a loss of myelin occurs, referred to as demyelination, the functions of the implicated nerve fiber are jeopardized. Often times, the damage to myelin is reversible.
In MS, the body’s own immune system attacks the nervous system resulting in inflammation causing demyelination in many areas leaving scars (sclerosis). This may eventually result in deterioration to the nerves themselves which, however, is not reversible. Depending on the amount of damage and the nerves that are affected, the range of symptoms experienced by individuals varies from mild (sensory troubles) to severe (handicap).
MS affects two to three times more females than males and this trend is observed for other autoimmune diseases such as rheumatoid arthritis (RA). It is not clear what causes this gender difference. Most patients are diagnosed between the ages of 20 and 40 years with the peak disease onset occurring around the age of 30. MS is also diagnosed in children (younger than 18 years) and in seniors (more than 65 years).
The diagnosis of MS is very difficult and misdiagnosis can be quite common. In 2001, an international panel of neurologists derived diagnostic criteria for MS (McDonald et al., 2001). These criteria were later revised in 2005 and again in 2010 (Polman et al., 2011; Polman et al., 2005) but, unfortunately, they remain imperfect.
The criteria are primarily based, but not limited to, the clinical presentation of at least one attack. An, attack, also referred to as flair, relapse, or exacerbation, is defined as “patient-reported or
objectively observed events typical of an acute inflammatory demyelinating event in the CNS, current or historical, with duration of at least 24 hours, in the absence of fever or infection.” (Polman et al., 2011) Additional data needed for MS diagnosis include radiological measures such as the presence of
magnetic resonance imaging (MRI) T2 and/or gadolinium-enhancing (GD+) lesions in MS-typical regions of the CNS.
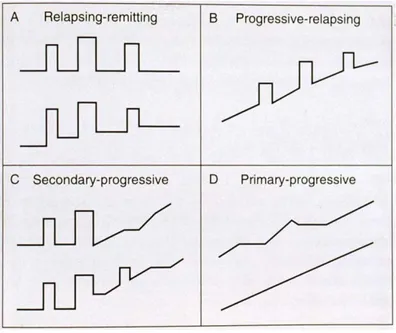
The clinical course of MS is highly heterogeneous. Many forms of the disease have been described but they can generally be grouped into four distinct types characterized by the disease progression. Figure 1.3 below illustrates these types: relapsing-remitting MS (RRMS, panel (A)), progressive-relapsing MS (PRMS, panel (B)), secondary-progressive MS (SPMS, panel (C)) and primarprogressive MS (PPMS, panel (D)). Each figure represents disability progression on the y-axis versus time on the x-y-axis; each peak corresponds to an attack.
Figure 1.3: MS disease progression may be grouped into four major categories: relapsing-remitting MS (A), progressive-relapsing MS (B), secondary-progressive MS (C) and primary-progressive MS
(D). Adapted from (MS Society of Western Australia, 2013).
The most common type of MS is RRMS with roughly 85% of MS patients suffering from it. Patients alternate between periods of attacks (relapses) followed by periods of partial or full recovery (remission). As the disease progresses, the partial recovery accumulates into disability eventually leading to the SPMS form where the worsening of the disease course continues. About 10% of MS patients have the PPMS where, contrary to the SPMS form, there is a steady progression of disability right from disease onset without periods of full recovery. Finally, in the rare type of disease progression affecting roughly 5% of the patients, PRMS, patients experience recurring relapses (attacks) and steady worsening of symptoms. (Goldenberg, 2012) It is also possible, however, that for some patients the disease would not progress.
To date, the cause of MS remains unknown but a number of environmental risk factors have been linked to MS. These include infectious factors such as Epstein-Barr virus infection and non-infectious factors such as vitamin D deficiency (Ascherio and Munger, 2007a, b). None, however, provide a definite explanation and, in fact, the list of plausible causes continues to grow such as a
recent study using experimental animal models suggesting that high salt intake may, too, be linked to risk of MS. (Kleinewietfeld et al., 2013)
The work by Kurtzke (2000) illustrated that there are also geographic clues to the cause of MS. Figure 1.4 shows the prevalence of MS around the world. The prevalence is highest in the USA, Canada and Northern Europe (more than 100 per 100 000), followed by Australia, New Zealand, Southern Europe, Russia and Latin America (between 5 and 100 per 100 000) and is rather low in Asia and Africa (less than 5 per 100 000). Variability within country exists as well. The prevalence in France ranges from 60 to 100 per 100 000 with higher prevalence in the north-eastern regions and lower in the Paris region and the south-western regions. (Fromont et al., 2010; Vukusic et al., 2007).
Figure 1.4: World atlas of MS prevalence. Adapted from (World Health Organization, 2008).
1.6 Multiple Sclerosis Genetics
The prevalence among Native Indians in Canada as well as other ethnic communities across the world is lower than the corresponding national prevalence. This suggests that genetic risk factors also appear
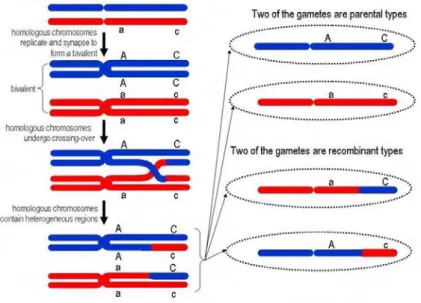
to contribute to the risk of MS (Rosati, 2001). Moreover, familial studies have indicated that MS tends to aggregate in families and the risk tends to decrease with decreasing degree of relatedness. For instance, one study in a Northern European population (with MS prevalence > 0.1%, see Figure 1.4) estimated the age-adjusted lifetime risk at 38% for monozygotic (identical) twins and at 3-5% for dizygotic (fraternal) twins and first degree relatives such as a sibling or a child. Conversely, the risk for non-biological relatives such as adopted siblings was the same as the risk in the general population (that is, the prevalence) estimated at 0.2% in their study. (Sadovnick et al., 1999)
Familial recurrence risk is often measured by the sibling recurrence-risk ratio, denoted , which is the ratio of risk in siblings of affected individuals to the risk in the general population. In the study by Sadovnick et al. (1999) mentioned above, ( ), that is, 3%/0.2% to 5%/0.2%. Overall, estimates of in MS vary across studies and have tended to decline over time (Sawcer et al.,
2010) with some studies suggesting that (Hemminki et al., 2009).
Twin studies, aiming to evaluate the relative contribution of genetic and environmental risk factors, have also produced highly variable estimates of the genetic contribution to MS susceptibility ranging from 25% to 76%. (Hawkes and Macgregor, 2009) Therefore, while there is supporting evidence for a genetic component of the disease, the fine balance between the contributing genetic and environmental factors to the risk of MS is still unclear.
Prior to the era of large scale genetic association studies (genome-wide association study, GWAS), the only recognized genetic association contributing to the risk of MS was mapped to the HLA region. The first GWAS of MS in 2007 in 931 family trios (discovery dataset) and 609 family trios as well as 2322 cases/789 controls (replication dataset) confirmed this association and identified two other genes, IL2RA and IL7RA at strict genome-wide significance criteria levels (< 10-7). (Hafler
et al., 2007) In the four years that followed, six independent GWASs were conducted identifying over
20 different loci outside the HLA region (most of them at genome-wide significance). ((Comabella et
al., 2008); (Baranzini et al., 2009); (Australia and New Zealand Multiple Sclerosis Genetics Consortium (ANZgene), 2009); (Jakkula et al., 2010); (Sanna et al., 2010); (Nischwitz et al., 2010)) In
2011, the International Multiple Sclerosis Genetics Consortium in collaboration with the Wellcome Trust Case Control Consortium 2 completed the largest MS GWAS to date (roughly 9800 cases and 17400 controls) replicating almost all of the previously identified associations and further identifying 29 novel ones. (Sawcer et al., 2011) In 2012, another much smaller MS GWAS (296 cases and 801 controls) was conducted replicating previously reported associations (Matesanz et al., 2012). Many of the genetic association findings were close to immunologically relevant genes thus providing basis to the belief that MS is an immunological disorder. Despite all the discovered variants, however, a large portion of the heritability of MS risk remains unexplained. In a dataset of roughly 2 000 MS cases and 5 000 controls with close to 500 000 SNPs, Watson et al. (2012) found that approximately 30% of MS heritability was explained by the variants on current genome-wide SNP arrays, which includes the SNPs in the HLA region that alone account for 8%.
1.7 Multiple Sclerosis Therapies
There is no cure for MS but currently there are eight approved disease modifying therapies on the market. In France, the escalation approach to treatment of MS, illustrated in Figure 1.5, is used whereby therapies with increasing effectiveness but also more severe side effects are sequentially used.
Figure 1.5: Escalation approach to MS treatment.
The first-line therapies include treatments based on interferon-β (Avonex®, Biogen Idec; Betaseron®, Bayer; Rebif®, Pfizer; Extavia®, Novartis) and glatiramer acetate (Copaxone®, Teva). Second-line therapies include natalizumab (Tysabri®, Biogen Idec), finglomod (Gilenya®; Novartis) and mitoxantrone (Novantrone®, EMD Serono). Interferon-β is the first ever therapy approved for MS dating back to the mid-90s. Fingolimod is the first oral treatment in MS and is the most recent drug approved by the European Medicines Agency.
First line therapies cause relatively mild side effects but are also less effective. Approximately half of the patients fail to respond to interferon therapy. On the other hand, second-line therapies, as more aggressive treatments, have shown to be more effective in modifying the disease course for patients but can also lead to serious and sometimes fatal side effects. Natalizumab is arguably the most effective treatment of all but unfortunately it has been linked with potentially fatal brain infection known as progressive multifocal leukoencephalopathy (PML). In fact, during less than a decade of its existence, this treatment has undergone an exceptional course, being withdrawn months after being approved only to be put back on the market under unprecedented surveillance program (Steinman,
The available variety of disease modifying therapies and the heterogeneous course of the disease progression pose challenges in determining the optimal treatment strategy for a MS patient. A number of treatment algorithms for MS have been proposed and have been reviewed by Rio (2011). The importance of treating MS as early in the disease onset as possible has long been recognized but the poor efficacy of the available drugs seems to be related to the fact that only the early stages of the disease are targeted (Lopez-Diego and Weiner, 2008). Effectively, treatments of MS may be considered for treating its clinical manifestations, managing its symptoms or preventing its progression. (Fox et al., 2006)
There are currently at least seven medications in late phases of drug development primarily targeting the most common form of the disease, RRMS. (Ali et al., 2013) By 2020 the number of approved MS therapies is expected to rise significantly making the decision for the best course of treatment ever more challenging (Huynh, 2010). The increasing number of available therapies coupled with the potential risk of treatment failure and/or severe adverse reactions makes individualized therapy a necessity for MS. (Río et al., 2009)
1.8 Response Definition to Multiple Sclerosis Therapies
There is not a widely accepted definition of response to treatment in MS. The most common approach adopted in pharmacogenomic studies of MS has been to dichotomize the group of patients into Responders/Non-Responders by evaluating their response to treatment at a specific time point (for instance, one year after treatment onset) using a set of clinical and/or radiological variables.
The criteria of grouping patients has widely differed across studies but typically a patient is classified as a Responder if all criteria are met and those patients not classified as Responders are classified as Responders (at least one criterion is not met). Sometimes, however, the Non-Responder group is as strictly defined (none of the criteria is met) as the Non-Responder group (extreme phenotypes) leaving perhaps many patients classified as Intermediary (Suboptimal) Responders.
The number of relapses (see Section 1.5) experienced by the patient over the treatment period is commonly used to evaluate response. Another widely used clinical measure to evaluate treatment response in MS is the disability progression based on the change of the Expanded Disability Status Scale (EDSS) developed by Kurtzke (1983). It is a rating scale from 0.0 (normal neurological exam) to 10.0 (death due to MS). Starting from 1.0, it goes in increments of 0.5. Despite its popularity, this measure is complicated to use and understand. While large discrepancies are unlikely, two physicians evaluating the same patient may assign different EDSS values.
For the relapsing forms of MS, response has often been assessed over the treatment period by combining these two measures (relapses and EDSS) as illustrated in Figure 1.6 below. Sometimes one or both of these measures has been combined with radiological measures such as the presence/absence of MRI lesions to derive the response definition.
Figure 1.6: Assessing treatment response in relapsing forms of MS based on EDSS progression and number of relapses experienced over the evaluation period.
While the response classifications are usually based on the same clinical and/or radiological measures, response criteria across studies differ for the following reasons: (1) whether both clinical and radiological or only clinical measures are used to classify the patients; (2) for the same measure the threshold used to distinguish a Responder from a Non-Responder; (3) the duration of the period
over which the response is evaluated (six months, one year, two years, etc.). Moreover, even if the response classification is the same across studies, the evaluation of the measures on which it is based is physician-dependent and thus subjective.
Alternatively, the response variable could be constructed as a composite score of the several variables used to classify the patients into Responders and Non-Responders. The challenges in deriving such definition of response are (1) how to build a composite score using variables measured on completely different scales (for example, EDSS versus MRI lesion load); (2) how to determine the weight that each of these variables carry in the score; and (3) the distribution of such a composite score is yet to be evaluated and its properties are yet to be established.
For the second challenge, an added complexity to defining response of MS lies in the fact that the variables used to evaluate response vary by importance with the disease duration. For instance, in the beginning of the disease, radiological measures might be the best tool to evaluate disease activity as there may be no clinical manifestations of the disease. On the other hand, as time progresses, the role of the radiological measures reduces and the disease begins to manifest clinically. (Fox and
Cohen, 2001) Thus, time-dependent weights may need to be assigned to reflect the increasing or
diminishing role of each measure in determining response to treatment in MS.
Yet another approach to defining response may rely on the principles of survival analysis. In this case, one can model the time to progression of the disease during treatment by defining progression based on one or several criteria (clinical and/or radiological). This approach is commonly used in randomized clinical trials, for example, modeling time to first relapse after treatment onset.
Thus, response to MS therapies is a highly complex outcome to evaluate. As a contrasting example, to determine the warfarin dose, physicians use the international normalized ratio (INR), which is a standardized test result evaluating the clotting tendency of blood. It is an objective measure based on blood tests and is, therefore, directly comparable nationally and internationally.
It is plausible that genetic factors play a role in determining response to MS therapies. Moreover, if such is the case, it is likely that multiple genes are involved. (Río et al., 2009) Therefore,
pharmacogenomic studies, investigating genes implicated in drug response, have the potential to identify key genetic biomarkers and facilitate the application of individualized therapy in MS.
1.9 Pharmacogenomic Studies of Multiple Sclerosis To Date
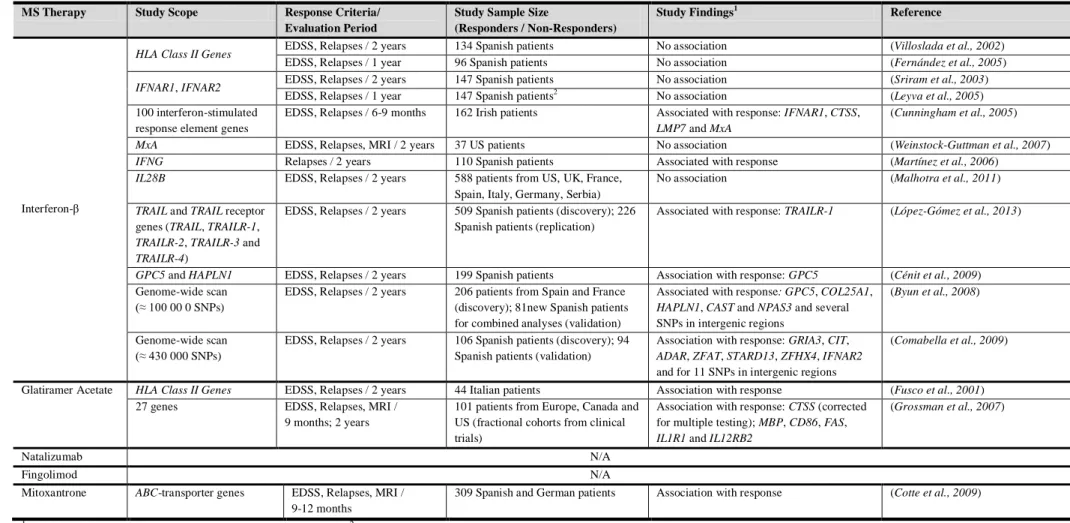
A handful of pharmacogenomic studies of MS have been carried out to date predominantly on interferon response (summarized in Table 1.1). Most of these studies have investigated the role of specific genes with only two studies (on interferon response) conducting genome-wide scans. Gene names are given in greater detail in Appendix I.
MS Therapy Study Scope Response Criteria/ Evaluation Period
Study Sample Size
(Responders / Non-Responders)
Study Findings1 Reference
Interferon-β
HLA Class II Genes EDSS, Relapses / 2 years 134 Spanish patients No association (Villoslada et al., 2002)
EDSS, Relapses / 1 year 96 Spanish patients No association (Fernández et al., 2005)
IFNAR1, IFNAR2 EDSS, Relapses / 2 years 147 Spanish patients No association (Sriram et al., 2003)
EDSS, Relapses / 1 year 147 Spanish patients2 No association (Leyva et al., 2005) 100 interferon-stimulated
response element genes
EDSS, Relapses / 6-9 months 162 Irish patients Associated with response: IFNAR1, CTSS,
LMP7 and MxA
(Cunningham et al., 2005)
MxA EDSS, Relapses, MRI / 2 years 37 US patients No association (Weinstock-Guttman et al., 2007)
IFNG Relapses / 2 years 110 Spanish patients Associated with response (Martínez et al., 2006)
IL28B EDSS, Relapses / 2 years 588 patients from US, UK, France, Spain, Italy, Germany, Serbia)
No association (Malhotra et al., 2011)
TRAIL and TRAIL receptor
genes (TRAIL, TRAILR-1,
TRAILR-2, TRAILR-3 and TRAILR-4)
EDSS, Relapses / 2 years 509 Spanish patients (discovery); 226 Spanish patients (replication)
Associated with response: TRAILR-1 (López-Gómez et al., 2013)
GPC5 and HAPLN1 EDSS, Relapses / 2 years 199 Spanish patients Association with response: GPC5 (Cénit et al., 2009) Genome-wide scan
(≈ 100 00 0 SNPs)
EDSS, Relapses / 2 years 206 patients from Spain and France (discovery); 81new Spanish patients for combined analyses (validation)
Associated with response: GPC5, COL25A1,
HAPLN1, CAST and NPAS3 and several
SNPs in intergenic regions
(Byun et al., 2008)
Genome-wide scan (≈ 430 000 SNPs)
EDSS, Relapses / 2 years 106 Spanish patients (discovery); 94 Spanish patients (validation)
Association with response: GRIA3, CIT,
ADAR, ZFAT, STARD13, ZFHX4, IFNAR2
and for 11 SNPs in intergenic regions
(Comabella et al., 2009)
Glatiramer Acetate HLA Class II Genes EDSS, Relapses / 2 years 44 Italian patients Association with response (Fusco et al., 2001) 27 genes EDSS, Relapses, MRI /
9 months; 2 years
101 patients from Europe, Canada and US (fractional cohorts from clinical trials)
Association with response: CTSS (corrected for multiple testing); MBP, CD86, FAS,
IL1R1 and IL12RB2
(Grossman et al., 2007)
Natalizumab N/A
Fingolimod N/A
Mitoxantrone ABC-transporter genes EDSS, Relapses, MRI / 9-12 months
309 Spanish and German patients Association with response (Cotte et al., 2009)
1
Reported association findings at α=0.05 significance level. 2 Different from the study by (Sriram et al., 2003)