Sensitivity Analysis of a Local Market Model for
Community Microgrids
Laurine Duchesne, Bertrand Corn´elusse
Department of EE & CS Montefiore Institute University of Li`ege Li`ege, Belgium {l.duchesne, bertrand.cornelusse}@uliege.beIacopo Savelli
Dipartimento di Ingegneria dell’Informazione e Scienze MatematicheUniversit`a di Siena Siena, Italy [email protected]
Abstract—A community microgrid is a microgrid composed of several entities, or members, that can share energy among themselves. The members of the community can match their demand and supply through an internal local market with a significant reduction of the exchanges with the main grid. As a consequence each participant can benefit from a reduction of its energy costs when the energy available locally is cheaper than the energy from the grid, from a drop of the energy peak demanded from the main grid, and from the new capability to provide energy reserve at aggregate level. In this paper, we analyze how the changes of the community market model parameters can affect both the community as a whole, and the welfare of each participant. The analysis is performed by varying the main drivers of the community market model, the community and storage fees, and the storage capacity. The numerical results are obtained by using real data based on the MeryGrid project.
Index Terms—community market, community microgrid, en-ergy market, marginal pricing, sharing economy.
I. INTRODUCTION
The increasing share of renewable energy sources and storage systems in distribution grids opens the possibility for new market models that favor a local usage of the generated electricity. Local energy communities, and more specifically community microgrids, constitute one of these options. A microgrid is a set of loads, generators and storage devices connected by an electric grid within a clearly defined neigh-borhood, able to work either connected or disconnected from the main grid. It becomes a community microgrid when several legal entities constitute the microgrid, e.g. a set of small and medium-sized enterprises.
In the literature, microgrids have been explored under differ-ent aspects, however references related to community market models are limited. Reference [1] shows how to model and price co-generated energy within a local heat district, managed by a monopolistic public utility. Reference [2] proposes a microgrid model with internal exchanges formalized as a Nash bargaining problem, where the community prices are restricted to predetermined, discrete price levels. Reference [3] describes a community model where the participating units act in a collaborative manner. The optimal solution is obtained through a distributed algorithm by exploiting the alternating direction method of multipliers. Reference [4] presents a blockchain-based microgrid blockchain-based on a pilot project built in Brooklyn,
where blockchains appear to be an eligible technology to manage local microgrids. Reference [5] reviews and analyzes the most important market architectures for community micro-grid, including decentralized peer-to-peer structures with direct trades among participants, and local community of aggregated units either connected to the main grid or islanded. Reference [6] proposes a peer-to-peer microgrid model where the internal community prices are determined heuristically depending on the ratio between the energy supplied and demanded within the community. Reference [7] describes a novel market model for community microgrids that is formalized as a bilevel problem. By using the proposed architecture, the community partici-pants can allocate efficiently their resources with a significant reduction of the energy costs. Furthermore, the entities can pool their resources to provide ancillary services to the main grid. Moreover, by exploiting the netting effects at aggregate level, they can reduce the energy imported from the main grid, with a considerable drop in the energy peak costs. By using predetermined profit and cost sharing policies, a community operator ensures no participating entity is penalized.
The aim of this paper is to perform an in-depth sensitivity analysis, by measuring the effects of changing the main param-eters of the community microgrid market model introduced in [7], in order to assess the soundness, reliability, and robustness of the proposed market architecture. In particular, we focus on the change of welfare for
• the community and community members, • the storage owners,
• the community operator.
The analysis is performed by varying the following parame-ters:
• the fee collected by the storage owner,
• the fee collected by the community operator to manage the community,
• the amount of storage capacity available.
The remaining part of this paper is organized as follows. Section II briefly summarizes the model proposed in [7]. Section III describes the analysis performed and reports the numerical results. Finally, Section IV outlines the main con-clusions.
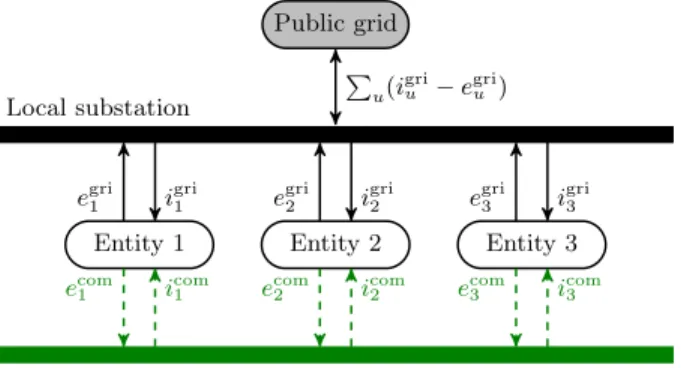
Public grid Entity 2 Entity 3 Entity 1 Local substation Community P u(i gri u − egriu ) egri1 i gri 1 e gri 2 i gri 2 e gri 3 i gri 3 ecom
1 icom1 ecom2 icom2 ecom3 icom3
Fig. 1. Schematic community model. The flow ecom
i (resp. icomi ) represents the export (resp. import) of entity i to the community. Flows tagged by ”gri” denote traditional exchanges with the public grid.
II. MODELSUMMARY
This section briefly summarizes the market model for com-munity microgrid described in [7]. The proposed architecture considers the entities forming the community, and a commu-nity operator that manages the commucommu-nity in the best interest of the participants. Collectively, the entities decide both the quantity to trade among themselves within the community, and the quantity to trade outside of the community directly with the main grid. This is illustrated in Fig. 1.
The market clearing at community level is performed by matching the demand and supply orders of each entity through a social welfare maximization problem. As a result, a market equilibrium is determined, where the executed quantity and the market prices are identified. By using the community, the entities can achieve a more efficient allocation of the resources, and therefore a reduction of the energy costs. Furthermore, as a group, the entities are able to provide energy reserve to the main grid and are able to effectively reduce the community en-ergy peak, due to the import/export netting effect at aggregate level. Notice however that both the reserve provision and the community peak reduction are results of a collective effort. Therefore, some policy rules, and an independent operator (the community operator) are needed in order to determine how these benefits should be shared among the participating entities. Thus, given the market clearing results, a community operator must apply predetermined sharing policies in order to split the collective revenues and costs among each participant. An operator fee is considered to remunerate the activity of the community operator1. Similarly, storage device owners collect
a battery fee each time their devices are used.
A bilevel model has been implemented in order to model this architecture. A bilevel model consists of two nested optimization problems, termed upper and lower level problems
1Note that it is assumed that the community operator has a contract with the DSO, since the community exploits the public grid for the physical flows. Therefore, the operator fee is used not only to remunerate the operator but also the DSO.
u
x∗
Lower Level • Objective
Max Social Welfare • Purpose
Market Clearing Upper Level
• Objective
Max Social Welfare • Purpose
Enforce Reserve Sharing Policy Enforce Peak Sharing Policy Ensure Pareto Condition
Fig. 2. The bilevel model structure. The lower level problem determines both the market equilibrium within the community, and the exchanges with the main grid. The upper level problem represents the community operator.
[8]. This structure can be sketched as follows: max
u∈UF (u, x
∗) (1)
s.t. x∗∈ arg max
x∈X f (x; u) , (2)
where F is the objective function of the upper level, and f is the objective function of the lower level. In the proposed community microgrid model with internal market, the lower level part clears the community market by determining the executed quantities and the market prices, whereas the upper level acts as an independent community operator that applies the sharing policies, and ensures that no entity is penalized by participating in the community. The latter requirement is termed Pareto superior condition, and it is a fundamental condition in order to ensure a participation on a voluntary basis. Monetary compensations within the community are allowed. The overall process is sketched in Fig. 2.
A key feature of the proposed model is that the lower level problem is a linear program. By exploiting this characteristic, the lower level can be directly represented within the upper level by using its first order Karush-Kuhn-Tucker conditions, obtaining a single optimization problem equivalent to the initial bilevel model.
III. SENSITIVITYANALYSIS
In this section, we perform a sensitivity analysis of the proposed bilevel model on the following parameters: the com-munity operator fee, the storage owner fee, and the capacity of the storage system. The purpose is two-fold: first to assess how different values of the parameters can affect the community and each participant; second to find a good value for each of these parameters.
We conduct this study on a realistic test case inspired by the MeryGrid project [9]. The MeryGrid project is a community microgrid composed of four entities. The first entity is a pure consumer. Entities 2 and 3 are both consumers and producers,
TABLE I
MEAN(µ),STANDARD DEVIATION(σ),AND MAXIMUM VALUES OF THE CONSUMPTION AND RENEWABLE GENERATION OF EACH ENTITY AND THE
COMMUNITY RESPECTIVELY INJANUARY AND INAUGUST,IN KW. January August
Entity Type µ σ Max µ σ Max
1 Load 27 30 237 23 29 164 2 Load 39 22 91 7 10 47 2 PV gen. 0 1 26 5 11 67 3 Load 21 37 183 17 36 193 3 Hydro gen. 45 37 116 54 51 183 Total Load 87 61 417 47 58 320 Generation 45 37 123 59 54 224
with respectively 70kWp of PV and 200kVA of hydro-electric capacity. The last entity, entity 4, is a battery storage system with a capacity of 270kWh. We use as demand and supply orders for the model the consumption and renewable genera-tion of the four entities that were measured every 15 minutes during the year 2017. We focus on two months, January and August, chosen to evaluate the impact of some parameters with different weather conditions. Table I summarizes the consumption and generation data for these two months. On average, the consumption is larger in January than in August, but it is the contrary for the generation.
We consider as fixed the parameters depending on the contract with the main grid: the peak cost and the prices at which each entity can buy from and sell to the grid. Their values are respectively 0.15 e per kW, 0.15 e per kWh and 0.035e per kWh. Concerning the battery storage system, we assume that the charging and discharging efficiencies are both equal to 0.95. Furthermore, the initial and final state of charge of the battery is equal to half its capacity. One instance of the problem lasts one day with time steps of 15 minutes. We do not consider reserves in our test case.
A. Impact of the community operator fee
The operator fee γcom is collected by the community operator each time an entity buys from or sells to another entity in the community. In this study, the value of γcomvaries
from 0.005 to 0.10 e/kWh with steps of 0.005. All the other parameters stay constant, in particular the storage owner fee is equal to 0.04e/kWh.
Fig. 3 shows the total fees collected by the community operator during January 2017 as a function of the operator fee per kWh. The operator revenue increases almost linearly and reaches the maximum with a tariff of 0.055e/kWh. With a larger γcom, no fee is collected, meaning that there are no
exchanges within the community. This analysis shows that from the community operator’s point of view, the operator fee should be 0.055e/kWh to maximize his revenue.
To check if the value of 0.055 e/kWh is meaningful, note that it is interesting for an entity to sell to the community
0.02 0.04 0.06 0.08 0.10
Operator fee per kWh ( /kWh) 0
500 1000 1500 2000
Total operator fees (
)
Fig. 3. Total fees paid to the operator during January 2017 as a function of γcom.
0.02 0.04 0.06 0.08 0.10
Operator fee per kWh ( /kWh) 0 500 1000 1500 2000 2500
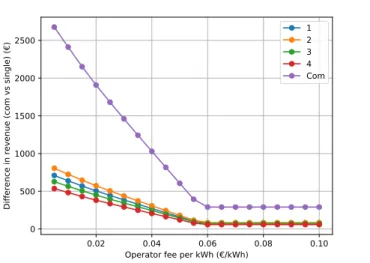
Difference in revenue (com vs single) (
) 12
3 4 Com
Fig. 4. Difference in revenue for being in the community compared to being a single entity during January 2017 as a function of γcom.
instead of the grid only if the community market price is equal to or larger than the grid purchase price. Thus, the minimum selling price to the community for an entity is 0.035 e/kWh. In that case, the buying entity has to pay this price and remunerate the community operator. The selling entity must also remunerate the community operator. However, in the proposed framework, the selling entity charges this cost to the buying entity. Therefore, the latter pays a minimum of 0.035 + 2 × γcom e/kWh. If this quantity is greater than 0.15 e/kWh (the grid selling price), that is if γcom is greater than 0.05825 e/kWh, no entity is willing to buy from the community, and therefore the selling entity sells to the grid. This explains the zero revenue for the community operator for γcom ≥ 0.06 e/kWh. Even though there is no exchange between entities, Fig. 4 shows that it is still profitable for each entity to stay in the community, since
0.00 0.05 0.10 0.15 0.20 0.25 0.30 Storage fee per KWh ( /kWh)
0 50 100 150 200 250
Total storage fees (
)
storage capacity: 270kWh
Fig. 5. Total storage fees during January 2017 as a function of γstofor a storage capacity of 270kWh.
joining the community decreases the peak penalty for the members. In particular, each entity improves its condition, and the Pareto condition is thus met. However, adopting a peak penalty scheme at the community level will likely force the distribution system operator (DSO) to increase the peak penalty tariff, which should incentivize community members to decrease and desynchronize their peak consumptions. B. Impact of the storage fee
A storage fee per kWh γsto is collected by the battery
owner each time the battery is charged or discharged. In this work γsto varies from 0 to 0.32 e/kWh with steps of 0.02.
Furthermore, the community operator fee is equal to 0.01 e/kWh.
Fig. 5 shows how the total fees collected by the storage owner in January evolves with the storage fee per kWh. A first interesting observation is that it reaches the maximum value with γsto = 0.04e/kWh. It is therefore a good choice
for the battery owner to pick this value as storage fee, for the nominal capacity of the storage system.
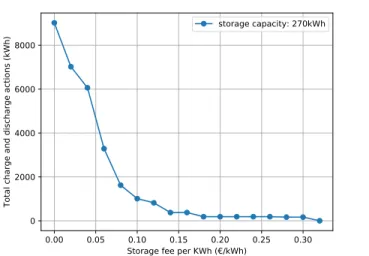
After reaching the maximum, the fees collected by the storage owner do not decrease monotonically. We can explain this by looking at the use of the battery (the sum of charge and discharge actions). Fig. 6 shows that it decreases exponentially as a function of the storage fee per kWh. Therefore, for large values of γsto, the decrease in the use of the battery does not compensate the increase of γsto, explaining why the total storage fees collected by the storage owner increase with γsto.
We notice that the storage system is not exploited anymore if γsto ≥ 0.32 e/kWh. In fact, it is shown in [7, (39)] that the community market price π4,t+ncom for entity 4 at discharging
time t + n, is defined as π4,t+ncom = π com 4,t ηchaηdis+ 2γsto ηdis , (3) 0.00 0.05 0.10 0.15 0.20 0.25 0.30 Storage fee per KWh ( /kWh)
0 2000 4000 6000 8000
Total charge and discharge actions (kWh)
storage capacity: 270kWh
Fig. 6. Total charge and discharge actions during January 2017 as a function of γstofor a storage capacity of 270kWh.
where ηcha and ηdis are the charging and discharging
effi-ciencies of the battery, and πcom
4,t is the market price paid by
entity 4 at time t to charge the battery. This market price is such that it compensates for the price paid by the battery owner to charge the battery, and for the losses due to the charging and discharging efficiencies. It also considers the storage fee. Notice that, the maximum market price an entity d is willing to pay, in order to buy electricity within the community, is capped by the price paid to buy directly from the grid. In this setting, this value is equal to 0.75e/kWh2, and it is given by the following relation [7]
πigrd +πpeak ∆T
= 0.75e/kWh (4)
with the grid selling price πdigr= 0.15e/kWh, the peak price πpeak = 0.15 e/kW and ∆T = 0.25 hours. It is therefore
necessary for the market price of entity 4 at discharging time, i.e. πcom
4,t+n in (3), to be smaller than 0.75 e/kWh to
be attractive. Assuming a charging price πcom
4,t equal to its
minimum value, 0.035e/kWh, this condition is fulfilled only if γsto< 0.3378, which explains the values observed in both
Fig. 5 and Fig. 6.
C. Impact of the storage fee and the capacity of the storage system
We now study simultaneously the impact of the storage fee per kWh and the capacity of the storage system. For this analysis, the storage fee per kWh varies as in Section III-B and the storage capacity varies from 0 to 540 kWh with steps of 30kWh.
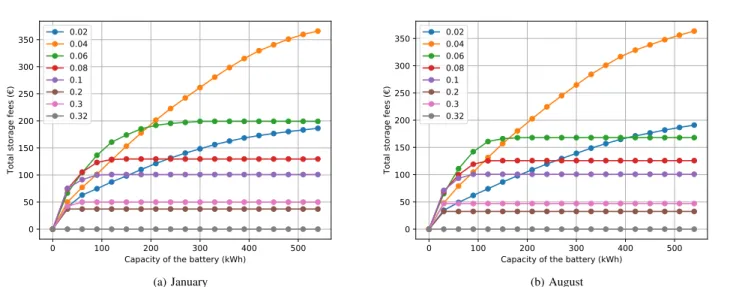
Fig. 7 shows the total fees collected by the battery owner in January and in August as a function of the capacity of the battery, for different values of γsto. The capacity of the battery
2Note that this situation occurs only when all entities need to import from the grid and therefore the battery is used to reduce the maximum peak value by spreading the import over several time steps.
0 100 200 300 400 500 Capacity of the battery (kWh)
0 50 100 150 200 250 300 350
Total storage fees (
) 0.02 0.04 0.06 0.08 0.1 0.2 0.3 0.32 (a) January 0 100 200 300 400 500
Capacity of the battery (kWh) 0 50 100 150 200 250 300 350
Total storage fees (
) 0.02 0.04 0.06 0.08 0.1 0.2 0.3 0.32 (b) August
Fig. 7. Total storage fees as a function of the storage capacity for various γsto, respectively in January and in August.
0 100 200 300 400 500
Capacity of the battery (kWh) 0 500 1000 1500 2000 2500
Difference in revenue (com vs single)
1 2 3 4 Com (a) January 0 100 200 300 400 500
Capacity of the battery (kWh) 0 500 1000 1500 2000 2500
Difference in revenue (com vs single)
1 2 3 4 Com (b) August
Fig. 8. Difference in revenue for being in the community compared to being a single entity as a function of the storage capacity for γsto= 0.04e/kWh, respectively in January and in August.
maximizing the owner revenue is very sensitive to the value γsto. For a large γsto, the current capacity of the community
(270kWh) is too large. This graph corroborates the observation made in the previous subsection: with γsto= 0.32, the battery
is not used, independently of its capacity.
For both January and August, despite the difference in consumption and generation profiles, the value of 0.04 for the storage fee per kWh leads to the maximum revenue for the storage owner, if the storage capacity is large enough. Otherwise, there is a clear dependency between the capacity of the storage unit and the γsto maximizing the owner fees.
Fig. 8 show the difference in revenue for being in the community compared to being a single entity as a function of the storage capacity, for γsto = 0.04 e/kWh. The difference is positive for all entities, due to the Pareto condition. The
difference in revenue for being in the community increases similarly for all entities when the capacity increases.
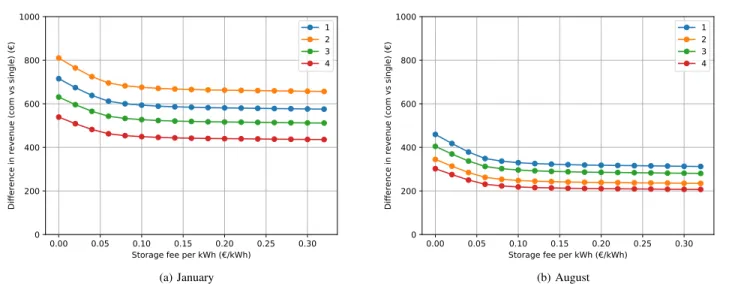
The opposite behavior can be observed in Fig. 9 which also shows the difference in revenue for being in the community, but this time as a function of γsto.
In both figures, we notice a clear difference between January and August. It seems that it is more interesting to be in the community in January, when the consumption is higher than the production in average.
We see that the entities that make the most of the community are entity 2 in January and entity 1 in August. They are the largest consumers in average for the given month and they seem to exploit well the production surplus of the other entities.
0.00 0.05 0.10 0.15 0.20 0.25 0.30 Storage fee per kWh ( /kWh)
0 200 400 600 800 1000
Difference in revenue (com vs single) (
) 12
3 4
(a) January
0.00 0.05 0.10 0.15 0.20 0.25 0.30 Storage fee per kWh ( /kWh)
0 200 400 600 800 1000
Difference in revenue (com vs single) (
) 12
3 4
(b) August
Fig. 9. Difference in revenue for being in the community compared to being a single entity as a function of γsto, and for the nominal storage capacity (270kWh), respectively in January and in August.
IV. CONCLUSION
Community microgrids represent an emerging topic in en-ergy systems. These new architectures allow participants to exchange energy and resources among themselves, and to share the resulting benefits.
By using a novel community microgrid market model, the proposed sensitivity analysis helps to shed light on how different parameter settings can affect revenues, costs and welfare of both the participants and the community as a whole. Although this does not constitute a proof, the expected behavior of the system is verified by experiment.
The fee collected by the community operator on each trade has a significant impact on the community. In particular, the operator fee can be increased up to the point where no exchange is worthwhile within the community. Notice that, the community can be regarded as an hedging tool, where entities can trade among themselves as long as the internal community prices are more favorable than the grid prices.
The storage device has a considerable impact on the welfare of the community, however this effect becomes less evident as the storage capacity increases.
The reported sensitivity analysis shows that the community microgrid market model proposed in [7] is a viable framework for structuring the internal market of a community microgrid, provided that appropriate values of the main parameters are selected. There is however not one set of such values that can be regarded as overall optimal, as the different stakeholders are guided by different objectives. This highlights the needs for other criteria to select a good set of values overall. These criteria could include fairness notions.
Ongoing work aims at extending this evaluation to different community configurations, and to community of communities.
ACKNOWLEDGMENT
Bertrand Corn´elusse thanks Nethys for its support. REFERENCES
[1] M. Bohman and R. Andersson, “Pricing cogenerated electricity and heat in local communities,” Journal of Public Economics, vol. 33, no. 3, pp. 333–356, 1987.
[2] D. Zhang, N. J. Samsatli, A. D. Hawkes, D. J. L. Brett, N. Shah, and L. G. Papageorgiou, “Fair electricity transfer price and unit capacity selection for microgrids,” Energy Economics, vol. 36, pp. 581–593, 2013. [3] F. Moret and P. Pinson, “Energy collectives: a community and fairness
based approach to future electricity markets,” IEEE Transactions on Power Systems, pp. 1–1, 2018.
[4] E. Mengelkamp, J. Grttner, K. Rock, S. Kessler, L. Orsini, and C. Weinhardt, “Designing microgrid energy markets: A case study: The brooklyn microgrid,” Applied Energy, vol. 210, pp. 870 – 880, 2018. [Online]. Available: http://www.sciencedirect.com/science/article/pii/S030626191730805X [5] Y. Parag and B. K. Sovacool, “Electricity market design for the prosumer
era,” Nature Energy, vol. 1, no. 4, p. 16032, 2016.
[6] N. Liu, X. Yu, C. Wang, C. Li, L. Ma, and J. Lei, “Energy-sharing model with price-based demand response for microgrids of peer-to-peer prosumers,” IEEE Transactions on Power Systems, vol. 32, no. 5, pp. 3569–3583, Sept 2017.
[7] B. Corn´elusse, I. Savelli, S. Paoletti, A. Giannitrapani, and A. Vicino, “A community microgrid architecture with an internal local market,” arXiv preprint arXiv:1810.09803, 2018.
[8] J. Bard, Practical bilevel optimization: applications and algorithms. Kluwer Academic Press Dordrecht, Netherlands, 1998.
[9] B. Corn´elusse, D. Ernst, L. Warichet, and W. Legros, “Efficient manage-ment of a connected microgrid in belgium,” in Proceedings of the 24th International Conference on Electricity Distribution, Glasgow, 12-15 June 2017, 2017.