Impact à long terme du travail du sol sur le cycle
biogéochimique du phosphore: Analyse de l’essai
L’Acadie (Qué bec, Canada) et modé lisation
Thè se en cotutelle
Doctorat en sols et environnement
Haixiao Li
Université Laval
Qué bec, Canada
Philosophiae Doctor (Ph. D.)
et
Universié de Bordeaux
Talence, France
Philosophiae Doctor (Ph. D.)
© Haixiao Li, 2017
Impact à long terme du travail du sol sur le cycle
biogéochimique du phosphore: Analyse de l’essai
L’Acadie (Qué bec, Canada) et modé lisation
Thè se en cotutelle
Doctorat en sols et environnement
Haixiao Li
Sous la direction de :
Lé on-Etienne Parent, directeur de recherche
Christian Morel, directeur de cotutelle
Noura Ziadi, codirectrice de recherche
III
Résumé :
La pratique du «semis direct» ou no-till (NT) se développe rapidement comme méthode de conservation des sols. Cette pratique modifie nombre de propriétés du sol comme, par exemple, la répartition du phosphore (P) dans le profil du sol. L’objectif de cette thèse est d’analyser les impacts après plusieurs décennies sous la gestion de NT sur le cycle biogéochimique du P et d’intégrer ces effets dans un modèle de fonctionnement. Nous avons utilisé un essai au champ de longue durée sous maïs-soja (L’Acadie, Québec, Canada) implanté sur un sol argilo-limoneux. Le dispositif était un split-plot à 4 blocs avec le labour conventionnel ou « mouldboard plough » (MP) et sans labour (NT) en parcelles prioncipales et 3 doses de fertilisation en P minéral [0 (0P), 17.5 (0.5P), 35 (1P) kg P ha-1] apportées sur le maïs et localisées à 5 cm de profondeur et à 5 cm du rang de maïs, en sous-parcelles.
La concentration en ions phosphates dans le sol (Cp) était relativement uniforme dans la couche labourée (0-20 cm) (0.08 mg P L-1), puis baissait légèrement dans la couche 20-30 cm (0.05 mg P L-1) et davantage au-delà (0.01 mg P L-1). Sous les traitements [NT, 0.5P] et [NT, 1P] traitements, le Cp était plus élevé dans la couche 0-10 cm (0.28 et 0.19 mg P L-1) que dans la couche labourée mais baissait rapidement avec la profondeur. Cette stratification verticale sous NT était également observée pour les teneurs en P-Olsen, P-M3 et autres nutriments comme C, N et K. Après 23 et 24 années d’essai, il y avait tendanciellement moins de racines du maïs sous NT (-14%) que sous MP, probablement à cause de la présence plus importante d’adventices sous NT. Pour le soja, il y avait beaucoup plus de racines dans la couche 0-10 cm sous NT (44% de longueur total) que sous MP (21%) et inversement dans la couche 10-20 cm. Ces différences de distribution des racines sous NT et MP correspondaient à la stratification de N, P, et K.
Ce jeu de données sur la distribution des racines et du phosphore a été utilisé pour i) évaluer un modèle 1D décrivant la dynamique du P dans la couche labourée du sol sur plusieurs décennies, ii) proposer un mode d’estimation de la distribution du prélèvement dans le profil de sol, et iii) développer un modèle spatialisé 2D décrivant la dynamique du P pour le traitement sans labour. Ce modèle permet de simuler l’évolution de la disponibilité en P du sol sur le long terme quelque soient les modes de préparation du sol et le régime de fertilisation P. Même si le modèle surestime parfois la disponibilité en P à proximité de la zone fertilisée, il permet de prédire la stratification du P du sol en NT et ses conséquences sur le prélèvement de P en relation avec les propriétés du sol et le développement du système racinaire. Il contribue à améliorer le raisonnement de la fertilisation phosphatée dans le contexte du sans-labour.
Mots clés : labour, sans-labour, semis direct, agriculture de conservation, fertilisation
IV
Abstract:
The no-till (NT) is gaining great attention for soil preparation. This practice modifies number of soil properties such as the distribution of phosphorus (P) in the soil profile. This work aims to analyze the impacts on the biogeochemical P cycle after decades of NT and to incorporate those effects in an operational model. We used a long-term field experiment under corn-soybean rotation established on a clay loam soil (L’Acadie, Quebec, Canada). The design was a split-plot plan with 4 blocks under moldboard plough (MP) and NT as main split-plots, subdivided by 3 doses of P [0 (0P), 17.5 (0.5P), 35 (1P) kg P ha-1] applied in corn phase and localized to 5-cm
deep and 5-cm from the corn row, as sub-plots.
The phosphate ion concentration under MP was relatively constant (0.08 mg P L-1) in the tilled layer (0-20 cm), slightly lower in 20-30 cm (0.05 mg P L-1) and much lower below (0.01 mg P L-1). In [NT, 0.5P] and [NT, 1P] plots, Cp was higher (0.28 et 0.19 mg P L-1) in the 0-10 cm layer compared to the tilled layer in MP, but decreased sharply with depth. This vertical stratification in NT was also observed for P-Olsen, P-M3 and other nutrients as C, N, and K. After 23- and 24-year of experimentation, maize roots tended to be fewer (-14%) under NT than MP, probably because of increased weed infestation under NT. For soybean, more roots accumulated in the 0-10 cm layer under NT (44% of total length) than MP (21%) and vice versa for the 10-20 cm layer. Those differences in root distribution under NT and MP corresponded to the stratification of N, P, and K.
This data set on the distribution of roots and phosphorus was used i) to develop a 1D model describing P dynamics over several decades in MP, ii) to test a method to assess the spatial P uptake distribution according local root length density and soil P availability, and iii) to develop a spatial 2D model describing P dynamic in NT. This model simulates the soil P availability dynamic on long term according soil properties and crop root distribution within the soil profile for different soil preparation regimes and P fertilization rates. Although the model overestimates the P availability near the localized P fertilizer, it can predict soil P stratification in the NT treatment and its consequences on crop P uptake. This new model will be a useful tool to improve P fertilization management in context of no-till practices.
Keywords: tillage, no-till, direct drilling, conservation agriculture, phosphate fertilizer,
V
Résumé long :
Le travail du sol modifie la structure du sol et nombre de processus et facteurs de production impliqués dans le fonctionnement des agrosystèmes (teneur en eau, croissance et développement des cultures, transferts sol-plante, réactions physico-chimiques et microbiologiques, porosité du sol, population d’adventices, etc.). Le labour, qui mélange par retournement des couches superficielles de sol à l’aide d’une charrue, est toujours le mode de préparation du sol le plus couramment utilisé en France et au Québec. Mais les Techniques Culturales Sans Labour (TCSL) gagnent en importance depuis plusieurs décennies. En 2006, un tiers des cultures annuelles ont été implantées sans labour préalable du sol en France et au Canada. Les TCSL permettent d’économiser du temps, de l’énergie, de limiter l’érosion des sols, d’améliorer la biologie du sol. Les TCSL modifient les propriétés biologiques, physiques et chimiques du sol. Il y a en particulier accumulation de certains éléments dans les premiers cm de sol ce qui crée des gradients de concentration vers les couches plus profondes. Cette stratification est très marquée pour le phosphore (P), un nutriment majeur peu mobile, susceptible de limiter la production agricole. Les TCSL pourraient affecter la disponibilité du P du sol, l’absorption par les racines, et le fonctionnement général du cycle biogéochimique sur le long terme ce qui pourrait finalement affecter la fertilité des sols. Dans un contexte de raréfaction des gisements de phosphate facilement accessibles à faible coût, de protection des eaux de surface, de recyclage, il convient de mieux comprendre, décrire et prévoir ces réactions afin de valoriser au mieux les stocks dans le sol et de concevoir des systèmes de cultures adaptés et parcimonieux.
Ce travail a pour objectif d’étudier et d’analyser les impacts à long terme du non-labour sur le cycle biogéochimique du P à l’échelle de la parcelle cultivée et d’intégrer ces effets dans un modèle dynamique. La démarche expérimentale mise en œuvre a été d’abord d’analyser la répartition spatiale, verticale et horizontale, des caractéristiques du système racinaire (biomasse, longueur, surface et diamètre) et du P disponible du sol pour les plantes. Ensuite, la part de P prélevé a été calculée pour chaque masse élémentaire de sol en considérant leur contribution relative au stock de P disponible dans le profil du sol et leur contribution relative à l’enracinement. Enfin, ce jeu de données a été intégré dans les modèles 1D et 2D décrivant le fonctionnement à long terme du cycle biogéochimique du P à l’échelle de la parcelle cultivée avec et sans labour.
Cette recherche fut conduite à la station de recherche d’Agriculture et Agroalimentaire Canada située à L’Acadie, 40 km au sud-ouest de Montréal, Québec, Canada. Cet essai a été initié en 1992 sur un limon argileux en climat continental humide à forte amplitude thermique et cultivé selon une succession culturale maïs-soja. Le dispositif expérimental était de type split-plot avec 4 répétitions. Le facteur principal comprenait 2 modalités de préparation du sol [avec labour (MP) sur une profondeur de 20 cm et absence de labour (NT)] en parcelles principales, subdivisé par 3 doses de fertilisation phosphatée [0 (0P), 17.5 (0.5P), 35 (1P) kg P ha-1 apportées
uniquement sur la phase de maïs], en sous-parcelles. L’engrais a été localisé à 5 cm de profondeur et à 5 cm du rang de maïs. Les résidus de récolte ont été restitués au sol. Le rendement en grains et leur teneur en P ont été mesurés chaque année dans chaque parcelle expérimentale. Le flux annuel de P exporté a été calculé en multipliant le rendement par la teneur en P. Les distributions spatiales 2D des racines dans le profil de sol ont été analysées en 2014 pour le maïs et en 2015 pour le soja de même que la disponibilité du P du sol pour les plantes en 2014. Des carottes (60 cm × Ø5 cm) de sols ont été prélevées au stade « floraison » à 5, 10 et 15 cm perpendiculairement au rang de culture. Elles ont ensuite été découpées pour obtenir 5 couches de sol (0-5, 5-10, 10-20, 20-30, 30-40 cm) chez le maïs et une 6ème couche (40-60 cm) chez le soja. Après séparation à l’eau, la longueur, la surface, la biomasse et le diamètre des racines ont été déterminées par analyse d’image pour chaque unité élémentaire de sol. En 2014, un second échantillonnage identique a été effectué pour collecter les échantillons
VI de sol, séchés à 40 °C, broyés à 2 mm avant l’analyse de la disponibilité du P du sol pour les plantes. Deux approches ont été utilisées : i) une approche mécaniste qui consistait à mesurer dans des suspensions de terre, la concentration (Cp) des ions phosphates en solution et la quantité d’ions phosphate diffusibles à l’interface solide-solution ; ii) des extractions chimiques utilisées dans les laboratoires d’analyses de sol pour raisonner la fertilisation phosphatée. Il s’agit des extractions Mehlich3 (solution de 0.015M NH4F + 0.25M NH4NO3 + 0.2M
CH3COOH + 0.013M HNO3 + 0.001M EDTA avec un pH de 2.5) et Olsen (solution de 0.5M
NaHCO3 avec un pH de 8.5) respectivement utilisées au Québec et en France. D’autres
propriétés qui pouvaient influencer le développement des racines (pH, teneur totale de C et N, teneur de K, Ca, Mg, Na, Fe, Al par l’extraction Mehlich3) ont également été déterminées.
En moyenne des 13 années de culture de maïs, le rendement-grains annuel du maïs était de 7.3 (±2.1) Mg ha-1. Sous NT, il y avait une réduction significative de rendement particulièrement nette en 2012 (-55% de MP) et 2014 (-45% de MP). L’effet de la fertilisation P n’était pas significatif même si le rendement de 1P était légèrement supérieur à ceux de 0P et 0.5P. En moyenne sur 11 années de culture de soja, le rendement annuel en grains était de 2.5 (±1.1) Mg ha-1. Il était significativement plus faible sous NT (2.3 Mg ha-1) que sous MP (2.7 Mg ha-1) et ne différait pas entre 0P, 0.5P et 1P. Les teneurs en P des grains de maïs (0.23 mg P kg MS-1) et de soja (0.55 mg P kg MS-1) étaient invariante entre NT et MP alors qu’elles étaient significativement plus faibles chez 0P (0.23 et 0.54 mg P kg MS-1 pour maïs et soja) par rapport à 0.5P et 1P (0.24 et 0.56 mg P kg MS-1 pour maïs et soja). La différence, cumulée sur les 24 années d’expérimentation, entre le P apporté par la fertilisation et le P exporté dans les récoltes, était de -391 (±31), -170 (±36) et de +29 (±43) kg P ha-1 pour, respectivement, 0P, 0.5P et 1P sous MP. Ces valeurs étaient supérieures d’environ 50 kg ha-1 en moyenne sous NT. Quelle que soit l’approche analytique, mécaniste ou chimique, les informations sur le P disponible du sol étaient similaires puisque les résultats des différentes méthodes étaient corrélées. Le P disponible du sol en 2014 ne changeait pas significativement dans la couche labourée, puis baissait légèrement dans la couche sous-jacente (20-30 cm) et considérablement dans la couche 30-40 cm. Pour NT-0.5P et NT-1P, le P disponible dans la couche 0-10 cm était significativement plus élevé que dans la couche labourée de MP-0.5P et MP-1P mais diminuait rapidement avec la profondeur. Pour tous les régimes de fertilisation en P, il y avait significativement plus de P disponible dans la couche (20-30 cm) du MP que dans celle du NT. Cela indiquait qu’il y a eu un mélange de sol au-delà de la profondeur théorique de labour et qu’une fraction de l’apport de P a été diluée bien au-delà de 20 cm. Les valeurs de Cp étaient faibles dans ce sol qui a une capacité élevée à réagir avec les ions phosphatés, équivalente à celle d’un limon argileux en France. Pour le régime de fertilisation 1P, qui correspondait à un bilan proche de zéro, Cp était 0.093 (±0.026) mg P L-1, les quantités d’ions phosphatés diffusibles en équilibre à cette concentration étaient de 65, 180 et 385 kg P ha-1 après une journée, un mois et un an d’équilibre, respectivement, et les teneurs en P-Olsen et M3-P étaient respectivement de 23 et 75 mg P kg-1 sol. Cp diminuait pour 0.5P (0.077 mg P L-1) et 0P (0.041 mg P L-1) en relation directe avec les bilans de P de plus en plus négatifs.
La stratification verticale sous NT était également observée à des degrés divers pour d’autres éléments, comme le carbone, l’azote avec des teneurs 5 fois plus élevées dans la couche 0-5 cm que dans la couche 30-40 cm. Le potassium était près de deux fois plus concentré dans la couche 0-5 cm que dans la couche 5-10 cm.
Le maïs et le soja avaient un système racinaire comparable : la fréquence des racines baissait avec la profondeur du sol et la distance au rang. Après 23 et 24 années d’expérimentation, ni le mode de préparation du sol ni la fertilisation P n’ont affecté significativement les caractéristiques des racines de maïs ou du soja. La distribution des racines de maïs était similaire sous NT et MP mais systématiquement plus faible sous NT. Ainsi, la
VII moyenne générale de la densité de longueur de racines (RLD) de maïs était de 1.48 et 1.28 cm cm-3 sous MP et NT, respectivement. Cette diminution sous NT touchait essentiellement les racines primaires (Ø > 0.8 mm) et secondaires (Ø compris entre 0.2 et 0.8 mm). Elle était probablement due à la présence dans NT d’une population plus importante d’adventices même si d’autres facteurs pouvaient contribuer à l’expliquer, comme la densité apparente du sol. La RLD tendait également à baisser avec un apport plus faible de fertilisation phosphatée (1.29, 1.23 et 1.69 cm cm-3 pour 0P, 0.5P et 1P, respectivement).
Pour le soja, la moyenne générale de la RLD était de 1.95 et 1.55 cm cm-3 sous NT et MP, respectivement. On observait des effets marqués et antagonistes sur la distribution des racines avec la profondeur du sol. Il y avait beaucoup plus de racines dans la couche 0-10 cm sous NT avec 44% de la longeur racinaire totale contre seulement 24% sous MP. C’est l’inverse dans la couche 10-20 cm avec 21% de la longeur racinaire totale sous NT et 36% sous MP. Ces effets suivaient la stratification verticale des nutriments majeurs (N, P, K) même si les écarts tendaient à s’atténuer lorsque le régime de fertilisation passait de 0P à 1P.
Ce jeu de données sur le système racinaire et la disponibilité du P du sol a été utilisé pour tester un modèle 1D décrivant le cycle du P dans la couche labourée du sol et construire un modèle spatialisé 2D adapté au contexte des TCSL. Les deux modèles étaient basés sur une équation de conservation de la masse de P dans la masse de sol considéré. Cette équation reliait la dynamique du P disponible au bilan annuel des entrées et des sorties de P. Le modèle 1D permettait de prévoir les évolutions à long terme observées sous MP dans l’essai L’Acadie. Le modèle 2D simulait l’évolution à long terme des stratifications verticales en fonction du niveau de fertilisation phosphatée et des caractéristiques de sorption-désorption des ions phosphates avec la phase solide du sol. Mais la confrontation entre les simulations et les observations de terrain des valeurs de Cp montrait que le modèle 2D surestimait de beaucoup les valeurs de Cp dans les unités de sol recevant la fertilisation phosphatée. Plusieurs raisons pouvent expliquer ce décalage, comme par exemple :
• précision de la localisation de l’engrais d’une fois sur l’autre ;
• non prise en compte du transport de sol fertilisé par les vers de terre ;
• sous-estimation de la durée de diffusion du P de l’engrais dans la phase solide du sol ; • précipitations locales du P au voisinage du granule d’engrais...
Le modèle 2D permettait néanmoins de simuler les effets à long terme du mode de travail du sol en interaction avec les pratiques de fertilisation sur le cycle du P. Il peut être utilisé pour évaluer ces effets dans d’autres contextes pédoclimatiques et de tester des scénarios visant à accroître l’efficience d’acquisition et d’utilisation du P à l’échelle parcellaire. Ce travail contribue à une compréhension connaissance plus approfondie des conséquences de la stratification spatiale du P du sol sur le prélèvement de P en relation avec les propriétés du sol et le développement du système racinaire.
Mots clés : labour, sans-labour, semis direct, agriculture de conservation, fertilisation
phosphatée, agrosystèmes, stocks et flux, interception racinaire, sol, fertilité, bilan, disponibilité du P du sol pour les plantes ; transfert d’ions phosphate à l’interface solide-solution ; sorption-désorption ; dilution isotopique
VIII
Long abstract:
Tillage alters soil structure and several processes and factors involved in the functioning of agro-ecosystems (water content, crop growth and development, soil-plant transfers, physio-chemical reactions and soil porosity, weed population, etc.). Plowing, that inverts soil surface, is still the tillage method most frequently used in France and Quebec. But no-till practice for soil preparation increased over the past decades. In 2006, one third of annual crops have been grown without prior soil tillage in France and Canada. No-till, as well as other simplified soil preparation techniques may save time and energy, reduce soil erosion and improve soil biodiversity. It also changes soil biogeochemical properties by accumulating nutrients in the upper soil layers and by building vertical concentration gradients. This stratification is evident for phosphorus (P), a major but little mobile element that may limit agricultural production. No-till could thus influence the long-term availability of soil P, root P uptake and the general function of soil biogeochemical cycle that could ultimately affect soil fertility. In the context of scarcity of easily accessible high-quality phosphate deposits, surface water protection and P resource recycling, it is necessary to better understand, describe and predict changes in the P cycle under different systems in order to maintain optimum P levels in the soil, increase P use efficiency and implement sustainable agricultural systems.
This work aims to study and analyze the impacts of no-till on the biogeochemical cycle of P across the cultivated land and elaborate operational models. The experimental approach was first implemented to analyze the spatial distribution of root traits (biomass, length, area and diameter) and the soil available P to plants. Then, the amount of P uptake for each unit mass of soil was calculated by considering the relative contribution of soil available P stocks and roots. Finally, this data set has been integrated into 1D and 2D models describing the long-term function of the biogeochemical cycle of P at field scale in moldboard plough (MP) and no-till (NT) systems, respectively.
The research was conducted on the research station of Agriculture and Agri-Food Canada located at L’Acadie, 40 km southwest of Montreal, Quebec, Canada. This trial has been initiated in 1992. A crop rotation of corn-soybean was established on a clay loam soil under a humid continental climate. The experimental design was a split-plot plan with 4 repetitions. The main factor included 2 tillage methods [moldboard plough (MP) to a depth of 20 cm and no-till (NT)] with three phosphate fertilizer doses [0 (0P), 17.5 (0.5P) 35 (1P) kg P ha-1 applied in the corn
phase] randomly assigned to sub-plots. The fertilizer was located 5-cm deep and 5-cm from the corn row. Crop residues were returned to soil after harvest. Grain yields and P contents were measured every year in each sub-plot. The annual flow of P exportation was calculated by multiplying grain yield by grain P content. The 2D spatial root distributions in the soil were determined for corn in 2014 and soybean in 2015 as well as soil P availability was determined in 2014 only. Soil cores (Ø = 5.25 cm) were taken to a depth of 40 cm at 5, 10 and 15 cm intervals perpendicularly to crop row at “bloom” stage. Cores were cut into five soil layers (0-5, 5-10, 10-20, 20-30, 30-40 cm) for corn and also a sixth layer (40-60 cm) for soybean. After separating soil from roots, root length, surface, biomass and diameter were determined by image analysis. At the same time of corn root sampling, a second series of soil samples was conducted to determine soil P test. Soil samples were dried at 40 °C then crushed to <2 mm before analysis. Two approaches were used: i) a mechanistic approach that consisted in measuring phosphate ion concentration (Cp) in soil suspensions and the amount of diffusive phosphate ions at the solid-solution interface; ii) routine chemical extractions to manage P fertilization. Extraction methods were Mehlich3 (solution of 0.015M NH4F + 0.25M NH4NO3 + 0.2M CH3COOH +
0.013M HNO3 + 0.001M EDTA with pH at 2.5) and Olsen (0.5M NaHCO3 solution with pH at
8.5), used in Quebec and France, respectively. Other properties (pH, total contents of C and N, and contents of K, Ca, Mg, Na, Fe, Al by Mehlich3 extraction), that could also influence root development, were also determined.
IX Average corn yield was 7.3±2.1 Mg ha-1. The NT significant reduced yields, particularly
in 2012 (-55% MP) and 2014 (-45% MP). The P fertilization effect had not significant effect although 1P yielded slightly higher than 0P and 0.5P. Average soybean yield was 2.5±1.1 Mg ha-1. Soybean yield was significantly lower under NT (2.3 t ha-1) than MP (2.7 t ha-1) and did
not differ among 0P, 0.5P and 1P. The P contents in corn and soybean (0.24 and 0.55 mg P kg DM-1) were similar between NT and MP but were significantly lower in 0P (0.23 and 0.54 mg P kg DM-1 for corn and soybean, respectively) than 1P and 0.5P (0.24 and 0.56 mg P kg DM-1 for corn and soybean, respectively). Over 24 years of experimentation, the differences between P supplied by fertilization and P exportations by the crops, were -391±31, -170±36 and 29±43 kg P ha-1, respectively, for 0P, 0.5P and 1P under MP. Those values were about 50 kg P ha-1
greater under NT on average.
Soil tests were closely correlated. Under MP, soil available P did not differ significantly in the upper 20 cm, slightly declined in the underlying layer (20-30 cm) and declined much more in the bottom layer (30-40 cm). In [NT, 0.5P] and [NT, 1P] plots, soil available P was higher in the 0-10 cm layer compared to MP and decreased sharply with depth. Soil available P was systematically lower in the 20-30 cm layer under NT than MP, indicating soil mixture of beyond the theoretical depth of plowing (20 cm). The Cp values were low in the experimental soil hence showing high reactivity with the phosphate ions, equivalent to the clay loam soil in France. For 1P that led to a nearly zero P budget, the Cp value was 0.093±0.026 mg P L-1. The amount of diffusible phosphate ions at equilibrium at 0.093±0.026 mg P L-1 were 65, 180 and 385 kg P ha-1 after one day, one month and one year of equilibration, respectively. The P-Olsen
and P-M3 values were 23 and 75 mg P kg-1, respectively, for 1P. The Cp decreased for 0.5P (0.077 mg P L-1) and 0P (0.041 mg P L-1), leading to more negative P budgets.
Vertical stratification in NT was also observed to varying degrees for other elements such as carbon, nitrogen, with contents five times higher in the 0-5 cm layer than in the 30-40 cm layer; potassium was almost two times more concentrated in the 0-5 cm layer than in the 5-10 cm layer.
Corn and soybean showed comparable root systems: root density decreased with depth and distance to crop row. After 23- and 24-year of experimentation, neither soil tillage nor P fertilization significantly affected the traits of corn and soybean roots. Corn roots were distributed similarly under NT and MP, but were consistently lower with depth under NT. Thus, the average root length densities (RLD) for corn roots were 1.48 and 1.28 cm cm-3 under MP and NT, respectively, due to the reduction in primary (Ø > 0.8 mm) and secondary (Ø between 0.2 and 0.8 mm) roots under NT attributable to a larger population of weeds and higher soil bulk density under NY. The RLD also tended to decrease with decreasing levels of P fertilization (1.29, 1.23 and 1.69 cm cm-3, respectively in 0P, 0.5P and 1P).
For soybean, the RLDs averaged 1.95 and 1.55 cm cm-3 under NT and MP, respectively. There were more roots in the 0-10 cm layer under NT with 44% of total roots (in length) compared to 24% under MP. It was the inverse in the 10-20 cm layer with 21% of total roots (in length) under NT and 36% under MP. These different root distributions were consistent with the stratification of major nutrients (N, P, and K) while the difference tended to be mitigated as fertilizer rate increased from 0P to 1P.
Those data sets for root system and the soil available P were used to elaborate a 1D model on the P cycle in the tilled soil layer under MP and a 2D model for the P cycle in the NT system. Both models were based on a mass balance equation relating available P to the annual budget of P. The 1D model predicted the long-term evolution of soil available P under MP at L’Acadie. The 2D model simulated the long-term evolution of vertical soil P stratifications based on P
X fertilization. However, the 2D model overestimated the Cp values in soil units receiving fertilizer P. Several reasons may explain such overestimation, such as:
• fertilizer localization varying during the long-term experiment;
• not taking into account the movement of fertilized soil caused by bioturbation; • underestimation of P fertilizer diffusion in the soil solid phase;
• local P precipitation in the vicinity of granule fertilizer, etc.
The 2D model, however, could simulate the long-term effects on soil P cycle of soil tillage interacting with P fertilization. It can be used to assess such effects under other soil and climatic conditions and run scenarios to increase P use efficiency at the field scale. This work contributes to a deeper understanding of the consequences of soil P stratification on P uptake in relation to soil properties and root development.
Keywords : tillage, no-till, direct drilling, conservation agriculture, phosphate fertilizer,
agro-systems, stocks and flows, root interception, soil fertility, P budget, available soil P, phosphate ion transfer at the solid-solution interface, sorption-desorption, isotope dilution.
XI
Table des matières
Résumé : ... IIIII Abstract : ... IV Résumé long: ... V Long abstract: ... VIII Table des matières ... XII Liste des Tableaux ... XIV Liste des Figures ... XVIIII Chapter I Phosphorus cycle in agroeco-systems and conservation agriculture: General
Introduction ... 1
Chapter II Phosphorus in agro-system ... 4
2.1. General situation of phosphorus resource in the world ... 4
2.2. Phosphorus in soil ... 5
2.2.1. Phosphorus species in soil ... 5
2.2.2 Soil phosphorus availability to plants ... 7
2.2.3. Soil phosphorus test ... 8
2.3. Phosphorus cycle in field ... 10
2.3.1. Phosphorus fertilizer application ... 10
2.3.2. Phosphorus losses by erosion, runoff and leaching ... 12
2.3.3. Phosphorus uptake by plants ... 13
2.3.4. Other phosphorus flows ... 14
2.4. Phosphorus management ... 15
2.4.1. Crop response to applied phosphorus ... 15
2.4.3. Phosphorus in nutrient balance ... 18
2.4.4 Simulation models of phosphorus cycle in agrosystems ... 19
2.5 Conservation agriculture and no-till system ... 21
2.5.1. Conservation agriculture ... 21
2.5.2. No-till and simplified tillage methods ... 21
2.5.3. Advantages and disadvantages of no-till ... 22
2.5.4. Soil properties and nutrient distribution under no-till ... 24
2.6 Hypotheses and objectives ... 27
Chapter III The Long-term (23 years) Effects of Tillage Practice and Phosphorus Fertilization on the Distribution and Morphology of Corn Root ... 29
3.1. Résumé ... 31
3.2. Abstract ... 32
3.3. Introduction ... 33
3.4. Materials and Methods ... 34
3.4.1. Site description ... 34
3.4.2. Root sampling and analysis... 34
3.4.3. Soil sampling and analysis ... 35
3.4.4. Crop harvest ... 35
3.4.5. Statistical analysis ... 36
3.5. Results ... 36
3.5.1. Root mass and its distribution in soil profile ... 36
3.5.2. Root morphological traits: root surface density, root length density, average root diameter, root diameter distribution and root P content ... 37
3.5.3. Soil properties ... 38
3.5.4. Corn yield, and cumulative P budget and relation with corn roots ... 38
3.6. Discussion ... 39
3.6.1. Spatial distribution of corn roots ... 39
3.6.2. Corn roots affected by tillage practice ... 40
3.6.3. Corn roots affected by P fertilization ... 41
XII
3.7. Conclusion ... 42
3.8. Acknowledgement ... 42
Chapter IV Soybean root traits after 24 years of different soil tillage and mineral phosphorus fertilization management ... 58
4.1. Résumé ... 60
4.2. Abstract ... 61
4.3. Introduction ... 63
4.4. Materials and Methods ... 63
4.4.1. Site description ... 63
4.4.2. Root sampling and analysis... 64
4.4.3. Soil sampling and analysis ... 65
4.4.4. Crop harvest ... 65
4.4.5. Statistical analysis ... 65
4.5. Results and discussion ... 66
4.5.1. Soil nutrient stratification ... 66
4.5.2. Lateral and vertical root characteristics ... 66
4.5.3. Root quantity (biomass) affected by tillage and P fertilization ... 67
4.5.4. Vertical root length proportion affected by tillage and P fertilization ... 68
4.5.5. Root morphology affected by tillage and P fertilization ... 69
4.5.6. Soybean yields ... 69
4.6. Conclusion ... 70
4.7. Acknowledgements ... 70
Chapter V Validation of an operational phosphorus cycling model CycP for a long-term ploughed and soybean-corn cropped agroecosystem in eastern Canada ... 84
5.1. Résumé ... 85
5.2. Abstract ... 86
5.3. Introduction ... 87
5.4. Materials and methods ... 87
5.4.1. Field experiment ... 87
5.4.2. Laboratory determination of soil properties needed to calculate plant-available soil P ... 88
5.4.3. Validation of the CycP model ... 89
5.5. Results and Discussion ... 90
5.5.1. Dynamics of diffusive Pi at the solid-to-solution interface of soil ... 90
5.5.2. Simulations vs. field-observations of Cp ... 90
5.5.3. Simulations of P fertilization scenarios with CycP model ... 91
5.6. Conclusion ... 91
5.7. Acknowledgments ... 92
Chapter VI Spatial assessment of the contribution of subsoil P to crop P nutrition ... 97
6.1. Résumé ... 98
6.2. Abstract ... 99
6.3. Introduction ... 100
6.4. Materials and Methods ... 100
6.4.1 Site description ... 100
6.4.2 Soil sampling for phosphate ion transfer kinetics ... 101
6.4.3 Soil sampling for Cp along soil profile ... 102
6.4.4 Root sampling and analysis... 102
6.4.5 Phosphorus uptake weighting factor and proportion ... 103
6.4.6 Statistical analysis ... 103
6.5. Results ... 104
6.5.1 Soil P status (Cp) data ... 104
6.5.2 Crop root distributions ... 104
XIII
6.5.4 Phosphate uptake proportions ... 105
6.6. Discussions ... 105
6.6.1 P uptake effected by tillage practice ... 105
6.6.2 P uptake proportion from subsoil P stock ... 106
6.7. Summary and conclusion ... 106
6.8. Acknowledgements ... 106
Chapter VII Simplified model for phosphorus cycle in long-term no-till agroecosystems ... 127
7.1. Résumé ... 128
7.2. Abstract ... 129
7.3. Introduction ... 130
7.4. Materials and methods ... 130
7.4.1. Model structure ... 130
7.4.2. P flux estimation ... 131
7.5. Software ... 134
7.6. Results and discussion ... 134
7.6.1. P stock and flux ... 134
7.6.2. Soil P status evolution in NT ... 135
7.6.3. Comparison with measured data... 135
7.7. Conclusions ... 136
7.8. Acknowledgement ... 136
Chapter VIII Conclusion and perspectives ... 146
Addenda ... 149
XIV
Liste des Tableaux
Table 2-1 World and regional growth in P fertilizer demand, 2014 to 2018
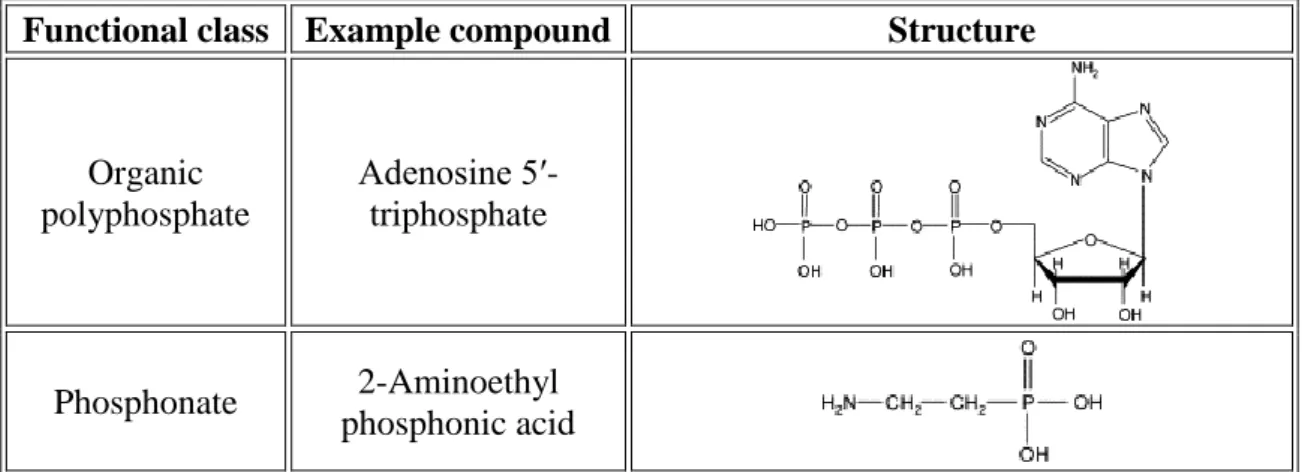
Table 2-2 Common soil organic phosphorus compounds
Table 2-3 Dry matter production (DMW), total P (Pt=Ps+Pa), P taken up by crop from soil (Ps)
and applied P (Pa), and bioavailability indicators, effective P recovery from applied P (REC) and relative contribution of applied P to plant nutrition (Pdff)
Table 2-4 Results of P budget and soil test P correlation in several sites.
Table 2-5 Sequential orthogonal partition between six nutrients to compute five ilr orthonormal
coordinates.
Table 2-6 Plant and soil variables for simulation of P uptake by Cushman's mechanistic
mathematical model, their definition, and values for Williams soybeans growing on Raub silt loam
Table 2-7 Extent of no-till adoption world-wide (countries with >100 000 ha)
Table 2-8 Simplified techniques for soil preparation
Table 2-9 Tillage parameters of applications. 1. Conventional tillage with moldboard plough,
2. Minimum tillage with heavy-duty disk harrow and combination of spring tine harrow and spiral roller, 3. Minimum tillage with one pass of soil tillage combination of chisel, rotary tiller and spiral roller, 4. No-till for direct seeding.
Table 2-10 Relative agronomic advantages and disadvantages of no-till in Europe, although
not universally relevant
Table 3-1 Analysis of variance for root mass density (RMD), root surface density (RSD), root
length density (RLD), average root diameter, tertiary (diameter<0.2 mm), secondary (0.2 mm<diameter<0.8 mm) and primary (diameter>0.8 mm) root length densities (3rdRLD,
2ndRLD, 1stRLD) and proportion balances (RLilr1 and RLilr2), and P contents in root as affected by tillage and P fertilization and the interactions with sampling depth and perpendicular distance to corn row.
Table 3-2 Root mass density (RMD), root surface density (RSD), root length density (RLD),
average root diameter, tertiary (diameter<0.2 mm), secondary (0.2 mm<diameter<0.8 mm) and primary (diameter>0.8 mm) root length densities (3rdRLD, 2ndRLD, 1stRLD), length proportion balances (RLilr1 and RLilr2) and length proportions (3rdRL%, 2ndRL%, 1stRL%), and P contents in root of different sampling depth and perpendicular distance to corn row.
Table 3-3 Root mass density (RMD), root surface density (RSD), root length density (RLD),
XV primary (diameter>0.8 mm) root length densities (3rdRLD, 2ndRLD, 1stRLD) length proportion
balances (RLilr1 and RLilr2) and length proportions (3rdRL%, 2ndRL%, 1stRL%) of different tillage practice and P fertilization.
Table 3-4 Root surface density (RSD) under no-till (NT) and moldboard plough (MP) for the
different sampling of soils with depth and perpendicular distance to the corn row.
Table 3-5 Analysis of variance for soil bulk density (BD), pH, contents of C and N, and soil P
status (P-Olsen) as affected by tillage and P fertilization and the interactions with sampling depth and perpendicular distance to corn row.
Table 3-6 Soil bulk density (BD), pH, contents of C and N, ratio C/N and soil P status
(P-Olsen) for the interactions of tillage practice or P fertilization and sampling depth.
Table 3-7 Analysis of variance for corn yield as affected by tillage and P fertilization and the
interactions with years.
Table 4-1 Effects of tillage and P fertilization and interactions with depth and distance soil on
Mehlich3-P (P-M3), Mehlich3-K (K-M3), C and N contents (%).
Table 4-2 Effects of tillage and P fertilization and interactions with depth and distance on root
mass density (RMD), root surface density (RSD), root length density (RLD), average root diameter, tertiary (diameter<0.2 mm), secondary (0.2 mm<diameter<0.8 mm) and primary (diameter>0.8 mm) root length densities (3rdRLD, 2ndRLD, 1stRLD) and proportion balances (RLilr1 and RLilr2) and root nodule density (RND, nodules per root length).
Table 4-3 Root mass density (RMD), root surface density (RSD), root length density (RLD),
average root diameter, tertiary (diameter<0.2 mm), secondary (0.2 mm<diameter<0.8 mm) and primary (diameter>0.8 mm) root length densities (3rdRLD, 2ndRLD, 1stRLD), length proportion balances (RLilr1 and RLilr2) and length proportions (3rdRL%, 2ndRL%, 1stRL%) and root nodule density (RND, nodules per root length) of different sampling depth, distance to soybean row, tillage practice (MP, moldboard plow; NT, no-till) and P fertilization (0P, 0.5P and 1P).
Table 4-4 Tertiary (diameter<0.2 mm), secondary (0.2 mm<diameter<0.8 mm) and primary
(diameter>0.8 mm) root length proportion balances (RLilr1 and RLilr2) and root length proportions (3rdRL%, 2ndRL% and 1stRL%) for different sampling depth under two tillage
practices (MP, moldboard plow; NT, no-till).
Table 4-5 Effects of tillage and P fertilization and interactions with year on soybean yield and
grain P content at maturity.
Table 4-6 Annual soybean yields and soybean grain P contents as affected by tillage (MP,
moldboard plow; NT, no-till) and P fertilization (0P, 0.5P, 1P ) from 1995 to 2015. The data of soybean grain P were recorded since the year of 2003. Different letters in a row indicate significant differences (P<0.05; t-test) between tillage practices (NT and MP) or P fertilizations (0P, 0.5P and 1P).
XVI
Table 6-1 Effects of tillage and P fertilization and their interactions with depth and distance
soil on phosphate ion concentration in soil solution (Cp)
Table 6-2 Effects of crop, tillage, P fertilization and their interactions on proportions of total P
uptake from the 0-10, 0-20 and 0-30 cm layers after transformation into alr1, alr2 and alr3.
Table 6-3 Average values of alr1, alr2, alr3 and proportions of total P uptake (Pup%) from the
0-10, 0-20 and 0-30 cm layers under different crops, tillage practices, interaction of tillage × crop and P treatments
Table 7-1 Initial phosphate ion concentration in soil solution (Cp) for soil units in the P model.
Table 7-2 Simulated P stock and flux (P fertilization and uptake, shoot P restitution, root P
restitution, P runoff and P leaching) in each soil grid unit of the soil zone (60 cm × 40 cm) under NT1P in 2014 (corn year)
Table 7-3 Simulated P stock and flux (P fertilization and uptake, shoot P restitution, root P
restitution, P runoff and P leaching) for each soil grid unit of the soil zone (60 cm × 40 cm) under NT1P in 2015 (soybean year)
XVII
Liste des Figures
Fig. 2-1 The P cycle in the biosphere
Fig. 2-2 Historical sources of phosphorus for use as fertilizers, including manure, human
excreta, guano and phosphate rock (1800–2000)
Fig. 2-3 Reversible relationships between P pools
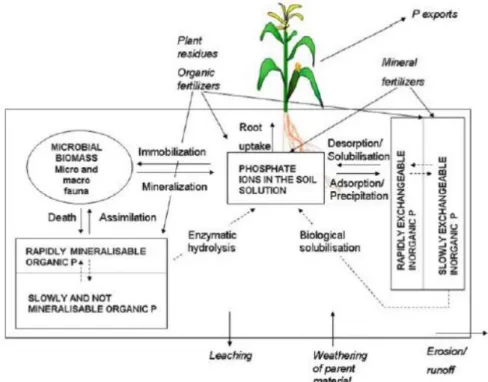
Fig. 2-4 Scheme of soil phosphorus cycle.
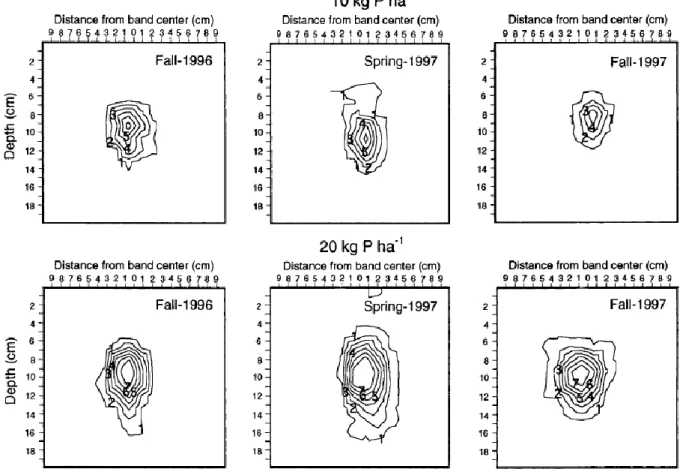
Fig. 2-5 Bray-1 P distribution from bands for fertilizer dosage of 10 and 20 kg P ha-1 in a Mexico soil. Values are relative to soil in adjacent nonband-affected soil and converted to log base 1.5
Fig. 2-6 Plant traits and mechanisms to improve P uptake efficiency. The P-efficient genotypes
integrate different traits and mechanisms for adaptation to low P availability and increase tolerance to P deficiency compared to P-inefficient genotypes. Adaptations to low P availability include: (1) more abundant and longer adventitious roots, (2) more horizontally oriented basal roots, (3) more taproot laterals, (4) more dispersed higher order laterals, (5) increased root hair density and length (together with increased organic acid exudation and more high-affinity P transporters), (6) greater association with mycorrhizae, and (7) greater formation of aerenchyma. Consequently, the soil volume explored by P-efficient genotypes is much larger compared to P-inefficient genotypes.
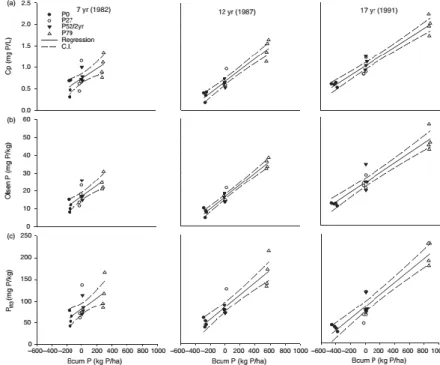
Fig. 2-7 Relationship between cumulative P budget (Bcum) and (a) concentration of P ions in
solution (Cp, mg L-1), (b) Olsen-P (mg kg-1), and (c) Mehlich3-P (PM3, mg kg-1) after 7, 12, and
17-year periods of cultivation at four P applications rates. Symbols: individual plots. Sampling year is in parenthesis. C.I. = 95% confidence interval.
Fig. 2-8 Correlation between the cumulative P budget and soil test P (Mehlich3-P) for the 0-15
cm soil layer showing a deflection point of cumulative P budget at about -80 kg P ha-1.
Fig. 2-9 Pools and flows of phosphorus in the EPIC P model
Fig. 2-10 Conceptual model of nutrient acquisition from the subsoil.
Fig. 2-11 Conceptualized effect of tillage on monthly surface runoff from NAEW watersheds
with well-drained soils
Fig. 2-12 Bulk densities as a function of soil depth at the end of 19 years of conventional tillage
and no-till in southern Ontario
Fig. 2-13 Soil water content under conventional tillage (CT) and no-tillage (NT) during 2000–
2001 and 2001–2002 growing seasons at Foggia, Italy. *Significant difference at P<0.05 level probability between tillage treatments.
XVIII
Fig. 2-14 Evolution of nutrient contents under no-till
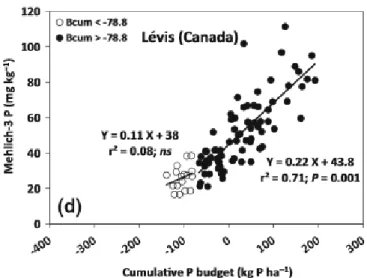
Fig. 2-15 Relationships between (a) Mehlich-3 P concentration (PM3), (b) Olsen P concentration
(POl) and cumulative P budget (Bcum) for mouldboard plough (MP) and (c) Mehlich-3 P
concentration (PM3), (d) Olsen P concentration (POl) and cumulative P budget (Bcum) for
no-till (NT) fertilized with nine combinations of three P and three N additions in the maize phase of a two-year maize and soybean rotation. P0, P17.5, and P35 represent additions of 0, 17.5, and 35 kg P ha−1. The three N addition rates were 0, 80, and 160 kg N ha−1
Fig. 3-1 Root mass density (RMD) (I), root surface density (RSD) (II), root length density
(RLD) (III) and average root diameter (IV) under different sampling depths and perpendicular distances to the corn row. Bars represent standard errors. Different letters indicate significant differences (P<0.05; t-test) among depths (0-5, 5-10, 10-20, 20-30 and 30-40 cm) for each perpendicular distance (5-cm, 15-cm and 25-cm).
Fig. 3-2 Root mass density (RMD) as affected by the interaction of tillage (NT and MP), P
fertilization (0P, 0.5P and 1P) and sampling depth. Bars represent standard errors. Different letters indicate significant differences (P<0.05; t-test) between tillage practices (NT and MP).
Fig. 3-3 Secondary root length density (2ndRLD) (I) and primary root length density (1stRLD)
(II) as affected by the interaction of tillage (NT and MP) and sampling depth. Bars represent standard errors. Different letters indicate significant differences (P<0.05; t-test) between tillage practices (NT and MP).
Fig. 3-4 Corn grain yields as affected by tillage (I) or P fertilization (II), and cumulative P
budget as affected by the interaction of tillage and P fertilization (III) in corn phases from 1992 2014. For (I) and (II): Bars represent standard errors. Different letters in (I) indicate significant differences (P<0.05; t-test) between tillage practices (NT and MP).
Fig. 3-5 Pearson correlation between corn yields at maturity and average root length density
over 40-cm profile at corn silking under MP and NT in 2014. Axis X: average root length density (cm cm-3); Axis Y: corn yield (t ha-1). Open circles represent mouldboard plough (MP) and filled triangles represent no-till (NT). Three data were not considered (one for MP and two for NT) because of the five outliers during data screening.
Fig. 3-6 Weed infestation on 4 July 2014 (32 days after sowing) in field-plot number 2 under
NT block.
Fig. 4-1 Soil P-Mehlich3 (P-M3) values as affected by the interaction of tillage (NT and MP),
P fertilization (0P, 0.5P and 1P) and sampling depth. Bars represent standard errors. Different letters indicate significant differences (P<0.05; t-test) between tillage practices (NT and MP).
Fig. 4-2 Soil C contents (1), N contents (2) and K-Mehlich3 (K-M3) values (3) as affected by
XIX Different letters indicate significant differences (P<0.05; t-test) between tillage practices (NT and MP).
Fig. 4-3 Root mass density (RMD) (1), root surface density (RSD) (2), root length density (RLD)
(3) and average root diameter (4) under different sampling depths and perpendicular distances to the corn row. Bars represent standard errors. Different letters indicate significant differences (P<0.05; t-test) among depths (0 5, 5 10, 10 20, 20 30 and 30 40 cm) for each perpendicular distance (5-cm, 15-cm and 25-cm).
Fig. 4-4 Root mass density (RMD) (1), root surface density (RSD) (2), root length density (RLD)
(3) and average root diameter (4) as affected by the interaction of tillage (NT and MP) and sampling depth. Bars represent standard errors. Different letters indicate significant differences (P<0.05; t-test) between tillage practices (NT and MP).
Fig. 4-5 Root surface density (RSD) (1) and root length density (RLD) (2) as affected by the
interaction of tillage (NT and MP), P fertilization (0P, 0.5P and 1P) and sampling depth. Bars represent standard errors. Different letters indicate significant differences (P<0.05; t-test) between tillage practices (NT and MP).
Fig. 4-6 (1) Scatterplot for six combined treatments ([MP and 0P], [MP and 0.5P], [MP and
1P], [NT and 0P], [NT and 0.5P] and [NT and 1P]) and (2) bi-plot for five vertical root length distribution variables (Vilr1, Vilr2, Vilr3, Vilr4 and Vilr5) of canonical discriminant analysis based on Mahalanobis distance for vertical distribution under combined tillage and P fertilization treatments. The analysis explained 85% of the variance (Axis of Can1 and Can2), suggesting that combined treatments can be discriminated by vertical root length distribution. (3) Vertical root length proportions in percentage of each sampled depth for six combined treatments.
Fig. 5-1 Experimental (symbols) and computed (lines) values for the gross amount of diffusive
Pi (Pr) transferred between solid and liquid phases in soil suspension as a function of Pi
concentration in solution (Cp, in mg P L–1) and elapsed time (4, 40, 400 min). For each of the 6 soils, 5 P applications were added, e. g. 0, 5, 10, 20, and 50 mg P kg-1 soil, and sorbed for 40 h before carrying out isotopic dilution kinetics for 4, 40 and 400 minutes
Fig. 5-2 Field-observed (mean ±standard-error) and simulated values of the Pi concentration in
soil solution (Cp) from 1992 to 2015 for the three doses of P fertilization, 0 (□), 17.5 (Δ),and
35 (
) kg P ha-1 applied to corn every two years. The CycP model considered P uptake from cropped plots from the plough layer, and one year to reach equilibrium for Pi reactions between the liquid and solid phases. Solid lines with bars represent the mean of the field-observed Cp and ±1 standard deviation for 2009 and 2014.Fig. 5-3 Simulations by CycP model of Pi concentration (Cp) in soil solution for different
scenarios of P dosage and initial Cp values. a) Seven scenarios at constant annual P budget, -20, -10, 0, +10, +-20, and +30 kg P ha-1 numbered 1 to 6, respectively, at initial Cp value of 0.2
mg P L-1. The 7th scenario represents high P dosage during the 5 first years (cumulated P of
XX concentration, i.e. 0.05 (□), 0.2 (Δ), 0.5 (), and 1 (O) mg P L-1, at constant annual P budget of
+30 kg P ha-1.
Fig. 6-1 Average temperature (°C) and precipitation (mm) in the growth season from June to
October at the experimental site of l’Acadie from 1994 to 2015 (no data for 1992 and 1993).
Fig. 6-2 Schematic structure of 2D soil profile to estimate proportions of total P uptake.
Fig. 6-3 Average values of phosphate ion concentrations (Cp, mg P L-1) in the soil profile for three P doses (0P, 0.5P and 1P) (a) and two tillage (MP and NT) (b). Different letters at a depth indicated significant (P<0.05) differences in Cp values between treatments (P dosage or tillage practice).
Fig. 6-4 Experimental (symbols) and calculated (lines) values for diffusive phosphate ions (Pr)
in the solid phase of soil suspensions as a function of phosphate ion concentration in solution (Cp, mg P L-1) and elapsed time of isotopic dilution (4, 40, 400 min) in the MP system.
Fig. 6-5 2D distribution of estimated proportions of total P uptake.
Fig. 7-1 Schematic structure of the P model. A soil profile 40 cm deep and 30 cm wide is
divided into 15 soil grid units by five depths (0-5, 5-10, 10-20, 20-30 and 30-40 cm) and six distances [(-30)-(-20), (-20)-(-10), (-10)-0, 0-10, 10-20 and 20-30 cm]. The model comprises two P pools and seven fluxes (in form of phosphate ions) in each soil grid unit. The two P pools are the amount of phosphate ions in soil solution and the amount of diffusive phosphate ions in soil solid phase buffering the soil solution over time. The two pools add up to soil P stock in each soil grid unit. The seven P fluxes are: 1. Attributed input of mineral P fertilizer; 2. Attributed Output of P uptake by crops. The P uptake is divided into three P fluxes as crop grains, shoots and roots, but only P in grains is exported; 3. Attributed input by P restitution with shoot residue; 4. Attributed input of P restitution from root residue; 5. Attributed output of runoff P; 6. Input of P leaching from upper grid unit. Soil grid units on surface do not receive P leaching input; 7. Output of P leaching to lower grid units.
Fig. 7-2 Correlation between cumulative P budget (kg P ha-1) and phosphate ion concentration
in soil solution (mg P L-1) of 2014 in MP plots at three P doses.
Fig. 7-3 Simulated phosphate ion concentrations (Cp, mg L-1 in log) in the 0-5, 5-10, 10-20,
20-30 and 30-40 cm layers from 1992-2015 under NT and three P doses (0P, 0.5P and 1P).
Fig. 7-4 Simulated phosphate ion concentrations (Cp, mg L-1) in the soil zone from 1992-2015
in NT under three P doses (0P, 0.5P and 1P) every five years.
Fig. 7-5 Comparison of simulated and measured phosphate ion concentrations (Cp, mg L-1) in
XXI
Remerciements :
This international cooperative program, which is financially supported by the Program l’IdEx of University of Bordeaux, Agriculture and Agri-Food Canada and Laval University, has lasted more than three years since 2013. Our work took place on both sides in Agriculture and Agri-Food Canada, Quebec and in UMR ISPA, INRA Aquitaine, Bordeaux. During the three years, a lot of people have helped me to overcome all the difficulties in the research and in life. So here I would like to show my gratefulness to all of you.
At the beginning, I would like to thank all my supervisors.
Noura, thanks for your support during the whole time not only in reseach but also in many aspects of life. I remembered that Christian had complained once that you were too kind to us. I cannot deny, but we all appreciate a lot that you treat us as members of family.
Mr. Parent, the professor who I would like to show my best admiration. I am really impressed by the excellent academic qualification of your work. I am even more impressed by humor and passion that you showed during the work, which I always seek for during my study. Christian, I appreciate all the arguments that we made in the study, even you have won almost all of them. But the very thing that I would like to thank you is that you have made your best effort to guide my work. During the first year, you always used your experience to convince me. But when you found it did not work on me, you have changed your way to discuss with me and to encourage me. It is now very kind to see the phrase “Bonne continuation” at the end of each mail you send to me.
Alain, I believe that without you, it could be difficult when we had arguments on the research. I think I could never be as elegant, calm and patient as you, but it does bother that you are the perfect type of professor.
Then, I would like thank to all the colleagues who helped me to conduct the experiments: Sylvie Michaud, Sylvie Côté, Claude Lévesque, Bernard Gagnon, Mervin St. Luce, Gilles Belanger, Maxime Lemieux, Danielle Mongrain, Marie-Noëlle Thivierge, Léonie Côté, David Gallion and Marc Laverdiere. Thanks for all your excellent work to keep the program moving forward smoothly.
As a program between France and Canada taken by a Chinese student, we have confronted with some administration problems. Fortunately, many people have helped me to overcome all the difficulties. Thus, I would like to thank all of them: Lise Monneraud, Laurie François, Alice Rivière, Brigitte Bordes, Nicolas Méadeb, Nathalie Vigon, Sophie Gautier, Antoine Karam, Nadine Lemay, Marie-Andrée Ouellet, Patricia Braconnier and etc.
I also thank the l'Association Québécoise des Spécialistes en Science du Sol, Canadian Soil Science Society and Centre Sève to offer us financial support for travelling to present our research results in several conferences.
I should also thank my master supervisor Arnaud Gauthier, who has persuade me to hold my decision to take a doctor degree so that I could insist until I got the chance to participate in this program.
I am also grateful that my Brazilian friends (Alessandra Kozovits, Antonella Schettini, Mariangela Leite and Cristina Messias) had made me to join their research on soil heavy metal contamination, which helps me to open my horizon in soil study.
XXII Besides, I would like to thank my family and my friends, who gave me a wonderful journey during this time so that I could be active and energic for the work.
Mother, thank you for raising me up and support me during all difficulties.
Father, even I have not seen you, but your things taught me that I should be responsible for the people who trust me.
My old friends, Zhang Siyu, Qiao Yujie, Xu Jing, Jin Beibei, Zhang Xiaoxi, Qu Zihan and Huo Da. Thank you for the our 10 year-journey, even though we are now apart over the world, the journey will go on.
Then, Zhang Tianchen, Sun Xiaohui, Li Jiaxi and Lin Tianjun, it is you who let Christian joke on me for returning Lille for almost every vocation.
On the other side, Shi Yichao, Xu Yan, Reza Jamaly, Xu Qihe, Wen Guoqi, Jin Yuexia and of course little Nancy, you all have made the cold winter of Quebec warm and lovely.
Chen Wanying, we have shared the same experience in both France and Canada. But I can never imagine that my first visit to my dream Juventus stadium could be accompanied by such a lovely, wonderful, interesting and brave girl.
I would like also thank my friends in China, who are always ready to give me a hand whenever I need help in their aspects for the study. Thanks Pu Jianwei, Ke Cheng, Wang Zhe, Li Jia and Xia Tao.
I should also thank to my two hosts, Mr. Guy Paquin and Mme. Odile Dern, who have offered me the comfortable accomodations during my stay in Quebec and Bordeaux.
And at last, I should give my gratefulness to some of my idols.
Kobe Bryant, who taught me to be strict to improve myself, and to be courageous to challenge the best.
Juventus, who taught me to have faith in the way that I choose, and to insist when difficulty appears.
Jiraiya, who taught me to be tolerant and to understand the others. Thanks to all of you.
XXIII
Avant-propos :
Phosphorus (P) is the second most important element for crop growth. Appropriate P fertilization is required for optimum crop yields, while over-fertilization and inadequate fertilization may lead to P losses and eutrophication of surface waters.
The objective of this study was to analyze some aspects of soil P cycle under different soil tillage practices (conventional tillage and no-till) and P dosages and to elaborate P cycle models by taking simultaneously into account the root system and soil P transfer. The research comprises three parts: 1. A long-term field experiment started in 1992 on a corn-soybean rotation conducted at the l’Acadie research station, Agriculture and Agrifood Canada where root and soil P distribution were paired. 2. Laboratory work on soil samples from the same plots to characterize phosphate ion transfer kinetics at the solid-liquid interface. 3. A model to describe the P cycle under different tillage and P fertilization regimes.
This paper comprises eight chapters. Chapters I and II make the general introduction and provide a narrative synthesis of the literature on soil P. Objectives and hypotheses are listed at the end of Chapter II.
Results are presented in Chapters III, IV, V, VI and VII in the form of articles. Chapters III and IV have already been published in <<Plant and Soil>> and <<Soil Tillage Research>>, respectively. Chapters III and IV have been presented in three conferences as oral presentations in 2015 (Joint meeting: Commission 2.5 of the International Union of Soil Science, Canadian Society of Soil Science, and Association Québécoise de Spécialistes en Sciences du Sol) and 2016 (Annual Meeting of Canadian Society of Soil Science & Pacific Regional Society of Soil Science; Congrès 2016: 30e anniversaire de l’Association Québécoise de Spécialistes en Sciences du Sol). The results of Chapter VII was presented at the Annual Meeting of The American Society of Agronomy, Crop Science Society of America, and Soil Science Society of America held in November 2016.
1
Chapter I Phosphorus cycle in agroeco-systems and conservation
agriculture: General Introduction
Phosphorus (P) is an essential element for plants, animals and humans. It is a key element in fundamental biochemical reactions involving genetic material (DNA and RNA) and energy transfer (ATP), and in the structural support for membranes (phospholipids) and bones (the biomineral hydroxyapatite) (Ruttenberg 2003). In agriculture, P is the second most important element for crop growth after nitrogen (N). Until P deficiency is corrected many crops do not respond to nitrogen (Kirkby and Johnston 2008). Most crops contain 0.2-0.5% of P in their dry matter where available P is in sufficient amount in the soil.
While P is the 11th most abundant element in the Earth’s crust, it is unevenly distributed. According to the US Geological Survey DATABASE, the P resource (phosphate rocks) is concentrated in five countries (Morocco, China, Algeria, Syria and Jordan) with 85-90% of the world reserves. Many arable soils over the world (30-40%) are low in phosphorus (Kirkby and Johnston 2008). In intensive agriculture, soil P can be supplied by P fertilizers. Inorganic P fertilizers became available 160 years ago by producing superphosphate from phosphate rock (Kirkby and Johnston 2008). But phosphate rocks is a non-renewable resource while the demande for P fertilizers increases by 2.2% per year (FAO: World fertilizer trends and outlook to 2018). The limited reserve of phosphorus rock may be exhausted within the next 50-100 years (Cordell et al. 2009). It is necessary to improve P-use efficiency in agroecosystems.
The P cycle in agro-ecosystems comprises soil P stocks and various P fluxes (inputs and outputs). In soils, phosphorus could be mainly divided into inorganic and organic forms, which account for 35-70% and 30-65%, respectively, of total P depending on soil types (Shen et al. 2011). The P, directly used by plants, is the phosphate ions (HPO42- and H2PO4-); and it is
strongly constrained by multiple interactions with soil constituents, such as precipitation and adsorption (Hinsinger et al. 2011). Phosphorus fertilization contributes to increase soil P status (Sims et al. 1998). Ulrich (2013) reported that in 2011, 45.89 Mt (in P2O5) of inorganic P
fertilizers were consumed in the world. In addition to inorganic P fertilizers, animal manure, crushed animal bones, human and bird excreta, city waste composts and ash are other P sources (Van Vuuren et al. 2010). For example, Cordell et al. (2009) reported that manure, human excreta and food residues used as alternative P resources accounted to about 15, 3 and 1.2 Mt P year-1, respectively. Crops take phosphate ions in soil solution by diffusion and convection through root system along soil profile. Because of small root interception (in contact with only 1-2% of soil) (Baligar 1985) and small diffusion coefficient of phosphate ions in soil (1 x 10⁻⁸ to 10-10 cm2 s-1) (Barber 1995), crop roots have to modify their morphology and structure or enhance biochemical activitity in the rhizosphere to explore and mobilize soil P under plant P deficiency (Hinsinger et al. 2011; Richardson et al. 2011).
On the other hand, over-fertilization or inapproriate fertilization increase the risk of P loss through erosion, runoff and leaching. Soil erosion takes place in ploughed fields as well as pastures. Jørgensen (2010) reported that the world soil erosion from agriculture areas (including cropland and pasture) reaches to 72.9 Gt yr-1 and gives P losses at 19.3 and 17.2 Mt P yr-1 for cropland and pasture, respectively. The world total phosphate fertilizer application can roughly lead to a loss of 0.5 Mt P yr-1 in surface runoff. Because of the high P-fixation capacity of many mineral soils, the losses caused by vertical P transport (leaching) are often assumed to be minor (Makris et al. 2006).
Soil tillage is another factor to affect P losses and soil P management. Conventional tillage contributes to suppress weeds, incorporate fertilizers and eliminate soil compaction, but also leads to soil structure degradation, soil erosion, moisture loss and disruption of soil lifecycle. Conventional tillage also requires high energy. For both environmental and economic benefits, the concept of conservation agriculture was introduced by Food and Agriculture Organization in 2001 and developed during the recent 15 years. Conservation agriculture is based on three principles: 1. Minimum mechanical soil disturbance to maintain minerals within the soil,
2 mitigating erosion and water loss; 2. Permanent soil cover to promote biological activities and improve the soil structure; 3. Crop rotations with more than two species to control disease and provide potential savings of nutrients, especially with legumes.
To implement the conservation agriculture, no-till or reduced tillage practices are conducted to achieve the first two principles, which reduce soil disturbance during planting operations and leave greater amounts of plant residues on the soil surface. According to Natural Resources Conservation Service of USDA (U.S. Department of Agriculture), reduced tillage systems comprise zone tillage, no-till, ridge-till, mulch-till, reduced-till and strip-till. Reduced (or simplified) tillage systems vary in working depth, soil turnover and mixture, working surface, and soil cover rate (Schubetzer et al. 2007).
No-till (NT) system is specific with no soil turnover or mixture. No-till system was adopted on 125M ha of arable soil over the world, about 9% of total arable soil (Pittelkow et al. 2015b). No-till covered 13.5 M ha of soil in Canada in 2007-2008, ranking the 4th in world (Derpsch and Friedrich 2009). In comparison, the proportion of the agricultural area in France in 2011 was 2% under NT and 33% under simplified tillage practices (Fiche Référence d’ADEME 2015). No-till systems reduce soil erosion and soil preparation labours and costs. Kisic et al. (2002) reported that no-till practice could reduce runoff and soil erosion loss from 171.7 mm and 114.4 t ha-1 to 60.7 mm and 12.2 t ha-1 in a 30-cm tilled soil under three crops [maize (Zea mays L.), soybean (Glycine hispida L.) and winter wheat (Triticum aestivum L.)] grown on a 9% slope soil in Croatia. In addition, in a cereal system, the time for traction of machines could be reduced from 7 h ha-1 with tillage to 4 h ha-1 using NT (Rieu 2001). Tebrügge (2001) reported that the implantation costs per 100 ha were 50 € ha-1 with NT method compared to 210 € ha-1 for tillage methods. However, NT could also reduce crop yields (Kumar et al.
2012; Guan et al. 2014). One of the reasons is the severer weed competition in NT. With less soil disturbance, NT system provides a relatively stable soil environment and greater soil biodiversity (Helgason et al. 2010; Scopel et al. 2013) including weed development (Melander et al. 2013; Nichols et al. 2015; Pakeman et al. 2015). This would, thus, increase the cost of weeding and pesticides in NT (Gilet 2001).
Moreover, NT system alters soil properties. Firstly, soil structure in NT is improved as shown by higher proportions of macro-aggregates (Messiga et al. 2011) and macro-pores (Dal Ferro et al. 2014). In the absence of soil loosening, soil compaction develops in NT leading to higher soil bulk density (Javeed et al. 2013) and penetration resistance (Fernández et al. 2015). These soil physical alterations limit crop root proliferation (Chassot et al. 2001; Qin et al. 2006), and consequently the water and nutrient uptake along soil profile. Secondly, nutrients are exported through harvest while nutrients from crop residues left on the soil surface could be recycled through decomposition, leading to preferential accumulation of nutrients in upper layers and nutrient stratification in NT (Bouthier and Labreuche, 2011). When the nutritive element is less mobile in soils, the stratification would be more evident, especially phosphorus. For example, Lupwayi et al. (2006) reported 3.5 times greater available P concentration (bicarbonate-extractable P) in the 0-5 cm soil layer than in the 5-15 cm layer in NT, similar to other studies (Franzluebbers and Hons 1996; Schwab et al. 2006; Costa et al. 2010; Messiga et al. 2010; Calegari et al. 2013). High heterogeneity of soil nutrients under NT influences rooting patterns because roots tend to explore high-nutrient zones (Li et al. 2012). Due to effects of NT system on soil properties and the distribution of P and roots, soil P cycle models for conventional tillage (Morel et al. 2014; Messiga et al. 2015) must be revisited
The general objective of our research is to identify and quantify the main factors affecting P cycle under conventional tillage and no-till systems. The approaches comprise the following steps:
1. A long-term (24-25 years) field experiments in a corn-soybean rotation system where the design comprises four blocks, two tillage practices (conventional tillage and no-till) and three P fertilization rates (0, 17.5 and 35 kg P ha-1 applied every two years on the corn phase).