Saliva as a
first-line diagnostic tool: A spectral challenge for identification
of cancer biomarkers
Czes
ława Paluszkiewicz
a, Ewa Pi
ęta
a,⁎
, Monika Wo
źniak
a, Natalia Piergies
a, Anna Koniewska
b,
Wojciech
Ścierski
b, Maciej Misio
łek
b, Wojciech M. Kwiatek
aa
Institute of Nuclear Physics Polish Academy of Sciences, PL-31342 Krakow, Poland
b
Medical University of Silesia, Department of Otorhinolaryngology and Oncological Laryngology, PL-41800 Zabrze, Poland
a b s t r a c t
a r t i c l e i n f o
Article history:
Received 15 October 2019
Received in revised form 5 March 2020 Accepted 20 March 2020
Available online 21 March 2020 Keywords:
Attenuated total reflection Fourier-transform infrared spectroscopy (ATR-FTIR)
Real-time polymerase chain reaction (RT-PCR) Saliva biomarkers
Tumor mixus (TM) Salivary gland tumor
The paper concentrates on the role of saliva in the early diagnosis of salivary gland tumor. Due to the still not fully understood etiology of head and neck cancer, the fundamental objective of this study is tofind tumor markers of salivary gland tumor progression. This work demonstrates the feasibility of Attenuated Total Reflection Fourier Transform Infrared spectroscopy (ATR-FTIR) to track spectral variations between saliva samples derived from healthy volunteers and from salivary gland tumor (tumor mixus, TM) patients. Furthermore, a Real-Time Poly-merase Chain Reaction (RT-PCR) has been used to detect a selected genes expression associated with neoplasm changes.
The obtained results imply that spectral signals attributed to the amide I/II (secondary structure of protein), car-bohydrates and inorganic phosphates oscillations are the most sensitive to alterations associated with the sali-vary gland cancer progression. Several spectroscopic biomarkers have been indicated as potential predictors of salivary gland tumor development. Additionally, the RT-PCR results reveal the increased level of Bcl-2 factor in salivary gland tumor patients' samples which may be related to inhibition of apoptosis process and increasing un-controlled cell proliferation. Such combination of physico-chemical methods is a unique approach towards better understanding the tumor's etiology and early diagnosis problem. Based on the promisingfindings presented in this article, it could be concluded that salivafluid has a great potential to be used as a first-line diagnostic tool in patients with suspicion of salivary gland tumor.
© 2020 Elsevier B.V. All rights reserved.
1. Introduction
Neoplasm is still the most common disease of civilization and repre-sents one of the main causes of the morbidity and mortality worldwide. The effective treatment of neoplasm is associated with the proper choice of therapy, but it also depends on the early diagnosis. One of the most difficult type of tumor, especially due to the problematic loca-tion is a head and neck neoplasm [1].
The biomolecular achievements of the neoplastic process have helped in understanding of this tumor mechanism and an early detec-tion greatly increases the chances for successful treatment [2]. A searching for new biomarkers can contribute to early detection of this disease [3]. In our study, we put a special attention on the salivary glands disorders. Salivary gland tumors comprise approximately 3 to 10% of all head and neck neoplasms and the global incidence is esti-mated on 0.4 to 13.5 per 100,000 persons annually [4]. Most of these neoplasms are mixed tumors and are localized in parotid glands [5,6].
Multiple authors [7–9] emphasize a significant diagnostic role of ul-trasonographic investigations (USG) in patients with parotid tumors. The procedure allows for precise evaluation of lesions in the parotid su-perficial lobe while assessment of the deep lobe appears much more dif-ficult. The USG allows for tumor localization within the gland, evaluation of it size and preliminary histology. The literature often as-sumes such procedure as a diagnostic standard [10].
Histological evaluation of a tumor is possible due to thefine needle aspiration (FNA) biopsy, which is commonly carried out on every pa-tient with a parotid tumor for the further diagnosis. The risk of the tumor spread in tissues passed through by the needle is low, however FNA is associated with the risk of multiple false negative results [2]. For instance, in the case of small tumors some of the morphological changes can be diagnosis as benign lesions, where there is a malignant lesion or alterations may be completely invisible [11].
Moreover, FNA can lead to some other defects. Firstly, it provides a lot of stress and patients discomfort. Secondly, there are often incom-patibilities between pre- and postoperative histological examinations, which depend only on the pathologist's experience [12]. Finally, biopsy involves a high-cost and time-consuming procedure, therefore we
⁎ Corresponding author.
E-mail address:ewa.pieta@ifj.edu.pl(E. Pięta).
https://doi.org/10.1016/j.molliq.2020.112961
0167-7322/© 2020 Elsevier B.V. All rights reserved.
Contents lists available atScienceDirect
Journal of Molecular Liquids
j o u r n a l h o m e p a g e :w w w . e l s e v i e r . c o m / l o c a t e / m o l l i qpostulate tofind a better solution for analysis, which can be used for non-invasive monitoring of tumors development. A good direction seems to be using biochemical substances contained in bodyfluids such as saliva. The early diagnosis is the basis for effective treatment of head and neck tumor and what is more, a proper cure may facilitate the patient's return to social activity and reduce the chance of the recur-rence. One of the non-invasive and rapid method related with salivary gland disorders is a detection of salivary contents. In the recent several years, there has been a growing interest in application of saliva to bio-medical research [13]. This bodyfluid plays an important role as a factor responses for maintaining homeostasis in the oral cavity. Except diges-tive and protecdiges-tive functions, the salivaryfluid contains a lot of signifi-cant factors which may help to predict many of diseases progression. The main components of saliva is a water, but otherwise, it contains also numerous of proteins, lipids, carbohydrates, ions and vitamins [14]. The most useful biomarkers contained in saliva for biomedical di-agnosis are mucins, enzymes, immunoglobulins, hormones and other factors such as EGF - an epidermal growth factor which plays an impor-tant role in the process of carcinogenesis [15,16].
It seems interesting to measure a number of proteins, lipids or en-zymes contained in salivaryfluid as biomarkers of tumors. Moreover, the genetic material such as DNA can be detected in saliva as well [17]. Therefore, the analysis of proteins structure and gene expression may be a good way to predict the early neoplasm changes on the prote-omic and genetic level. Due to the rich content, saliva is functionally equivalent to blood, but what is important, it is a non-infectiousfluid in contrast to blood. Moreover, saliva has even more advantages such as long durability, high bioavailability and cost-effectiveness [18]. The abovementioned biomarkers contained in saliva may provide an impor-tant information about many diseases including tumors, thus saliva seems to be very useful in reflecting the physiological state of the body. Collecting of saliva is a non-invasive technique with easy storage, simple procedures of preparation, and most importantly, comfortable for the patients.
The etiology of head and neck tumors remains still not fully under-stood. Thus, the main target of this research was tofind tumor markers of salivary gland tumor based on the analysis of conformational changes of proteins, lipids and DNA by FTIR spectroscopy, which has a number of medical applications [19–30]. FTIR spectroscopy has the potential to provide information about changes occurring during cancer develop-ment but also brings new challenges connected with impledevelop-mentation of this method in the clinical environment [21]. Nonetheless, applica-tion and development of this method for medical purposes may be cru-cial for prevention and treatment processes.
In this work, we discuss spectral alterations between saliva samples derived from healthy volunteers and from salivary gland tumor pa-tients. Additionally, we used a real - time polymerase chain reaction (RT-PCR), a biomolecular technique to detect a selected genes expres-sion associated with neoplasm changes. Tumor cells may be dependent on Bcl-2 gene, which is an antiapoptotic factor, in order to survive. In re-sponse to stress signals, malignant cells may express pro-apoptotic acti-vators, but usually cancer cells overexpress Bcl-2, which can decreases this pro-apoptotic response. Therefore, the measurement of this impor-tant factor seems to be imporimpor-tant in the analysis of early diagnosis of neoplastic changes.
The combination of proposed physico-chemical methods allowed to get an interdisciplinary view on the tumor's etiology and early diagnosis problem.
2. Material and methods 2.1. Saliva samples preparation
The investigated group includedfive healthy volunteers (control group) andfive patients diagnosed with salivary gland tumor (tumor mixus, TM). All of salivary samples were freshly obtained in the
morning. The patients and volunteers were required not to consume any meals or drinks 8 h prior to saliva collection and rinse their mouth only by water. Then, about 15 ml of whole saliva and internal cheeks swab from the oral cavity were collected into the sterile tubes. Subse-quently, all materials were frozen at−20 °C until analysis time. Shortly before measurement, salivary samples were thawed and centrifuged to obtain the sediment for Real-time PCR analysis or liquid supernatant for spectroscopic measurement. In ATR-FTIR method, the salivary samples were additionally dried on optical slides.
2.2. ATR-FTIR measurements
ATR-FTIR spectra of saliva samples were recorded using the Nicolet iS5 spectrometer with a iD5 ZnSe ATR accessory (Thermo Scientific). The deuterated triglycine sulfate (DTGS) detector was applied to regis-ter spectral signal in the range from 4000 cm−1to 700 cm−1. An appro-priate measurement procedure was established before a series of measurement. Namely, 20μl of fresh saliva fluid was deposited onto the ATR crystal and allowed to dry at room temperature. The number of scans was 64, and the spectral resolution was 4 cm−1. The spectra were recorded three times for each freshly prepared sample and were averaged to yield a single spectrum per patient. The spectra were nor-malized to the amide I band (~1647 cm−1). No smoothing procedure was used to improve visual quality of any spectra presented.
2.2.1. Data reduction and treatment schemes
Graphical interpretation, data reduction of the recorded spectra were performed using OMNIC 9.0 software product. The curve-fitting analysis (a Gaussian band shape) and the second derivatives (Savitzky-Golay, 7 points) were carried out using the OMNIC 9.0 software.
2.3. Real-time PCR study
The level of Bcl-2 gene expression, an antiapoptotic factor which is strongly related with proliferation process was measured in saliva sam-ples of patients with salivary gland tumor (tumor mixus) and control volunteers. The analyses were performed in stages as follow.
2.3.1. RNA isolation
The total RNA was extracted from fresh salivary samples in spin col-umns with lysis buffers by RNeasy Mini Kit (Qiagen, Netherlands) ac-cording to the manufacturer's instructions. The quantity (ng/μl) and quality of RNA (1.8–2.0) was determined by Spark 10 M spectropho-tometer (Tecan, Switzerland) at 260 and 280 wavelength.
2.3.2. Reverse transcription
Next step was applied with Precision nanoScript kit (PrimerDesign, UK) in 0.2 ml PCR tubes with 50 ng of RNA template and other reagents. Each sample was submitted to the annealing step in 65 °C for 5 min in thermocycler (Bio-rad, USA) and then incubated 20 min in 42 °C and 10 min in 75 °C for extension stage.
2.3.3. Real-time PCR
Thefinal step was performed by Precision PLUS qPCR protocol (PrimerDesign, UK) using Master MIX SYBR Green (10μl), forward and reverse primers (per 0.25μM), cDNA template (25 ng) and RNAse/DNAse free water (up to 20μl). The temperature-time condi-tions of the reaction were determined as follows: 2 min in 95 °C for en-zyme activation, then denaturation in 95 °C for 10 s and 1 min in 60 °C for primers annealing.
2.3.4. Analysis
The relative expression of Bcl-2 gene was quantified using the com-parative threshold cycle (ΔΔCT) after normalizing to reference gene
(GAPDH) by 2-ΔΔCTLivak's method. All experiments were performed in triplicates.
3. Results and discussion 3.1. ATR-FTIR study
Fig. 1shows the ATR-FTIR spectra of saliva sample: (a) control (spec-trum averaged fromfive healthy volunteers samples), and salivary gland tumor (tumor mixus, TM) patients: (b) M70TM1, (c) K39TM2, (d) K45TM3, (e) K48TM4, and (f) M40TM5 (M– man, W – woman). As is evident from the spectra, there are significant changes in bands po-sitions and relative intensities, which may be associated with the devel-opment of a tumor. Nevertheless, there are a lot of overlapping bands in thefingerprint region, especially in the 900–1200 cm−1and amide I and II spectral regions. Therefore, the curve-fitting analysis of these areas is necessary for more conclusive band assignments (please seeFig. 2a– d). Furthermore, for a better comparison of the spectral alterations be-tween control group and patients diagnosed with cancer, the average spectra were imposed on each other (Fig. 2e).Table 1lists the most characteristic ATR-FTIR bands together with suggested band assign-ments for averaged spectra of control (healthy volunteers) and salivary gland tumor patients. The vibrational analysis was based on the latest literature reports and databases on the application of FTIR spectroscopy in biological studies with particular emphasis on saliva analysis [31–48]. The high frequency range is dominated by bands assigned to protein and lipid constituents [31,32]. Briefly, peaks observed at the spectral in-terval between 3600 and 3000 cm−1originate from C–H, O–H and N–H
stretching modes of proteins, while strong band at ~3286 cm−1is attrib-uted to amide A N–H stretching [33]. Another spectral feature appearing at ~3073 cm−1is due to amide Bν(NH)/ν(CH) vibrations in proteins (α-amylase, albumin, cystains, mucins, proline-rich proteins, sIgA) [33–35]. On the other hand, the spectral region 3000–2800 cm−1is rich in bands ascribed to symmetric and asymmetric CH2and CH3stretching oscilla-tions of lipids [33,36–38].
It has to be noted that the most evident alterations occur in the re-gion between ~900 and 1300 cm−1. Nonetheless, some of bands in the fingerprint region may overlap. This spectral interval is regarded as a highly diagnostic region in studying various cancer types [33,35–44,49–57]. Band arising at ~1078 cm−1is related to the asym-metric and symasym-metric PO2−stretching from symmetric PO2−stretching from inorganic phosphates [58] and phosphate group of phospholipids [48]. It was proved that this spectral feature is associated with the role of phosphates during diseases [50]. Thus, remarkable increase in ~1074 cm−1band intensity in the spectrum of TM in relation to the spectrum of control group may be correlated with the disease develop-ment (Fig. 2e) [50,54,55]. This band is especially pronounced in the case of TM spectra. Moreover, a noticeable displacement of the band position (from 1078 cm−1in control group to 1074 cm−1for patients with sali-vary gland tumor) confirms the participation of phosphates upon the investigated disease development [50]. Apart from the aforementioned bands, vibration come from phosphate group is manifested in the spec-tra at ~1159, 1239 and 985, and 936 cm−1[58]. Heise and Marbarch [48] have thoroughly studied human oral mucosa tissue from several pa-tients under changing blood glucose concentrations by ATR-FTIR spec-troscopy. Interestingly, the obtained FTIR spectra of saliva dryfilm and
Wavenumber/cm
-1Ab
so
rb
an
ce
(a) control (b) M70TM1 (c) W39TM2 (d) W45TM3 (e) W48TM4 (f) M40TM5Fig. 1. ATR-FTIR spectra of saliva samples: (a) control (spectrum averaged fromfive healthy volunteers samples), and salivary gland tumor (tumor mixus, TM) patients: (b) M70TM1, (c) K39TM2, (d) K45TM3, (e) K48TM4, and (f) M40TM5. M– man, W – woman.
saliva difference spectrum received after subtraction of a scaled phos-phate buffer spectrum revealed significant contribution of inorganic phosphate features on the spectral patterns [48].
Furthermore, peaks observed within the 1000 to 1200 cm−1interval may also be attributed to the C–O stretching vibrations from carbohy-drates. Consequently, bands at ~1021, 1040 and 1078 cm−1originate from sugar moieties [41,44,48]. Nevertheless, due to the fact that most of the salivary proteins are glycosylated, these peaks can be attributed to glycosylatedα-amylase, mucins or other sugar residues vibrations [44,48,59–61]. It is also worth pointing out that ~1119 cm−1spectral signal due to theν(C–O) and ν(C–O–C) of carbohydrates vibrations in TM spectrum exhibits significant enhancement in comparison to the non-cancerous spectrum [28,33]. The discussed oscillations are regarded as spectral biomarkers to distinguish between normal from cancer states [62], while the 1119 cm−1peak is considered as a spectro-scopic marker of salivary gland tumor [53]. Most of these motions reveal noticeable strengthened upon disease development (Figs. 1 and 2e). These results are consistent with other studies which have shown that FTIR spectroscopy can be successfully employed to distinguish normal from cancer states, especially considering the spectral interval between 800 and 1300 cm−1[53,57,62,63].
There are also significant alterations in secondary structure of pro-teins (Fig. 1) between ATR-FTIR spectrum of control and salivary gland tumor patients. It must be noted that theα-helix maximum peak frequency decreased for the TM spectrum (1634–1640 cm−1;
Fig. 1b-f) in comparison to the spectrum of control group (1644 cm−1;
Fig. 1a). Simultaneously, the β-sheet maximum band frequency (1543 cm−1;Fig. 1a) increased for the salivary gland tumor patients (Fig. 1b-d), except in the case of M40TM5 (Fig. 1f) [33–39,44]. It is con-sistent with literature and may results from variations in the extent of
intermolecular hydrogen bond inα-helical and β-sheet structures [64]. Furthermore, the most intense band appearing at 1648 cm−1 at-tributed toν(C=O), (CN) and δ(NH) vibrations from α-helix upon deconvolution split into two additional bands at 1664 and 1641 cm−1 due to the disordered structure-solvated [νs(C=O)] and unordered structure [ν(C=O)], respectively (Fig. 2c and d). Another observation concerns the content ofα-helical conformation, which decreased no-ticeably for TM patients (Fig. 2c and d;Table 1). This may be related to the formation ofβ-sheet structure [65]. It is also worth noting that the relative intensity of 1631 cm−1band due to theβ-sheet structure [ν(C=O)/ν(C=C)] significantly decrease upon cancer development. Conversely, the composition of 1615 cm−1spectral signal ascribed to theβ-sheet formation [ν(C=C)] increased considerably for TM spectral data [33–39,44]. It has also be noted that peaks arising at ~1403 [νs (COO−),ρb(CH3)] and 1450 cm−1[ρb(CH3)/δ(CH2/CH3)] exhibit higher intensity for the TM patients. Another prominent spectral features assigned to proteins can be observed at 1543 [ρb(NH),ν(CN), amide II], 1515 [trosine ring,α-amylase, albumin, cystains, mucins, proline-rich proteins, sIgA] and 1315 cm−1[ν(CN), ρb(NH), amide III ( α-amy-lase, albumin, cystains, mucins, proline-rich proteins, sIgA)]. Additional FTIR signal, which is absent in the case of the control group spectrum, appears at 1527 cm−1[ρb(NH),ν(C=N), ν(C=C), amide II]. The above observations clearly indicates that the secondary structure of proteins in healthy volunteers samples differ significantly from that in TM pa-tients samples.
3.2. Real-time PCR study
To determinate the anti-apoptotic gene (Bcl-2) expression, a total RNA extraction and then cDNA strand from all of salivary samples
Wavenumber/cm
-1ec
na
br
os
bA
(e) control TM Wavenumber/cm-1 (a) 900 – 1200 cm-1: control ec na br os bA 1078 1040 1021 1120 1163 (b) 900 – 1200 cm-1: TM Wavenumber/cm-1 985 1038 1074 1119 1159 Ab so rb an ce(c) amide I and II – control
Wavenumber/cm-1 Ab so rb an ce 1648 1631 1692 1680 1615 1577 1543 1515 1657 1550 1513 1527 1546 1619 1631 1641 1653 1664 1677 1690 Ab so rb an ce Wavenumber/cm-1 (d) amide I and II – TM
Fig. 2. Curve-fitting analysis of the 900–1200 cm−1spectral interval (a– control group, b – TM patients) and amide I/II with second derivative spectra (c – control group, d – TM patients)
profiles together with (e) averaged ATR-FTIR spectra of saliva samples (black line – control group, red line – TM patients). Spectra were averaged from five healthy volunteers and five salivary gland tumor patients spectra, respectively.
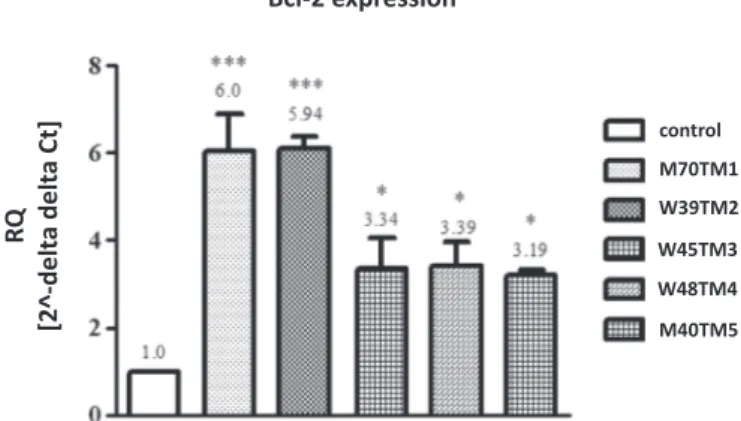
were used as a template for Real-time PCR detection. Our research, based on comparativeΔΔCtanalysis, indicates increased level of Bcl-2 expression in saliva of patients with salivary gland tumor (tumor mixus).Fig. 3shows several times higher relative expression (RQ) of Bcl-2 factor in all of 5 patients samples in compare to the averaged re-sults from 5 healthy volunteers samples (control). The most significant changes were noticed in M70TM1 and K39TM2 cases (6-folds higher expression than control samples), where in all of other samples (K45TM3, K48TM4, and M40TM5) the Bcl-2 gene level was increased approximately 3 times. The presented results illustrate changes
characteristic for tumors development by inhibiting of programmed cells death (apoptosis).
4. Conclusions
From the research that has been carried out it possible to conclude that saliva can be regarded as afirst-line diagnostic tool in patients with suspicion of salivary gland tumor. ATR-FTIR spectroscopy can be successfully applied for distinguishing between control group and sali-vary gland tumor patients. It has been demonstrated that there are sig-nificant changes in secondary structure of proteins upon cancer development. We highlighted spectroscopic biomarkers associated with salivary gland tumor development, in particular bands attributed to proteins, carbohydrates and inorganic phosphates.
Moreover, our biomolecular studies indicated the differences in anti-apoptotic gene expression between patients with salivary gland tumor (tumor mixus) and control volunteers. Increased level of Bcl-2 factor in patients' samples may be related to inhibition of apoptosis process and increasing uncontrolled cell proliferation, which is strongly related to neoplastic development. Therefore, we confirmed that salivary fluid can be very useful and significant tool for early diagnosis based on bio-markers contained in saliva. To summarize, our research may be afirst step for searching modern solutions for early detection of oral tumors based on salivary samples.
CRediT authorship contribution statement
Czesława Paluszkiewicz: Conceptualization, Methodology, Supervi-sion. Ewa Pięta: Investigation, Writing - original draft, Writing - review & editing, Visualization, Formal analysis. Monika Woźniak:
Table 1
Wavenumber and suggested band assignments for averaged ATR-FTIR spectra of control (healthy volunteers) and salivary gland tumor (tumor mixus, TM) patients.a
FTIR bands [cm−1] Band assignment Component identification Reference number
Control TM
3286 3282 νas(NH) Amide A [31–38]
3073 3074 ν(NH)/ν(CH) Amide B/ring (α-amylase, albumin, cystains, mucins, proline-rich proteins, sIgA) [31–38] 2962 2961 νas(CH3) Lipids, protein side chains [31–38]
2936 2935 νas(CH2) Lipids [31–38]
2873 2874 νs(CH3) Lipids, protein side chains [31–38]
2850 2851 νs(CH2) Lipids (cholesterol and mono/diglycerides of fatty acids) [31–38]
1692 1690 ν(C=O), ν(CN), ρb(NH) Amide I: anti-parallelβ-sheet [33–39,44]
1680 1677 ν(C=O) Amide I: unordered random coils and turns [33–39,44] 1664 νs(C=O) Amide I: disordered structure-solvated [33–39,44]
1648 1653 ν(C=O), δ(CN), δ(NH) Amide I:α-helix [33–39,44] 1641 ν(C=O) Amide I: unordered structure [33–39,44] 1631 1631 ν(C=O)/ν(C=C) Amide I:β-sheet structure [33–39,44] 1615 1619 ν(C=C) Amide I:β-sheet structure [33–39,44]
1543 1546 ρb(NH),ν(CN) Amide II [33–39,44]
1527 ρb(NH),ν(C=N), ν(C=C) Amide II [33–39,44]
1515 1513 tyrosine ring Proteins (α-amylase, albumin, cystains, mucins, proline-rich proteins, sIgA) [33–39,44] 1451 1450 ρb(CH3)/δ(CH2/CH3) Proteins/lipids [33,36,38]
1407 1403 νs(COO−) Fatty acids [33,35,38,40]
ρb(CH3) Proteins [33,36,40]
1341 1343 ρw(CH2) Phospholipids, fatty acid, triglyceride, amino acid side chains [33]
1315 1315 ν(CN), ρb(NH) Amide III (α-amylase, albumin, cystains, mucins, proline-rich proteins, sIgA) [33,35,38,40]
1239 1243 νas(PO2−) Phosphate group of phospholipids [33,36,38,48]
νas(PO2−) Inorganic phosphates [28,33,36]
1163 1159 νas(PO2−) Inorganic phosphates [58]
ν(CO), ν(C–O–H) Serine, threonine, tyrosine of proteins [33,35,40] 1120 1119 ν(C–O), ν(C–O–C) Carbohydrates [28,33] 1078 1074 νs(PO2−) Inorganic phosphates [33,48,58]
νs(PO2−),νas(PO−2) Phosphate group of phospholipids [33,35–44,48]
ν(CO), ρb(C–O–H) Glycosylatedα-amylase, mucins or other sugar residues [41,44,48]
1040 1038 ν(CO), ρb(C–O–H) Glycosylatedα-amylase, mucins or other sugar residues [41,44,48]
1021 ν(CO), δ(C–O–H) Glycosylatedα-amylase, mucins or other sugar residues [41,44,48]
975 985 ν(PO2−) Inorganic phosphates [58]
924 936 ν(PO2−) Inorganic phosphates [58]
δ(COH), δ(COC) Carbohydrates [33,40]
νas(CH3–N) Phospholipids [33,40]
a
Abbreviations:ν, stretching; δ, deformation; ρb, bending; as, asymmetric; s, symmetric.
control W48TM4 M40TM5 M70TM1 W39TM2 W45TM3
Bcl-2 expression
RQ
[2^-delt
a delt
a Ct]
Fig. 3. Relative expression of antiapoptotic factor Bcl-2 in saliva of patients with salivary gland tumor vs control volunteers. One-way ANOVA analysis followed by the Newman-Keuls post hoc test. Statistical significance was assessed using GraphPad Prism 5.0 software and P valueb0.005 was considered statistically significant.
Investigation, Visualization, Writing - original draft. Natalia Piergies: Investigation, Visualization. Anna Koniewska: Resources. Wojciech Ścierski: Resources, Funding acquisition, Investigation. Maciej Misiołek: Resources, Funding acquisition. Wojciech M. Kwiatek: Supervision.
Declaration of competing interest
The authors have no conflict of interests to declare. Acknowledgments
This study was partially supported by the statuary research of Med-ical University of Silesia in Katowice, Poland, project No. KNW-1-159/N/ 8/K/2018. The study was performed using equipment purchased in the frame of the project co–funded by the Małopolska Regional Operational Program Measure 5.1 Krakow Metropolitan Area as an important hub of the European Research Area for 2007–2013, project No. MRPO.05.01.00–12–013/15. The authors acknowledge Ms. Jolanta Adamczyk for her invaluable assistance with the measurements. References
[1] M. Guzzo, L.D. Locati, F.J. Prott, G. Gatta, M. McGurk, L. Licitra, Major and minor sal-ivary gland tumors, Crit. Rev. Oncol. Hematol. 74 (2010) 134–148.
[2] K. Awan, S. Patil, S. Islam, M. Jafer, Early detection of oral cancer– guidelines for den-tal practitioners, J. Int. Oral Health 8 (2016) 399–403.
[3] K. Dahiya, R. Dhankhar, Updated overview of current biomarkers in head and neck carcinoma, World J. Methodol. 6 (1) (2016) 77–86.
[4] I. Schwentner, P. Obrist, W. Thumfart, G. Sprinzl, Distant metastasis of parotid gland tumors, Acta Otolaryngol. 126 (2006) 340–345.
[5] N. Sadeghi, S. Al-Dhahri, J.J. Manoukian, Transnasal endoscopic medial maxillectomy for inverting papilloma, Laryngoscope 113 (2003) 749–753.
[6] W.S. Kim, D.W. Hyun, C.H. Kim, J.H. Yoon, Treatment outcomes of sinonasal inverted papillomas according to surgical approaches, Acta Otolaryngol. 130 (2010) 493–497.
[7] H. Alphs, D. Eisele, W. Westra, The role offine needle aspiration in the evaluation of parotid masses, Curr Opin Otolaryngol Head Neck Surg (2) (2006) 62–66.
[8] E. Matsuda, T. Fukuhara, R. Donishi, K. Kawamoto, Y. Hirooka, H. Takeuchi, Useful-ness of a novel ultrasonographic classification based on anechoic area patterns for differentiating Warthin Tumors from pleomorphic adenomas of the parotid gland, Yonago Acta Med 60 (2018) 220–226.
[9] L. Luczewski, P. Golusinski, J. Pazdrowski, P. Pienkowski, M. Kordylewska, W. Golusinski, The ultrasound examination in assessment of parotid gland tumours: the novel graphic diagram, Eur. Arch. Otorhinolaryngol. 270 (2013) 2129–2133.
[10]M. Sahin, I. Tatar, A. Kurt, et al., Importance of sonoelastography in assessing non-thyroid neck masses, Turk. Arch. Otorhinolaryngol. 55 (2017) 10–16.
[11] K. Gajjar, A. Ahmadzai, G. Valasoulis, J. Trevisan, C. Founta, M. Nasioutziki, A. Loufopoulos, M. Kyrgiou, S. Stasinou, P. Karakitsos, E. Paraskevaidis, B. Da Gama-Rose, P. Martin-Hirsch, F. Martin, Histology verification demonstrates that biospectroscopy analysis of cervical cytology identifies underlying disease more ac-curately than conventional screening: removing the confounder of discordance, PLoS One 9 (2014), e82416-e82416.
[12] M. Jandu, K. Webster, The role of operator experience in thefine needle aspiration cytology of head and neck masses, Int. J. Oral Maxillofac. Surg. 28 (1999) 441–444.
[13] C. Miller, J. Foley, A. Bailey, C. Campell, R. Humphries, N. Christodoulides, P. Floriano, G. Simmons, B. Bhagwandin, J. Jacobson, S. Redding, J. Ebersole, J. McDevitt, Current developments in salivary diagnostics, Biomark. Med 4 (1) (2010) 171–189.
[14] T. Pfaffe, J. Cooper-White, P. Beyerlein, K. Kostner, C. Punyadeera, Diagnostic poten-tial of saliva: current state and future applications, Clin. Chem. 57 (5) (2011) 675–687.
[15]K.E. Kaczor-Urbanowicz, F. Wei, S.L. Rao, J. Kim, H. Shin, J. Cheng, M. Tu, D.T.W. Wong, Y. Kim, Clinical validity of saliva and novel technology for cancer detection, BBA– Rev. Cancer 1872 (2019) 49–59.
[16] X. Wang, K.E. Kaczor-Urbanowicz, D.T.W. Wong, Salivary biomarkers in cancer de-tection, Med. Oncol. 34 (2017) 1–12.
[17] R. Pink, J. Simek, J. Vondrakova, E. Faber, P. Michl, J. Pazdera, K. Indrak, Saliva as a di-agnostic medium, Biomed. Pap. Med. 153 (2) (2009) 103–110.
[18] Y. Lee, D. Wong, Saliva: an emerging biofluid for early detection of diseases, Am. J. Dent. 22 (4) (2009) 241–248.
[19]L. Lovergne, G. Clemens, V. Untereiner, R.A. Lukaszweski, G.D. Sockalingum, M.J. Baker, Investigating optimum sample preparation for infrared spectroscopic serum diagnostics, Anal. Meth. 7 (2015) 7140–7149.
[20] J.M. Cameron, H.J. Butler, D.S. Palmer, M.J. Baker, Biofluid spectroscopic disease diag-nostics: a review on the processes and spectral impact of drying, J. Biophotonics 11 (2018), e201700299.
[21] M.J. Baker, H.J. Byrne, J. Chalmers, P. Gardner, R. Goodacre, A. Henderson, S.G. Kazarian, F.L. Martin, J. Moger, N. Stone, J. Sule-Suso, Clinical applications of infrared
and Raman spectroscopy: state of play and future challenges, Analyst 143 (2018) 1735–1757.
[22] J. Wang, M. Sowa, H.H. Mantsch, A. Bittner, H.M. Heise, Comparison of different in-frared measurement techniques in the clinical analysis of biofluids, TRAC-Trend. Anal. Chem. 75 (1996) 286–296.
[23]J. Ollesch, S.L. Drees, H.M. Heise, T. Behrens, T. Bruning, K. Gerwert, FTIR spectros-copy of biofluids revisited: an automated approach to spectral biomarker identifica-tion, Analyst 138 (2013) 4092–4102.
[24]A.L. Mitchell, K.B. Gajjar, G. Theophilou, F.L. Martin, P.L. Martin-Hirsch, Vibrational spectroscopy of biofluids for disease screening or diagnosis: translation from the laboratory to a clinical setting, J. Biophotonics 7 (2014) 153–165.
[25] C. Hughes, M. Brown, G. Clemens, A. Henderson, G. Monjardez, N.W. Clarke, P. Gardner, Assessing the challenges of Fourier transform infrared spectroscopic anal-ysis of blood serum, J. Biophotonics 7 (2014) 180–188.
[26] F.L. Martin, J.G. Kelly, V. Llabjani, P.L. Martin-Hirsch, I.I. Patel, J. Trevisan, N.J. Fullwood, M.J. Walsh, Distinguishing cell types or populations based on the compu-tational analysis of their infrared spectra, Nat. Protoc. 5 (2010) 1748–1760.
[27] M.J. Baker, J. Trevisan, P. Bassan, R. Bhargava, H.J. Butler, K.M. Dorling, P.R. Fielden, S.W. Fogarty, N.J. Fullwood, K.A. Heys, C. Hughes, P. Lasch, P.L. Martin-Hirsch, B. Obinaju, G.D. Sockalingum, J. Sulé-Suso, R.J. Strong, M.J. Walsh, B.R. Wood, P. Gardner, F.L. Martin, Using Fourier transform IR spectroscopy to analyze biological materials, Nat. Protoc. 9 (2014) 1771–1791.
[28] M.J. Baker, S.R. Hussain, L. Lovergne, V. Untereiner, C. Hughes, R.A. Lukaszewski, G. Thiefin, G.D. Sockalingum, Developing and understanding biofluid vibrational spec-troscopy: a critical review, Chem. Soc. Rev. 45 (2016) 1803–1818.
[29] F. Bonnier, H. Blasco, C. Wasselet, G. Brachet, R. Respaud, L.F.C.S. Carvalho, D. Bertrand, M.J. Baker, H.J. Byrne, I. Chourpa, Ultra-filtration of human serum for im-proved quantitative analysis of low molecular weight biomarkers using ATR-IR spectroscopy, Analyst 142 (2017) 1285–1298.
[30] H.J. Butler, B.R. Smith, R. Fritzsch, P. Radhakrishnan, D.S. Palmer, M.J. Baker, Optimised spectral pre-processing for discrimination of biofluids via ATR-FTIR spec-troscopy, Analyst 143 (2018) 6121–6134.
[31] C. Petibois, G. Cazorla, A. Cassaigne, A. Perromat, G. Deleris, Plasma protein contents determined by Fourier-transform infrared spectrometry, Clinical Chem 47 (2001) 730–738.
[32] G. Deleris, C. Petibois, Application of FT-IR spectrometry to plasma contents analysis and monitoring, Vib. Spectrosc. 32 (2003) 129–136.
[33] Z. Movasaghi, S. Rehman, I. ur Rehman, Fourier transform infrared (FTIR) spectros-copy of biological tissues, Appl. Spectrosc. Rev. 43 (2008) 134–179.
[34]A. Barth, Infrared spectroscopy of proteins, Biochim. Biophys. Acta 1767 (2007) 1073–1101.
[35] S. Abbas, N.S. Ozek, S. Emri, D. Koksal, M. Severcan, F. Severcan, Diagnosis of malig-nant pleural mesothelioma from pleuralfluid by Fourier transform-infrared spec-troscopy coupled with chemometrics, J. Biomed. Opt. 23 (2018), 105003.
[36]G. Bellisola, C. Sorio, Infrared spectroscopy and microscopy in cancer research and diagnosis, Am. J. Cancer Res. 2 (2012) 1–21.
[37]R.R. Sultana, S.N. Zafarullah, N.H. Kirubamani, Saliva signature of normal pregnant women in each trimester as analyzed by FTIR spectroscopy, Indian J. Sci. Technol. 4 (2011) 481–486.
[38] P.C. Caetano Jr., J.F. Strixino, L. Raniero, Analysis of saliva by Fourier transform infra-red spectroscopy for diagnosis of physiological stress in athletes, Res. Biomed. Eng. 31 (2015) 116–124.
[39] L.M. Rodrigues, T.D. Magrini Alva, H. da Silva Martinho, J.D. Almeida, Analysis of sa-liva composition in patients with burning mouth syndrome (BMS) by FTIR spectros-copy, Vib. Spectrosc. 100 (2019) 195–201.
[40]R.P.C.B. Rodrigues, E.M.G. Aguiar, L. Cardoso-Sousa, D.C. Caixeta, C.C.F.V. Guedes, W.L. Siqueira, Y.C. Paiva Maia, S.V. Cardoso, R.N. Sabino-Silva, Differential molecular signature of human saliva using ATR-FTIR spectroscopy for chronic kidney disease diagnosis, Braz. Dent. J. 30 (2019) 437–445.
[41] L.V. Bel'skaya, E.A. Sarf, N.A. Makarova, Use of Fourier transform IR spectroscopy for the study of saliva composition, J. Appl. Spectrosc. 85 (2018) 445–451.
[42] L.V. Bel'skaya, E.A. Sarf, I.A. Gundyrev, Study of the IR spectra of the saliva of cancer patients, composition, J. Appl. Spectrosc. 85 (2019) 1076–1084.
[43] B.H. Stuart, Biological applications, Infrared Spectroscopy: Fundamentals and Appli-cations, John Wiley & Sons, Ltd 2005, pp. 137–165 , (ISBN 9780470011140).
[44] C.M. Orphanou, The detection and discrimination of human bodyfluids, using ATR FT-IR spectroscopy, Forensic Sci. Int. 252 (2015) e10–e16.
[45] D. Naumann, H. Fabian, P. Lasch, FTIR spectroscopy of cells, tissues and bodyfluids, Adv. Biomed. Spectrosc. 2 (2009) 312–354.
[46]C.E. Christersson, L. Lindh, T. Arnebrant, Film-forming properties and viscosities of saliva substitutes and human whole saliva, Eur. J. Oral Sci. 108 (2000) 418–425.
[47] C. Petibois, K. Gionnet, M. Goncalves, A. Perromat, M. Moenner, G. Deleris, Ana-lytical performances of FT-IR spectrometry and imaging for concentration mea-surements within biologicalfluids, cells, and tissues, Analyst 131 (2006) 640–647.
[48]H.M. Heise, R. Marbach, Human oral mucosa studies with varying blood glucose concentration by non-invasive ATR-FT-IR-Spectroscopy, Cell. Mol. Biol. 44 (1998) 899–912.
[49] S. Argov, J. Ramesh, A. Salman, J. Goldstein, I. Sinelnikov, H. Guterman, S. Mordechai, Inflammatory bowel diseases as an intermediate stage between normal and cancer: a FTIR-microspectroscopy approach, J. Biomed Optics 7 (2002) 1–7.
[50] S. Argov, R.K. Sahu, E. Bernshtain, A. Salman, G. Shohat, U. Zelig, S. Mordechai, Inflamatory bowel diseases as an intermediate stage between normal and cancer: a FTIR-microspectroscopy approach, Biopolymers 75 (2004) 384–392.
[51]D.C. Malins, N.L. Polissar, S.J. Gunselman, Models of DNA structure achieve almost perfect discrimination between normal prostate, benign prostatic hyperplasia
(BPH), and adenocarcinoma and have a high potential for predicting BPH and prostatecancer, Proc. Natl. Acad. Sci. U. S. A. 94 (1997) 259–264.
[52]D.C. Malins, P.M. Johnson, E.A. Barker, N.L. Polissar, T.M. Wheeler, K.M. Anderson, Cancer-related changes in prostate DNA as men age and early identification of me-tastasis in primary prostate tumors, Proc. Natl. Acad. Sci. U. S. A. 100 (2003) 5401–5406.
[53] C. Petibois, G. Deleris, Chemical mapping of tumor progression by FT-IR imaging: to-wards molecular histopathology, Trends Biotechnol. 24 (2006) 455–462.
[54] E. Giorgini, P. Balercia, C. Conti, P. Ferraris, S. Sabbatini, C. Rubini, G. Tosi, Insights on diagnosis of oral cavity pathologies by infrared spectroscopy: a review, J. Mol. Struct. 1051 (2013) 226–232.
[55] S. Sabbatini, C. Conti, C. Rubini, V. Librando, G. Tosi, E. Giorgini, Infrared microspectroscopy of oral squamous cell carcinoma: spectral signatures of cancer grading, Vib. Spectrosc. 68 (2013) 196–203.
[56] E. Lipiec, J. Kowalska, J. Lekki, A. Wiecheć, W.M. Kwiatek, FTIR microspectroscopy in studies of DNA damage induced by proton microbeam in single PC-3 cells, Acta Phys. Pol. A 121 (2011) 506–509.
[57] G.I. Dovbeshko, V.I. Chegel, N.Y. Gridina, O.P. Repnytska, Y.M. Shirshov, V.P. Tryndiak, I.M. Todor, G.I. Solyanik, Surface enhanced IR absorption of nucleic acids from tumor cells: FTIR reflectance study, Biopolymers 67 (6) (2002) 470–486.
[58] H.M. Heise, L. Cocchieri, T. Vahlsing, D. Ihrig, J. Elm, Monitoring of interstitial buffer systems using micro-dialysis and infrared spectrometry, Proc. SPIE 10072 (2017), 100720E–1–100720E–14.
[59] A. Borg, D. Birkhed, Secretion of glucose in human parotid saliva after carbohydrate intake, Scand. J. Dent. Res. 96 (1988) 551–556.
[60] M. Khajehpour, J.L. Dashnau, J.M. Vanderkooi, Infrared spectroscopy used to evalu-ate glycosylation of proteins, Anal. Biochem. 348 (2006) 40–48.
[61] P.D.V. de Almeida, A.M.T. Grégio, M.Â.N. Machado, A.A.S. de Lima, L.R. Azevedo, Sa-liva composition and functions: a comprehensive review, J. Contemp. Dent. Pract. 9 (2008) 072–080.
[62] W. Yang, X. Xiao, J. Tan, Q. Cai, In situ evaluation of breast cancer cell growth with 3D ATR-FTIR spectroscopy, Vib. Spectrosc. 49 (2009) 64–67.
[63] D.C. Malins, V.M. Green, T.M. Wheeler, E.A. Barker, M.A. Vinson, M. Sayeeduddin, K.E. Hellstrom, K.M. Anderson, Metastatic cancer DNA phenotype identified in normal tissues surrounding metastasizing prostate carcinomas, Proc. Natl. Acad. Sci. U. S. A. 101 (2004) 11428–11431.
[64] R. Eckel, H. Huo, H.W. Guan, X. Hu, X. Che, W.D. Huang, Characteristic infrared spec-troscopic patterns in the protein bands of human breast cancer tissue, Vib. Spectrosc. 27 (2001) 165–173.
[65] Y. Kim, C.A. Rose, Y. Liu, Y. Ozaki, G. Datta, A.T. Tu, FTIR and near-infrared FT-Raman studies of the secondary structure of insulinotropin in the solid state:α-helix to β-sheet conversion induced by phenol and/or high shear force, J. Pharm. Sci. 83 (1994) 1175–1180.