HAL Id: hal-00840106
https://hal.archives-ouvertes.fr/hal-00840106
Submitted on 1 Jul 2013HAL is a multi-disciplinary open access archive for the deposit and dissemination of sci-entific research documents, whether they are pub-lished or not. The documents may come from teaching and research institutions in France or abroad, or from public or private research centers.
L’archive ouverte pluridisciplinaire HAL, est destinée au dépôt et à la diffusion de documents scientifiques de niveau recherche, publiés ou non, émanant des établissements d’enseignement et de recherche français ou étrangers, des laboratoires publics ou privés.
In situ reduction and evaluation of anode supported
single chamber solid oxide fuel cells
Damien Rembelski, Mathilde Rieu, Lionel Combemale, Jean-Paul Viricelle
To cite this version:
Damien Rembelski, Mathilde Rieu, Lionel Combemale, Jean-Paul Viricelle. In situ reduction and evaluation of anode supported single chamber solid oxide fuel cells. Journal of Power Sources, Elsevier, 2013, 242 (15), pp.811-816. �10.1016/j.jpowsour.2013.05.118�. �hal-00840106�
In situ reduction and evaluation of anode supported single chamber
solid oxide fuel cells
D. Rembelski a, M. Rieu a,*, L. Combemale b, J.P. Viricelle a
a
Ecole Nationale Supérieure des Mines, SPIN-EMSE, CNRS:UMR5307, LGF,
F-42023 Saint-Etienne / France
b
Laboratoire Interdisciplinaire Carnot de Bourgogne
9 avenue Alain Savary
FR-21078 Dijon / France
*
Corresponding author: M. Rieu
Tel.: +33 4 77 42 02 82; Fax: +33 4 77 49 96 94
Abstract
Single chamber anode-supported fuel cells are investigated under several
methane-oxygen-nitrogen atmospheres at intermediate temperatures (500°C-700°C). Ce0.9Gd0.1O1.95 (CGO) is
chosen as electrolyte and deposited by screen-printing onto NiO-CGO anode pellets. A cathode
composed of 70wt% La0.6Sr0.4Co0.2Fe0.8O3-δ (LSCF) and 30wt% of CGO is screen-printed onto
the electrolyte. Thermogravimetric analyses of anode reduction are performed at 700°C. Carbon
deposition is observed under diluted methane but a successful reduction is obtained after an
initialization under diluted methane followed by a final treatment under methane-to-oxygen ratio
(Rmix) of 2. Anode-supported fuel cells are investigated regarding the working temperature and
Rmix. Two types of cells are prepared with modifications of the electrolyte microstructure. For
both cells tested, the Open Circuit Voltage (OCV), the power density and the fuel utilization
increase when Rmix and temperature decrease. The electrolytes of both cells have a porous
microstructure and the electrolyte of the second cell, with the highest thickness, brings better
performances. At 600°C for Rmix=0.6, the maximum power density is improved from 60 for the
first cell to 160 mW cm-2 for the second cell. Comparing the fuel utilization, it increases from 3%
1. Introduction
Single Chamber Solid Oxide Fuel Cells (SC-SOFC) is an innovative kind of SOFC which have
mostly been developed during the past decade [1-4]. Contrary to conventional SOFCs,
SC-SOFCs work in an atmosphere where the fuel and the oxygen are mixed; this configuration
allows a more flexible geometry without any needed sealing. Hydrocarbons are generally used
instead of hydrogen because of a smaller flammability area. The working principle is based on
the difference of catalytic activity between cathode and anode: the anode must be selective to the
partial oxidation of hydrocarbons while the cathode must be selective to the reduction of oxygen.
Methane which is the most common fuel used in SC-SOFC is chosen for this study. Therefore,
the main reactions which can occur are reactions I, II III and IV at the anode side and reaction V
at the cathode side. Volume methane to oxygen ratio is noted Rmix in this paper.
½CH4 + O2 1 H2O + ½CO2 total combustion of CH4 (Rmix=0.5) (reaction I)
2CH4 + O2 1 4H2 + 2CO partial combustion of CH4 (Rmix=2) (reaction II)
H2 + O2- 1 H2O + 2e- electrochemical oxidation of hydrogen (reaction III)
CO + O2- 1 CO2 + 2e- electrochemical oxidation of carbon monoxide (reaction IV)
O2 + 4e- 1 2O2- electrochemical reduction of oxygen (reaction V)
Concerning the combustions of methane, only partial combustion (reaction II) is suitable for
SC-SOFC efficiency by producing hydrogen contrary to total combustion (reaction I). However,
other reactions can lead to hydrogen production such as water gas shift (reaction VI) and
CO + H2O 1 CO2 + H2 water gas shift (reaction VI)
CH4 1 C + 2H2 methane cracking (reaction VII)
CH4 + H2O 1 CO + 3H2 steam reforming (reaction VIII)
CH4 + CO2 1 2CO + 2H2 dry reforming (reaction IX)
For intermediate temperatures range (500-700°C), doped ceria with samarium (SDC) or
gadolinium (CGO) seems to be the most promising electrolyte with an ionic conductivity of
0.025 S cm-1 for Ce0.9Gd0.1O1.95 composition at 600°C [5].
The frequently used material for the anode is a cermet made of nickel and electrolyte material.
Indeed, the nickel is a good catalyst for the partial combustion of methane (reaction II).
The cathode material of a SC-SOFC should not catalyze any combustion of methane and must be
stable under a partially reducing atmosphere. Our previous study has shown that
La0.6Sr0.4Co0.2Fe0.8O3-δ (LSCF) offers a good compromise between stability and low catalytic
activity toward oxidation of hydrocarbons [6].
Concerning the various geometries of SC-SOFC, the most promising geometry is
anode-supported cells. At this time, the best performances are obtained for anode-anode-supported cell with a
maximum power density of 1500 mW cm-2 [7]. To obtain this performance, Shao et al. worked
with a bilayer electrolyte of YSZ (Yttria Stabilized Zirconia, 5µm) and SDC (5µm). Also, Suzuki
et al. [8] obtained a performance of 660 mW cm-2 with an electrolyte made by screen-printing
with YSZ. Even if a porous electrolyte is allowed in case of SC-SOFC since it has no more
tightening role, they reported that the open circuit voltage (OCV) is lower than in the case of a
Furthermore, an important working parameter for SC-SOFC is methane-to-oxygen ratio (Rmix);
the value of Rmix which brings the best power density is not clearly defined in literature.
Thermodynamically, Rmix has to be between 0.5 and 2, which corresponds to the stoichiometric
ratio of the total (reaction I) and the partial (reaction II) combustions of methane respectively [3].
According to the modeling of Hao and Goodwin, the best power density is obtained for Rmix
equal to 1.67 [9]. But experimentally, an increase of power density is observed when Rmix
increases to 2 for some authors [10-11], or when Rmix decreases to 1 for other authors [12-13].
These various behaviors are mainly due to the differences of the geometrical configuration.
Another major challenge for SC-SOFC is the optimization of their efficiency and particularly the
fuel utilization. At present, the highest value of fuel utilization reported is 11% [13] which is
strongly dependent on running parameters (gas flow rate, Rmix, temperature) and bench test
geometry.
The first objective of this study is to set an in situ reduction protocol of the anode (NiO-CGO)
without carbon deposition and without degradation of the cathode. Since papers report different
reduction methods, there is not clear trend for successful anode reduction without degradation of
the others cell components (i.e. electrolyte and cathode). Akhtar et al. [13] and Zhang et al. [14]
reduced in situ the anode under pure methane, under working atmosphere or under hydrogen. The
reduction under H2 was the fastest but cathode degradation could occur. Zhang et al. [14] studied
also an ex situ reduction of the anode before cathode processing that leads to the best
performances but implies more steps in the preparation process.
The second objective of this work is to optimize the power density and the fuel efficiency of
anode supported fuel cells. As the performances of SC-SOFC are influenced by the temperature
and Rmix, the performances of a first cell are investigated for a furnace temperature from 600°C
microstructure is investigated at 600°C for each Rmix with a second cell prepared with a thicker
electrolyte.
2. Experimental
2.1. Materials and cells preparation
For the SC-SOFC preparation, commercial powders are used in this study. CGO, acquired from
Fuel Cell Materials, is used for the electrolyte. The cathode is made of LSCF from Fuel Cell
Materials and for the anode, NiO powder from Sigma-Aldrich is used.
The anode powder is a mixture of NiO (60wt%) and CGO (40wt%) which have been mixed in a
ball mill for 5 minutes in order to homogenize the powders and break agglomerates. This powder
is then pressed at 120 MPa and annealed at 1200°C during 2 hours to obtained anode pellets. The
resulting anode pellets are 20 mm in diameter and 1 mm in thickness.
The electrolyte inks are prepared by mixing CGO powder with a binder (ESL V400, 0.5 g per
gram of powder) and a solvent (ESL T404). Two ratios of solvent are used, 0.26 g per gram of
powder for the first ink (ink 1) and 0.15 g per gram of powder for the second ink (ink 2). Inks are
then homogenized and desagglomerated in a rolling mill. Five layers of electrolyte ink are
screen-printed on the whole surface of the previous anode with a drying step at 120°C for each layer.
The cell is firstly annealed at 1200°C during 6 hours and at 1400°C during 4 hours for the final
annealing.
The cathode ink, with 70wt% LSCF and 30wt% CGO, is prepared by adding binder (0.5 g per
screen-printed on the electrolyte with a smaller surface area (Ø 17mm) than the electrolyte to avoid short
circuit between anode and cathode. The cathode is annealed at 1100°C during 2 hours and finally,
a gold mesh is screen-printed on the cathode with a commercial gold ink (ESL 8880-H) as a
current collector.
2.2. Characterizations
For all the next experiments, in methane/oxygen/nitrogen mixtures, oxygen is set at 10% in order
to avoid the flammability area of methane.
For the study of anode reduction, thermo-gravimetric analyses (TGA) are performed with a
Mettler Toledo device including a differential scanning calorimetry equipment (DSC); the total
gas flow is set at 10 L h-1 for all gas mixture.
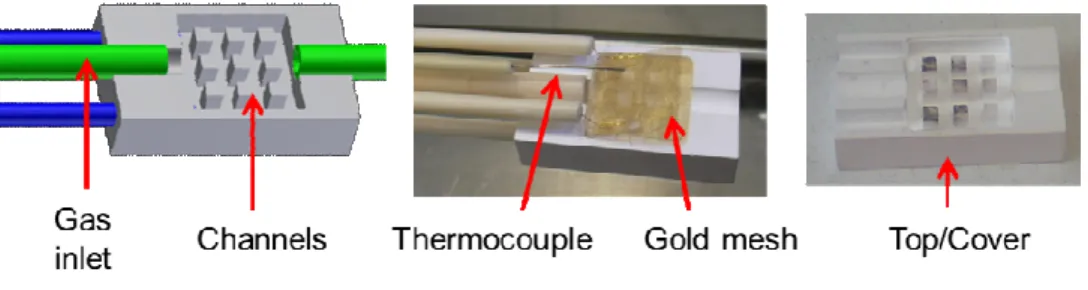
Fuel cell experiments are performed in a quartz tube with a thermocouple placed near the cell.
The experimental setup is similar to the one developed by Morel et al. [15]. The cell is pressed
between two gold meshes in order to performed 4-wires measurements and the gas mixture is
allowed to flow on both sides of the cell through the channels of the sample holder (Fig. 1). A
VersaSTAT3 potentiostat-galvanostat is used for OCV and polarization measurements. The gas
flow is set at 30 L h-1 for fuel cells tests. The power density is calculated with the cathode surface
(2.27 cm²).
Fuel utilization and efficiency of the cells are also calculated [2, 16-17]. Fuel utilization (2(f))
corresponds to current efficiency and is calculated as the current corresponding to the maximum
dt ) dn(CH nF I 2 initial 4 Pmax (f)= 1 1 (Equation 1) with dt ) dn(CH4 initial
: the initial molar flow of methane, F: the Faraday constant and n: the number
of electrons involved in the reaction. For methane, the number of electrons n really implicated is
not clearly defined in literature. The maximum of electrons theoretically produced with the direct
electrochemical oxidation of methane is 8, according to reaction X. This value is chosen for fuel
utilization calculation.
CH4 + 4O2- 1 2H2O + CO2 + 8e- (reaction X)
The efficiency of a cell includes three elements: the thermodynamic efficiency (2(th)), the voltage
efficiency (2(V)) and the fuel utilization (2(f)).
(f) (V) (th)
2
2
2
2
=
×
×
1 1 1 (Equation 2) The thermodynamic efficiency is(T) 3H (T) 3G 2(th) ° °
= and is equal to 1 taking into account reaction I. The voltage efficiency, 2(V), is defined as the ratio of the operating cell voltage under load, U, to
the open circuit voltage.
Microstructures of cells are characterized by a scanning electron microscope (SEM) Jeol JSM
3. Results and discussion
3.1. In situ reduction of the anode
In order to initiate the SC-SOFC after its preparation, the nickel oxide of the anode has to be
reduced in metallic nickel. Hydrogen is used for conventional fuel cells, but for SC-SOFC, as
both electrodes are exposed to the same atmosphere, the cathode can be degraded by this
reducing gas [4]. A reduction of the anode under working condition does not always succeed
[14], and takes very long time when it happens; Akhtar et al. fully reduced the anode after 8
hours under Rmix=2 [13]. They also tested a reduction under pure methane but the anode was
damaged by carbon formation.
Hence, in this study, the reduction of the anode is performed under different atmospheres at
700°C by thermo-gravimetric analyses (TGA) coupled with differential scanning calorimetry
(DSC).
First experiment is carried out under 10% of methane diluted in nitrogen (Fig. 2). A weight loss is
observed during the firsts 13 minutes and is then followed by a weight gain. The initial weight
loss is attributed to the reduction of NiO by methane. A strong decrease of heat flow variation at
the beginning of the experiment is observed. This endothermic phenomenon is due to NiO
reduction by CH4 (reactions XI and XII).
CH4 + NiO 1 Ni + 2H2 + CO ∆H°(700°C) = 213 kJ mol-1 (reaction XI) CH4 + 4NiO 1 4Ni + 2H2O + CO2 ∆H°(700°C) = 139 kJ mol-1 (reaction XII)
Then, heat flow variation increases but stays negative. That can be explained by a decreases of
reduction reactions and/or also by the start of another endothermic reaction: methane cracking
(reaction VII) with an enthalpy change of ∆H°(700°C) = 89 kJ mol-1. Furthermore, the weight never decreases enough to consider complete reduction of nickel oxide (12.85%, dashed red line
in Fig. 2) and even increases from 13 minutes to the end of the experiment. That suggests there is
carbon deposition from methane cracking. After the experiment, the sample has a black color;
typical of carbon.
This first experiment confirms carbon deposition during the reduction of nickel oxide under
methane as reported elsewhere [13-14]. It is also important to notice that, at the very beginning of
the experiment, there are mainly reactions of reduction (reactions XI and XII).
Consequently, in the second experiment of anode reduction, methane is flowed only during the
firsts 3 minutes and then an atmosphere with Rmix=2 (CH4-O2-N2: 20-10-70) is flowed before
methane cracking reaction occurs with carbon deposition. Weight variation and heat flow of this
new anode reduction experiment are reported in Fig. 3. During the first 3 minutes, there is a
weight loss and the heat flow is endothermic, nearly the same as the previous experiment. That
means that reactions of nickel oxide reduction by methane are occurring (reactions XI and XII).
After 3 minutes under methane, the gas mixture Rmix=2 is injected and this brings about a strong
increase of heat flow variation that becomes positive. Exothermic reactions of methane
combustions occur (reaction I, 3H°(700°C) = - 400 kJ mol-1 and reaction II, 3H°(700°C) = - 45
kJ mol-1). Concerning the weight variation, there is a gradual loss until it has reached the
theoretical value of the reduced anode weight. After 15 minutes, the weight is stable and the
is no more variation in weight and heat flow. After the experiment, the sample is grey as metallic
nickel is. This reduction procedure allows to have a fast and complete reduction of the anode
without carbon deposition.
3.2. Characterization of fuel cells
Before each cell measurement, the previous anode reduction procedure is applied. It is checked
that this treatment does not induce cathode degradation. The electrolyte of the first cell is
prepared with ink 1 (as defined in experimental part 2.1) so the corresponding cell is named cell
1. The second, prepared with ink 2 is named cell 2.
3.2.1. Cell 1
The micrograph of the cell 1 is reported in Fig. 4. Electrolyte is porous and is about 25 µm thick.
Interfaces between anode and electrolyte and between electrolyte and cathode are well defined.
LSFC-CGO cathode is 20 µm thick.
Characterization of cell 1 is performed at a furnace temperature from 600°C to 525°C each 25°C.
Tests are not performed below 525°C because of the loss of the OCV due to the lack of catalytic
activity of the cermet anode towards methane oxidation at lower temperature [2]. For each
temperature step, polarization measurements are done for Rmix=1.5, 1, 0.8 and 0.6.
An exothermic effect is observed due to combustion reactions (reactions I and II) so the sample
temperature is higher than the furnace temperature. The temperature difference between sample
5). This exothermic effect depends on temperature and Rmix. 3T slightly increases with the
temperature, but its main variation is with Rmix: 3T increases when Rmix decreases.
Indeed, the total combustion (reaction I) is more exothermic (3H°(700°C) = - 400 kJ mol-1) than
partial combustion (reaction II) (3H°(700°C) = - 45 kJ mol-1), corresponding to Rmix=0.5 and to
Rmix=2 respectively. This may explain the higher exothermic effect when Rmix decreases as it
has already been mentioned by Morel et al. [15]. For next tests, the temperature mentioned for
fuel cell test is the furnace temperature.
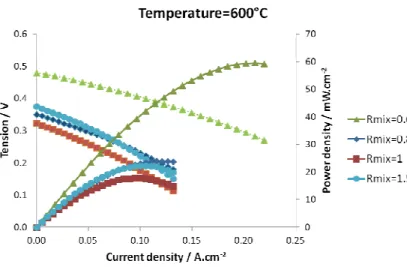
At 600°C, performances of cell 1 operating in different Rmix are presented in Fig. 6. Concerning
OCV, it is lower than SC-SOFC with a dense electrolyte [8] which reaches generally 0.8-0.9V.
Here, the highest OCV, around 0.48V, is obtained for Rmix=0.6. An increase of OCV is noticed
when Rmix decreases, particularly from Rmix=0.8 to Rmix=0.6. Performances follow the same trend
as the OCV and the maximum power density obtained is 60 mW cm-2 for Rmix=0.6 at this
temperature.
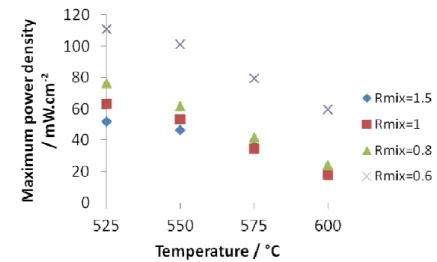
Better performances are obtained by decreasing the temperatures. OCV (Fig. 7) and maximum
power densities (Fig. 8) are reported as function of the temperature for the different Rmix. It’s
noteworthy that OCV values and power densities follow the same variation and increase when
the temperature decreases. The influence of Rmix is the same as previously mentioned, and
mostly when decreasing to Rmix=0.6. The highest OCV value of 0.7 V and the maximum power
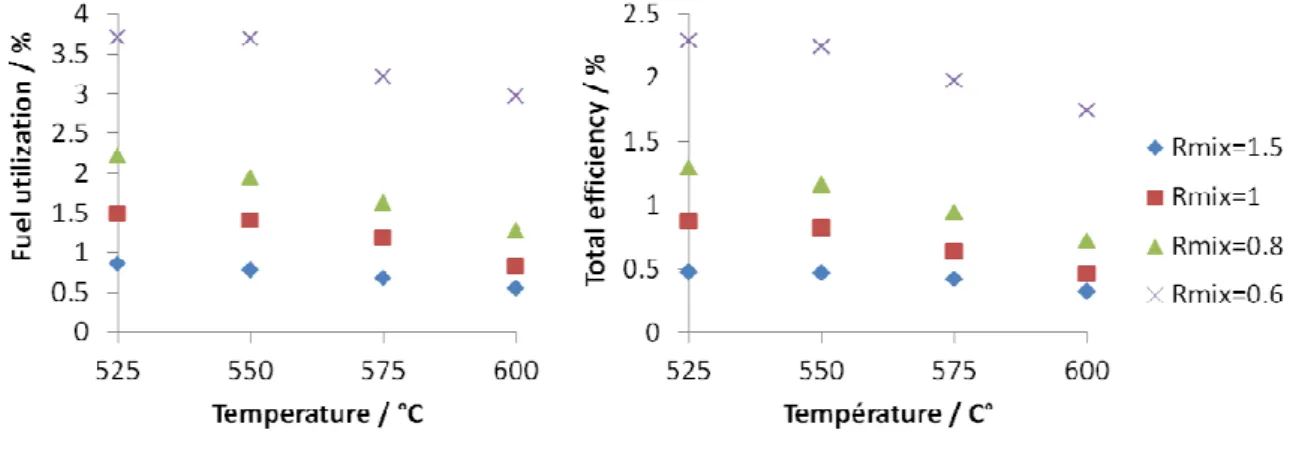
Fuel utilization and efficiency of the cell are then calculated for cell 1 (Fig. 9) according to
equations 1 and 2, respectively. They follow the same trend as power density regarding influence
of temperature and Rmix. However, as fuel utilization and efficiency calculations take into
account performances and initial fuel flow (equation 1), and as here best performances are
obtained when fuel flow is minimal (Rmix=0.6), influence of Rmix is more significant for fuel
utilization and efficiency (Fig. 9) than for power densities (Fig. 8). The highest fuel utilization
and efficiency are obtained for Rmix=0.6 at 525°C and are of 3.7% and 2.3% respectively. These
values are in agreement with other results of SC-SOFC [8, 18].
3.2.2. Cell 2
Cell 2 presents a thicker electrolyte of 50µ m (Fig. 10) compared to cell 1. This is in accordance
with inks preparation. Indeed, ink 2 contains less solvent than ink 1 and so leads to thicker layers.
The fracture between anode and electrolyte that can be seen onto the micrograph of tested cell is
due to an electrical problem (strong over-potential applied) with the measurement equipment that
occurred after the experiment. Cell 2 could only be characterized at 600°C. The results obtained
for cell 2 at different Rmix are presented in Fig. 11. The OCV and the maximum power density
increase when Rmix decreases, like for cell 1. At Rmix=0.6, 160 mW cm-2 are reached. In these
experimental conditions, fuel utilization and efficiency of cell 2 are of 6% and 3.4% respectively.
3.2.3. Discussion and comparison of cells performances
The best performances for the 2 cells are obtained at very low Rmix compared to the results
are obtained with dense electrolyte; in this study electrolytes are porous. According to Suzuki et
al. [8], for a porous electrolyte, diffusion of hydrogen from the anode to the cathode through the
electrolyte pores can occur lowering the oxygen partial pressure at the cathode side and thus
decreasing the OCV. At Rmix=0.6, less methane is flowed so less hydrogen is produced
compared to higher Rmix. This can explained that OCV increases when Rmix is low because of
less hydrogen diffusion.
Comparing the two cells, for the same temperature of 600°C and Rmix=0.6, OCV increases from
0.48V to 0.67V, maximum power density from 60 mW cm-2 to 160 mW cm-2 and fuel utilization
from 3% to 6% respectively for cells 1 and 2. The difference between these cells lies on
thicknesses of the electrolytes, given that both are porous. Cell 2, which presents the best
performances, has a thicker electrolyte. This is not the expected trend for conventional cells in
regard of ohmic drop in electrolyte. It seems that the higher the thickness of electrolyte is, the
lower the diffusion of hydrogen is. This is in agreement with the OCV value of cells. So the
ohmic drop due to electrolyte thickness is compensated here by hydrogen diffusion limitation.
4. Conclusion
Anode supported single chamber SOFC are investigated regarding the in situ reduction of the
anode and the cells behavior versus temperature and Rmix for different electrolyte
microstructures.
First, a study of anode reduction by thermogravimetric analyses leads to a fast and efficient route
deposition is obtained at 700°C after a treatment of 3 minutes in diluted methane atmosphere
followed by Rmix=2 atmosphere during 12 minutes.
Then characterizations of cells in single chamber atmosphere are performed. Influences of
temperature and Rmix atmosphere are evaluated. OCV and maximum power density increase
when temperature and Rmix decrease. This is related to the porous microstructure of the
electrolyte. In this case, the diffusion of hydrogen from the anode side to the cathode side is
possible through the pores of the electrolyte. At low methane gas flow (low Rmix) and at low
temperature, this diffusion is limited and thus OCV is increased. The cell with a thicker
electrolyte follows the same behavior versus Rmix but the OCV is greatly higher. This OCV
improvement seems due to higher thickness of electrolyte which slows down the diffusion of
hydrogen between the two electrodes. Furthermore, this second cell showed a maximum power
density of 160 mW cm-2 at 600°C for Rmix=0.6 with a fuel utilization of 6%. Fuel utilization is
even more improved because the maximum power density is obtained at the lowest fuel flow.
For both experimented cells, OCV seems to be the predominant parameter to enhance the cell
performances. A better densification of the electrolyte should improve the OCV and then the
maximum power density.
Acknowledgments
The authors thank ADEME (French Environment and Energy Management Agency) for financial
References
[1] M. Yano, A. Tomita, M. Sano, T. Hibino, Solid State Ion. 177 (2007) 3351-3359.
[2] M. Kuhn, T. W. Napporn, Energies 3 (2010) 57-134.
[3] B. Buergler, A. Grundy, L. Gauckler, J. Electrochem. Soc. 153 (2006) A1378–A1385.
[4] J.-P. Viricelle, S. Udroiu, G. Gadacz, M. Pijolat, C. Pijolat, Fuel Cells 10 (2010)
683-692.
[5] B. Steele, Solid State Ion. 129 (2000) 95-110.
[6] D. Rembelski, J. P. Viricelle, L. Combemale, M. Rieu, Fuel Cells 12 (2012)1256-264.
[7] Z. Shao, C. Zhang, W. Wang, C. Su, W. Zhou, Z. Zhu, H. J. Park, C. Kwak, Angew.
Chem. Int. Ed. 50 (2011) 1792-1797.
[8] T. Suzuki, P. Jasinski, V. Petrovsky, H. Anderson, F. Dogan, J. Electrochem. Soc. 152
(2005) A527-A531.
[9] Y. Hao, D. G. Goodwin, J. Electrochem. Soc. 154 (2007) B207–B217.
[10] X. Jacques-Bédard, T. W. Napporn, R. Roberge, M. Meunier, J. Power Sources 153
(2006) 108-113.
[11] X. Zhu, Z. Lue, B. Wei, Y. Zhang, X. Huang, W. Su, Int. J. Hydrog. Energy 35 (2010)
6897-6904.
[12] T. Hibino, A. Hashimoto, M. Yano, M. Suzuki, S. Yoshida, M. Sano, J. Electrochem.
Soc. 149 (2002) A133-A136.
[13] N. Akhtar, S. P. Decent, D. Loghin, K. Kendall, J. Power Sources 193 (2009) 39-48.
[14] C. Zhang, Y. Zheng, R. Ran, Z. Shao, W. Jin, N. Xu, J. Ahn, J. Power Sources 179
[15] B. Morel, R. Roberge, S. Savoie, T. W. Napporn, M. Meunier, J. Power Sources 186
(2009) 89-95.
[16] N.Q. Minh, T. Takahashi, Science and Technology of Ceramic Fuel Cells, Elsevier
Science Ltd., New York, 1995, pp 15-40.
[17] EG&G Technical Services Inc., Fuel Cell Handbook, seventh ed., U.S. Department of
Energy, West Virginia, 2004.
[18] T. Suzuki, P. Jasinski, V. Petrovsky, H. Anderson, F. Dogan, J. Electrochem. Soc. 151
Figure captions
Fig. 1: Diagram and pictures of the sample holder of the experimental setup for electrical
measurements
Fig. 2: Weight variation (TGA) and heat flow (DSC) of the anode under 10% of CH4 in nitrogen
at 700°C (dashed line corresponds to the theoretical weight loss of the anode if the reduction of
NiO is total: 12.85%)
Fig. 3: Weight variation (TGA) and heat flow (DSC) of the anode under 10% of CH4 in nitrogen
during 3 minutes and then under Rmix=2 at 700°C (dashed line is the theoretical weight % of the
anode if the reduction of NiO is complete)
Fig. 4: Micrograph of the cell 1 (anode: Ni-CGO, electrolyte: CGO (25µ m thick), cathode
LSCF-CGO)
Fig. 5: Exothermic effect (3T = Tsample - Tfurnace) during cell 1 measurement for each Rmix
Fig. 6: Polarization curves of cell 1 at 600°C for each Rmix
Fig. 7: OCV of cell 1 versus temperature for each Rmix
Fig. 9: Fuel utilization (left) and efficiency (right) of cell 1 versus temperature for each Rmix
Fig. 10: Micrograph of the cell 2 (anode: Ni-CGO, electrolyte: CGO (50µ m thick), cathode
LSCF-CGO)
1 1
Fig. 1: Diagram and pictures of the sample holder of the experimental setup for electrical
measurements
1
Fig. 2: Weight variation (TGA) and heat flow (DSC) of the anode under 10% of CH4 in nitrogen at 700°C (dashed line corresponds to the theoretical weight loss of the anode if the reduction of NiO is total: 12.85%)
1
Fig. 3: Weight variation (TGA) and heat flow (DSC) of the anode under 10% of CH4 in nitrogen during 3 minutes and then under Rmix=2 at 700°C (dashed line is the theoretical weight % of the anode if the reduction of NiO is complete)
Fig. 4: Micrograph of the cell 1 (anode: Ni-CGO, electrolyte: CGO (25µ m thick), cathode LSCF-CGO)
Fig. 5: Exothermic effect (3T = Tsample - Tfurnace) during cell 1 measurement for each Rmix
Fig. 7: OCV of cell 1 versus temperature for each Rmix
Fig. 9:1Fuel utilization (left) and efficiency (right) of cell 1 versus temperature for each Rmix
Fig. 10: Micrograph of the cell 2 (anode: Ni-CGO, electrolyte: CGO (50µ m thick), cathode LSCF-CGO)