Neonatal low-protein diet reduces the masticatory ef
ficiency in rats
Kelli N. Ferraz-Pereira
1, Raquel da Silva Aragão
1, Dorly Verdier
3, Ana E. Toscano
1, Diego C. Lacerda
4,
Raul Manhães-de-Castro
1* and Arlette Kolta
2,31Graduate Program in Nutrition, Physical Activity and Phenotypic Plasticity, CAV, Federal University of Pernambuco, 55608-680 Recife, Pernambuco, Brazil
2Faculté de Médecine Dentaire and FRQS Network for Oral and Bone Health Research, Université de Montréal, Montréal, QC, H3C 3J7, Canada
3Département de Neurosciences and Groupe de Recherche sur le système Nerveux Central, Université de Montréal, Montréal, QC, H3C 3J7, Canada
4Graduate Program in Physical Therapy, Federal University of Pernambuco, 55608-680 Recife, Pernambuco, Brazil
(Submitted 24 February 2015– Final revision received 27 June 2015 – Accepted 16 July 2015 – First published online 4 September 2015)
Abstract
Little is known about the effects of undernutrition on the specific muscles and neuronal circuits involved in mastication. The aim of this study was to document the effects of neonatal low-protein diet on masticatory efficiency. Newborn rats whose mothers were fed 17 % (nourished (N), n 60) or 8 % (undernourished (U), n 56) protein were compared. Their weight was monitored and their masticatory jaw movements were video-recorded. Whole-cell patch-clamp recordings were performed in brainstem slice preparations to investigate the intrinsic membrane properties and N-methyl-D
-aspartate-induced bursting characteristics of the rhythmogenic neurons (N, n 43; U, n 39) within the trigeminal main sensory nucleus (NVsnpr). Morphometric analysis (N, n 4; U, n 5) were conducted on masseteric muscles serial cross-sections. Our results showed that undernourished animals had lower numbers of masticatory sequences (P= 0·049) and cycles (P = 0·045) and slower chewing frequencies (P = 0·004) (N, n 32; U, n 28). Undernutrition reduced body weight but had little effect on many basic NVsnpr neuronal electrophysiological parameters. It did, however, affect sag potentials (P< 0·001) and rebound firing (P = 0·005) that influence firing pattern. Undernutrition delayed the appearance of bursting and reduced the propensity to burst (P= 0·002), as well as the bursting frequency (P = 0·032). Undernourished animals showed increased and reduced proportions of fibre type IIA (P < 0·0001) and IIB (P < 0·0001), respectively. In addition, their fibre areas (IIA, P < 0·001; IIB, P < 0·001) and perimeters (IIA, P< 0·001; IIB, P < 0·001) were smaller. The changes observed at the behavioural, neuronal and muscular levels suggest that undernutrition reduces chewing efficiency by slowing, weakening and delaying maturation of the masticatory muscles and the associated neuronal circuitry.
Key words:Undernutrition: Masticatory efficiency: Masseter muscle: Trigeminal nucleus
Chewing is one of the essential functions of the oral cavity, given that it breaks the food eaten to promote digestion. The maturation of this motor function occurs during a critical period of development of the central nervous system concomitant with the morphological and functional maturation of the craniofacial complex(1,2). During this period, changes in food intake pat-terns are also observed(1). Initially, the mammalian newborns acquire all the necessary nutrients for survival through suckling movements. However, in mature mammals, suckling gives rise to mastication. In rats, the first chewing movements are observed around the 12th postnatal day, and mature chewing is established at about 18–21 d(1)
.
The circuits controlling the basic pattern of jaw movements during mastication are confined within a small region of the brainstem defined rostrally by the trigeminal motor nucleus
and caudally by the facial nucleus (NVII)(3–5). This area includes the trigeminal main sensory nucleus (NVsnpr), the dorsal part of which is thought to be involved in the control of the masticatory rhythm(6). It receives stimuli from the cortical masticatory area and from the trigeminal sensory afferents, and its neurons project directly to the Vth, VIIth and XIIth motor nuclei(6–8), which control the major muscle groups involved in chewing and other oral motor behaviours. About one-third of the neu-rons in the dorsal NVsnpr fire rhythmically in phase with the trigeminal motoneurons during fictive mastication(6), and the expression of c-fos protein increases in these neurons after induction of several bouts offictive mastication(9).
Membrane properties of neurons located in the dorsal part of the NVsnpr undergo changes in thefirst 3 weeks of postnatal life(10), precisely the period in which the transition from
* Corresponding author: R. Manhães-de-Castro, fax +55 81 2126 8473, email [email protected]
Abbreviations: AP, action potential; GABA,γ-aminobutyric acid; INaP, sodium persistent current; N, nourished; NMDA,N-methyl-D-aspartate; NVsnpr, trigeminal main sensory nucleus; RB, regular bursts; U, undernourished.
suckling to chewing behaviour occurs(1). During this phase, there is also a change in the neuronal firing pattern(10). Immature cells tend to adapt quickly, and the ability to fire repeatedly appears during thefirst 2 weeks of postnatal life(10). The incidence of rhythmic bursts is rare or absent before the 12th postnatal day – the age at which the first masticatory movements appear– but increases gradually in the following week to stabilise at about 18 d of age(10).
Moreover, before birth and during the early postnatal life, the skeletal muscles also undergo rapid changes in the composition of their contractile, regulatory and energetic systems(11). The most important modifications observed in masticatory muscles occur after birth(12) when the pattern of food intake changes from suction for chewing. During this period, the number of fast fibre type (type IIB) increases to rapidly adapt to these functional changes(12)and other daily activities(13).
Proper nutrition is essential for normal growth and develop-ment of different organs and body systems(14). Thus, early undernutrition may induce lasting or permanent consequences in different structures and functions of the body(15,16). Studies report that prenatal and/or postnatal undernutrition in rats can influence brain growth(17), feeding behaviour(18), the mechan-ical properties of skeletal muscles and locomotor activity(19). Studies of the muscles of the locomotor system have shown that neonatal undernutrition can irreversibly damage the muscle structure(20), and reduce cell multiplication and the number of musclefibres and nuclei in the offspring(19–21). In relation to the masticatory system, experimental studies suggest that perinatal undernutrition results in delayed craniofacial maturation and changes in the size of the jaws and of their biomechanical properties(22,23). Also observed are changes in teeth, including delayed tooth eruption, size and morphology, as well as increased susceptibility to decay(24). However, there are no reports in the literature regarding the masticatory muscles.
Thus, the present study aimed to analyse the effects of neonatal low-protein diet on the masticatory efficiency in rats, through (1) the behavioural assessment of mandibular move-ments during mastication; (2) the electrophysiological analysis of intrinsic membrane properties andfiring patterns of neurons in the dorsal part of NVsnpr; and (3) the analysis of the pro-portion offibre types of the superficial masseter muscle, as well as the area and perimeter of eachfibre type. Our hypothesis is that offspring of mothers fed a low-protein diet during the period of lactation have reduced chewing efficiency, being evidenced by the reduction in the amount of mandibular movements performed during mastication, together with changes in thefiring patterns of neurons in the dorsal NVsnpr and morphological modifications of the superficial bundles of the masseter muscle.
Methods
Animals and nutritional manipulation
All surgical and experimental procedures conformed to guide-lines of the Canadian Institutes of Health Research and were approved by the University Animal Care and Use Committee (protocol number: 10–165) and the Committee of Ethics in
Animal Experimentation of the Federal University of Pernam-buco (protocol number: 23076.001483/2010-61).
A total of twenty-three albino female rats were divided randomly into two experimental groups according to the diet they were subjected to during the lactation period (nourished (N), n 13 and undernourished (U), n 10). Within 24 h of birth, litters were adjusted to eight male newborns from mothers that were chosen at random. The rats were divided into two groups. The N group (n 104) consisted of thirteen litters with eight newborn males whose mothers were fed 17 % protein (AIN-93G(25)), whereas the U group (n 80) consisted of ten litters with eight newborn males whose mothers were fed 8 % protein (see Table 1 for diet composition). Animals of the different experimental groups (N and U) used for behavioural, electrophysiological and morphological analyses were randomly distributed. Eleven litters were used for the analysis of chewing mandibular movements and muscle phenotype, from which seven litters were attributed randomly to the N group, whereas the four remaining litters were attributed randomly to the U group. Twelve litters were selected randomly for the electrophysiological experiments and equally distributed between both experimental groups. The calculation of sample size was based on a power test of 90 %; 0·05 significance level; maximum deviation of 0·2 (20 %); and 0·5 (50 %) expected difference between the groups(26).
The animals were kept in a controlled environment with a temperature of 23 (SEM 1) °C and a constant cycle of light
(6.00–18.00 hours) and darkness (18.00–6.00 hours). After weaning (22 d of age), the animals had free access tofiltered water and standard animal chow (Labina), containing 23 % protein.
Offspring body weight
The animals were weighed on a digital electronic scale (Marte AS 1000C). Body weight of animals was measured at P3, 8, 14, 15, 16, 17, 18, 19, 20 and 21 d of age during lactation.
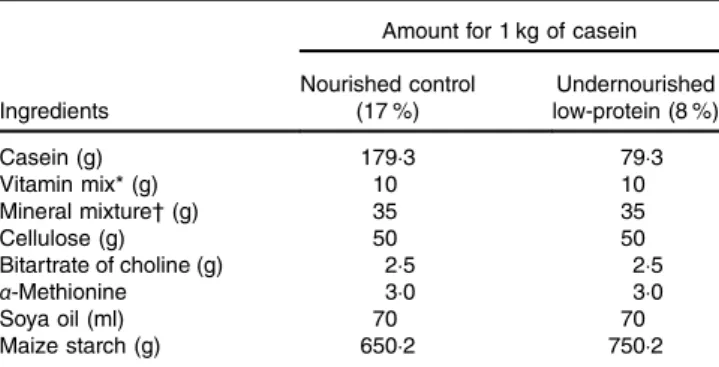
Table 1. Diet composition
Amount for 1 kg of casein
Ingredients Nourished control (17 %) Undernourished low-protein (8 %) Casein (g) 179·3 79·3 Vitamin mix* (g) 10 10 Mineral mixture† (g) 35 35 Cellulose (g) 50 50 Bitartrate of choline (g) 2·5 2·5 α-Methionine 3·0 3·0 Soya oil (ml) 70 70 Maize starch (g) 650·2 750·2
* The vitamin mixture contained (mg/kg of diet): retinol 12, cholecalciferol 0·125, thiamine 40, riboflavin 30, pantothenic acid 140, pyridoxine 20, inositol 300, cyanocobalamin 0·1, menadione 80, nicotinic acid 200, choline 2720, folic acid 10, p-aminobenzoic acid 100, biotin 0·6.
† The mineral mixture contained (mg/kg of diet): CaHPO417 200, KCl 4000, NaCl
4000, MgO 420, MgSO42000, Fe2O2120, FeSO4.7H2O 200, trace elements 400
(MnSO4.H2O 98, CuSO4.5H2O 20, ZnSO4.7H2O 80, CoSO4.7H2O 0·16, KI 0·32,
Analysis of the jaw movements during mastication Masticatory jaw movement recordings were performed in 17-, 19- and 21-d-old rats fromfifty-six rats attributed randomly to the N group and thirty-two rats attributed randomly to the U group. For each age group, this analysis was performed on about nine to thirteen animals in the N group and on eight to eleven animals in the U group.
After a period of 3 h of food deprivation (from 14.00 to 17.00 hours), the animals were placed in a transparent acrylic cage where they showed no signs of discomfort. They were offered the diet for each experimental group andfilmed using a video camera with infrared system for 10 min. All the animals were video-taped during the dark cycle, as it is the period of greatest feeding activity for rats. To ensure the reliability of the analysis of the different parameters related to jaw movements during mastication, the recordings were analysed at least twice (test–re-test) by a qualified and trained evaluator, blindly – that is, the evaluator had no knowledge of which experimental group the tested animal belonged to. There were no disagree-ments in the test–re-test evaluations.
Each animal could readily ingest the food when the food was presented in front of the rat’s mouth. The pups were offered 30 g of 17 % casein (N group) and 8 % casein (U group), with a solid and hard consistency (the same food that was offered to the mothers of the different experimental groups). However, because of the ages at which the masticatory analyses were
performed and to minimise possible difficulties in implementing the masticatory jaw movements made by each animal as a result of food properties, adjustments were made to the size of the pellets offered to the pups. The large pellets of about 20 g (4 cm long, 3·5 cm wide and 1 cm thick), normally offered to the mothers, were fragmented into smaller pellets of about 0·6 g (0·8 cm long, 0·6 cm wide and 0·5 cm thick).
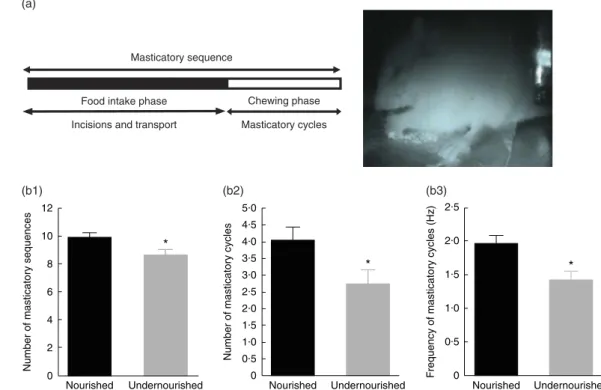
The masticatory sequence began with the rat opening its jaw widely to ingest the food. The animal held an adequate amount of food between its forefeet, then stabilised its head in the upright position for further food processing. The sequence was divided into a period of food intake followed by a period of chewing movements (Fig. 1(a)). The masticatory sequence always started with food preparation and incision followed by chewing. In the incision or food intake period, also called the preparatory period, the food is taken by the incisors and transported to the occlusal surface. This period was characterised by several cycles of simple open–close movements with irregular cycle duration following the initial jaw-opening. However, in the rhythmic-chewing per-iod, also known as masticatory cycles, the food is chewed by the opposing molars. During this period, the animal began to crush and grind the food between the upper and lower molars when the food was transferred to the posterior part of the mouth. During masticatory cycles, the animals also performed a series of stable jaw-opening and jaw-closing movements. At the end of a masticatory sequence, the jaw lowered as seen in the beginning of the sequence for food intake(27).
* Food intake phase
Incisions and transport
Chewing phase
Masticatory cycles Masticatory sequence
Number of masticatory sequences
0 2 4 6 8 10 12
Number of masticatory cycles 0.5 1.0 1.5 2.0 2.5 3.0 3.5 4.0 4.5 5.0 *
Frequency of masticatory cycles (Hz)
0.5 1.0 2.5 2.0 1.5 * 0 0
Nourished Undernourished Nourished Undernourished Nourished Undernourished
(a)
(b1) (b2) (b3)
Fig. 1. Differences in masticatory sequences between nourished and undernourished groups. (a) A masticatory sequence (left) is composed of a food intake phase during which the food is taken by the incisors and transported to the occlusal surface and a chewing phase during which food is crushed by alternating jaw-opening and closing movements. The counts of the number and duration of each type of movement and cycle were based on the analysis of video-taped images (right). Effect of undernutrition on the number of masticatory sequences (b1), the number of masticatory cycles (b2) and the frequency of masticatory cycles (b3) from 17-, 19- and 21-d-old rats. Values are means with their standard errors. Two-way ANOVA; nutritional manipulation and age. * Multiple comparisons (P < 0·05, Bonferroni t test): nourishedv. undernourished.
Thus, the following parameters were assessed in 1 min periods of uninterrupted recordings: number of incisions (amount of movements of the food incision); duration of the food intake phase per sequence (duration of movements of the food incision); number of masticatory sequences (amount of chewing movements made since the incision until the swallowing of food); duration of masticatory sequence (duration of chewing move-ments made since the incision until the swallowing of food); number of masticatory cycles (amount of closing and opening jaw movements per masticatory sequence); duration of the chewing phase per sequence (duration of closing and opening jaw movements per masticatory sequence); and the frequency of masticatory cycles (amount of closing and opening jaw move-ments per second) (adapted from Mostafeezur et al.(27)).
Electrophysiological recordings
The intrinsic membrane properties of neurons located in the dorsal part of the NVsnpr were assessed using whole-cell patch-clamp recordings in in vitro brainstem slice preparations from 14- to 21-d-old rats (N, n 48 animals; U, n 48 animals) chosen randomly. For each age group, electrophysiological recordings were attempted in brain slices from 6 animals in both experi-mental groups.
Rats were decapitated and their brains were quickly removed and placed in cold (4°C) sucrose-based artificial cerebrospinal fluid (ACSF, composition in mM: 225 sucrose, 3 KCl, 1·25
KH2PO4, 4 MgSO4, 0·2 CaCl2, 20 NaHCO3 and 10D-glucose) bubbled with 95 % O2–5 % CO2, pH 7·4. In the same medium, transverse slices (320μm thick) through the NVsnpr were prepared using a Vibratome (VT1000 S; Leica). Slices were incubated at room temperature (21–24°C) in a holding chamber filled with normal ACSF (in mM: 125 NaCl, 3 KCl, 1·25 KH2PO4, 1·3 MgSO4, 2·4 CaCl2, 26 NaHCO3and 25D-glucose). The slices were transferred to an immersion chamber, perfused with normal ACSF at a rate of approximately 2 ml/min and allowed to stand≥1 h before the experiment was started.
Neurons were visualised using a fixed-stage microscope (Eclipse E600FN; Nikon), coupled with a 40× water-immersion lens. The image was enhanced with an infrared-sensitive CCD camera and displayed on a video monitor. Whole-cell patch-clamp recordings in current-patch-clamp mode were performed from visually identified cells located in the dorsal part of the NVsnpr using an axoclamp 2B amplifier (Axon Instruments). Patch electrodes (6–9 MΩ) were pulled from borosilicate glass capil-laries (1·5 mm OD, 1·12 mm ID; World Precision Instruments) on a Sutter P–97 puller (Sutter Instruments) and filled with a K-gluconate-based solution (in mM: 140 K-gluconate, 5 NaCl,
2 MgCl2, 10 HEPES, 0·5 EGTA, 2 ATP and 0·4 GTP). Rhythmic firing was induced by local application of N-methyl-D-aspartate
(NMDA) (2 mM) while applying a small hyperpolarising current.
Data acquisition
Electrophysiological data were acquired through a Digidata 1322A interface and analysed using Clampex 9 software (Axon Instruments). Only data from neurons with stable resting mem-brane potential (RMP) equivalent or more negative than−45 mV
and which had overshooting action potentials (AP) were analysed. Passive membrane properties of cells, as their input resistance, were measured by injecting small hyperpolarising current pulses to avoid the activation of voltage-sensitive currents. Bursts were defined as a series of three AP or more overriding plateau potentials. They were considered as rhythmic when they recurred regularly and were separated by silent periods without firing (see examples in Fig. 4(a), right insets, and Fig. 5(a–c)). Histochemical and morphometric analysis of the masseter muscle
At 25 d of age, some of the rats (N, n 4 animals; U, n 5 animals) that underwent jaw movement analysis during mastication were chosen randomly for anatomical examination of the masseter muscles. Histochemical and morphometric analysis of the mass-eter muscle was dmass-etermined by counting 600 fibres per animal from each experimental group. A total of 2400 musclefibres were evaluated in the N group and 3000 musclefibres in the U group. The rats were killed by decapitation, and from a longitudinal incision in the anterior neck their superficial masseter muscles were dissected, immersed in n-hexane at low temperature and stored at −80°C until histological analysis. Serial cross-sections (10µm) were cut using a cryostat maintained at −20°C and stained for myofibrillar ATPase(28)
. The sections were incubated for 30 min at room temperature in a glycine buffer (pH 9·4) containing 20 mM-CaCl2and 2·9 mM-ATP disodium salt. They were washed in
1 % CaCl2 (2× 3 min), immersed in 2 % CoCl2 for 3 min and washed in distilled water (3× 30 s) before being exposed to 1 % yellow ammonium sulphide for 1 min; the samples were washed again in distilled water (3× 30 s) and mounted in Entellan.
The sections were analysed using a light microscope (Olympus Optical U-CMAD-2; 109 objective lens) connected to a computer (TV Tuner Application – TelSignal Company Limited, image capture software). The images of the histological cross-sections of the superficial masseter were captured for further analysis. Musclefibres were labelled with respect to the three major types (I, IIA and IIB) offibres on the basis of dif-ferences in the staining intensity for ATPase after acid pre-incubation (pH 4·4 and 4·7). According to the different staining intensities, the following classification was used for masseter: pH 4·4 (type I, darkest and type II, lightest) and pH 4·7 (type I, darkest, type IIA, lightest and type IIB, grey). Histochemical analysis was performed using computerised image analysis from Mesurim PRO 3.2 software (developed by Jean-François Madre-Amiens). The musclefibre type composition was deter-mined by counting approximately 600fibres in ten fields that were equally distributed over the 4·7 sample. To evaluate the cross-sectional area and perimeter of the muscle cells, micro-scopefields from each section were analysed under the optical microscope (Leica, 40× objective). Images of fifty muscle cells per animal were taken from each preparation for later analysis with Scion Image Beta 4.0.2 software.
Statistical analysis
Results are presented as means with their standard errors and as proportions (%). A two-way ANOVA was performed for body weight analysis, the analysis of the masticatory movements and
the muscle histochemical and morphometric analysis. In addi-tion, a post hoc Bonferroni t test was used. Unpaired Student’s t tests and the Mann–Whitney rank sum tests were performed for the electrophysiological membrane and bursting properties of neurons located in the dorsal part of the NVsnpr. χ2 tests were used for the comparison of percentages. Statistical significance was defined as P < 0·05 in all cases. Data analysis was performed using the statistical program Graphpad Sigma Stat 3.5.
Results
Offspring body weight
The body weight of both nourished and undernourished animals increased linearly with age, but in a biphasic manner with a steeper relationship in the first two postnatal weeks.
A clear difference appeared between the nourished and the undernourished at P14 (two-way ANOVA, Bonferroni t test; P< 0·05) and was maintained until P21 (two-way ANOVA, Bonferroni t test; P< 0·05) at which point the experiment ended (Fig. 2).
Analysis of the jaw movements during mastication Stable and reliable masticatory jaw movement recordings were obtained from thirty-two of the fifty-six rats tested in the N group and from twenty-eight of the thirty-two rats tested in the U group (N, n 32; U, n 28). Analysis of the jaw movements during mastication showed that the pups whose mothers were subjected to neonatal protein undernutrition had significantly fewer masticatory sequences than their nourished counterparts (Table 2; two-way ANOVA, Bonferroni t test, P= 0·049). Within these sequences, the greatest differences between the two groups appeared mainly in the chewing phase. There was no significant difference in the number of incisions per sequence (Table 2; two-way ANOVA, Bonferroni t test, P= 0·053) and in the duration of the food intake phase per sequence (Table 2; two-way ANOVA, Bonferroni t test, P= 0·855) as both groups performed about 10 incisions/min during a period of about 4 s (Table 2).
However, in the chewing phase of the masticatory sequen-ces, pups whose mothers were subjected to neonatal protein undernutrition had a significantly lower number of masticatory cycles (Table 2; two-way ANOVA, Bonferroni t test, P= 0·045), which occurred at a significantly lower frequency (Table 2; two-way ANOVA, Bonferroni t test, P= 0·004). The number of cycles per sequence varied between two and eight in under-nourished animals and between one and thirteen in under-nourished animals.
Electrophysiological properties of trigeminal main sensory nucleus neurons
Forty-three neurons recorded in the dorsal part of the NVsnpr in brains slices from twenty-four of the forty-eight rats included in the normally N group fulfilled the inclusion criteria. Their basic
0 10 20 30 40 50 60 70 3 8 14 15 16 17 18 19 20 21 Body weight (g) Age (d) * * * * * * * *
Fig. 2. Effects of undernutrition on the body weight curve. Body weight of rats subjected to nutritional manipulation (nourished or undernourished) during the lactation period (two-way ANOVA; nutritional manipulation and age). Values are means with their standard errors. * Multiple comparisons (P < 0·05, Bonferronit test): nourished v. undernourished. , Nourished; , undernourished.
Table 2. Effects of undernutrition on masticatory movements in rats† (Mean values with their standard errors)
Experimental groups
Nourished Undernourished
Masticatory movements parameters Mean SEM n Mean SEM n P‡
Number of masticatory sequences per min 9·82 0·413 32 8·61 0·44 28 0·049*
Masticatory sequence duration (s) 6·042 0·258 32 6·137 0·274 28 0·801
Number of incisions per sequence 10·989 0·415 32 9·780 0·443 28 0·053
Duration of food intake phase per sequence (s) 4·047 0·245 32 4·113 0·262 28 0·855
Number of masticatory cycles per sequence 4·015 0·424 32 2·743 0·452 28 0·045*
Duration of chewing phase per sequence (s) 1·976 0·164 32 2·019 0·175 28 0·857
Masticatory cycles frequency (number of cycles/s) 1·967 0·124 32 1·427 0·132 28 0·004*
*P < 0·05, nourished v. undernourished.
† Rats (17-, 19- and 21-d-old) were subjected to nutritional manipulation (nourished, n 32 or undernourished, n 28) during the lactation period.
‡ A two-way ANOVA for multiple comparisons was used to identify differences between factors (nutritional manipulation and age) and the Bonferroni corrected t test applied to determine where differences occurred.
electrophysiological characteristics are summarised in Table 3. None of their membrane properties (RMP,firing threshold and input resistance) seemed to evolve with age for the time period tested as shown by the scatter of their averaged values for each day of age (Fig. 3(a1–a3), black circles and lines). In all, 72 % of these neurons were spontaneously active as shown in Fig. 3(b1–b3). The average values of their AP and after hyper-polarisation (AHP) amplitude and duration are given in Table 3. In 23 % of the cells, a monopahsic AHP as in Fig. 3(c1) (left trace) followed the AP, whereas the great majority showed a biphasic AHP (Fig. 3(c2) and (c3)). From the four spike para-meters included in Table 3, only the duration of the AP was significantly correlated with age (Fig. 3(d2); linear regression, r 0·82, P = 0·001). All the recorded neurons showed a depo-larising sag (Fig. 3(e1) and (e2)) upon strong membrane hyperpolarisation that gave rise to a rebound AP (Fig. 3(e1) and (e3)) at the end of the hyperpolarising pulse in twenty-eight (65 %) of these cells.
Thirty-nine neurons recorded in the dorsal part of the NVsnpr in brain slices from twenty-three of the forty-eight animals included in the U group fulfilled the inclusion criteria. The RMP, thefiring threshold and the input resistance of these neurons did not seem significantly different from those of the neurons of the normally N group (Table 3). Averaged values for each day of age for these three membrane properties show no obvious demarcation between both groups and, as in the normally N group, no clear tendency for an age-related progression could be seen (Fig. 3(a1–a3)). However, a significantly lower pro-portion (Fig. 3(b2); Table 3;χ2test, P< 0.001) of the recorded cells in the U group showed spontaneous firing of AP as shown in Fig. 3(b1), although no difference could be found in the frequency (Fig. 3(b3); Table 3) of the spontaneousfiring. The AP parameters did not differ significantly from those of the normally N group (Table 3), and no clear demarcation appeared in the scatter of the averaged values by day of age
in any of these parameters between both the groups (Fig. 3(d1–d4)). However, the age-related decrease of spike duration that has been observed in the normally N group was NS for the U group (see Fig. 3(d2)). Moreover, significantly lower proportions of the recorded cells in the U group showed a depolarising sag and rebound APfiring upon and at the offset of membrane hyperpolarisation, respectively (Fig. 3(e1–e3); Table 3;χ2tests, P< 0·001 for the depolarising sag and P = 0·005 for the rebound excitation).
N-methyl-D-aspartate-induced bursting in trigeminal main
sensory nucleus neurons
Previous studies have shown that electrical stimulation of the trigeminal tract can elicit rhythmical bursting in NVsnpr neurons(29,30). These bursts are Na persistent current (INaP)-dependent as they can be abolished by pharmacological blockade of this current(30,31). NMDA locally applied near NVsnpr neurons can also induce rhythmic bursting as shown in Fig. 4(a) (top traces, right inset), but only if the recorded cell is hyperpolarised with current injection (Fig. 4(a), bottom trace) to maintain its membrane potential within the INaP activation range. Using a similar approach to test whether the difference in diet alters the bursting ability of NVsnpr neurons, we found that local NMDA applications elicited bursting in 67 % (Fig. 4(b1)) of the neurons that were recorded in the dorsal part of the NVsnpr from the normally nourished rats v. 49 % (Fig. 4(b2)) from the U group. The bursting cells of the normally N group were dis-tributed all along the age period tested, whereas>60 % of the bursting cells in the U group appeared after P18 (Fig. 4(c)), suggesting a delayed maturation in the U group, as it has already been documented that the propensity to burst in NVsnpr neurons is developmentally regulated during the sec-ond and third postnatal weeks in rats(10). The percentage of bursting cells in relation to age between both groups was
Table 3. Effects of undernutrition on intrinsic membrane properties of neurons located in the dorsal part of the trigeminal main sensory nucleus† (Mean values with their standard errors; percentages)
Experimental groups
Nourished Undernourished
Parameters Mean SEM n Mean SEM n P
Resting membrane potential (mV) –51 0·4 43 − 52 0·8 39 0·495‡
Input resistance (MΩ) 218 4 43 212 6 39 0·797§
Firing threshold (mV) −43 0·5 43 42 0·7 39 0·096‡
Spontaneous firing (number of cells) 31/43 18/39 <0·001||*
Spontaneous firing frequency (Hz) 4·5 0·9 43 6·2 1·1 39 0·095‡
Action potential amplitude (mV) 70 2 43 70 1 39 0·283‡
Action potential duration (ms) 0·75 0·03 43 0·84 0·06 39 0·506‡
AHP amplitude (mV) 6·6 0·3 43 7·0 0·4 42 0·519‡
AHP duration (ms) 163 15 43 154 18 39 0·422‡
Sag (number of cells) 43/43 33/39 <0·001||*
AHP, after hyperpolarisation.
*P < 0·05, nourished v. undernourished.
† Assessed using whole-cell patch recordings in in vitro brainstem slice preparations (nourished, n 43; undernourished, n 39) from 14- to 21-d-old rats. Rats were subjected to nutritional manipulation (nourished,n 24 or undernourished, n 23) during the lactation period.
‡ P values were obtained from the Mann–Whitney rank sum test comparing the differences between the treatment groups. §P values were obtained from the unpaired Student’s t test comparing the differences between the treatment groups. || P values were obtained from the χ2test comparing the differences between the treatment groups.
10 mV 200 ms 20 ms 20 ms 10 mV 10 mV 0.2 nA 200 ms –52 mV 10 mV AHP duration Spike amplitude Firing threshold AHP amplitude Spike duration Biphasic AHP –54 mV 0 nA Sag Rebound firing 0 20 40 60 80 Cells (%) Cells (%) 100 120
Sag Rebound firing
0 20 40 60 80 RMP (mV) –57 –55 –53 –51 –49 –47 –45 Age (d) 14 15 16 17 18 19 20 21 Firing threshold (mV) Age (d) 14 15 16 17 18 19 20 21 –46 –44 –42 –40 –38 –36 Input resistance (M Ω ) Age (d) 14 15 16 17 18 19 20 21 80 120 160 200 240 280 320 360 400 Cells (%) 0 20 40 60 80
Monophasic AHP Biphasic AHP
Cells (%) 0 20 40 60 80
Spontaneously active cells
Firing frequency (Hz) 2 4 6 8 0 Spontaneous activity AP amplitude (mV) 60 64 68 72 76 80 14 15 16 171819 20 21 Age (d) AP duration (ms) 0.50 0.60 0.70 0.80 0.90 1.00 1.10 1.20 1.30 1.40 14 15 16 171819 20 21 Age (d) AHP amplitude (mV) –3 –4 –5 –6 –7 –8 –9 –10 –11 –12 14 15 16 171819 20 21 Age (d) AHP duration (ms) 360 320 280 240 200 160 120 80 40 14 15 16 171819 20 21 Age (d) n 31 n 31 n 18 n 18 n 10 n 10 n 33 n 29 n 43 n 33 n 28 n 17 ** ** *
(a1) (a2) (a3)
(b1) (b2) (b3)
(c1) (c2) (c3)
(d1) (d2) (d3) (d4)
significantly different (Fig. 4(c); χ2test, P= 0·002). Surprisingly, the bursts were triggered at potentials more hyperpolarised than thefiring threshold, at approximately −61 (SEM0·7) mV and
were of three different types (Fig. 5). In the normally N group, bursting in most cases (sixteen out of twenty-nine, 55 %) con-sisted in recurrent plateaus of short duration (85 (SEM11) ms) as
shown in Fig. 5(a), over-ridden by trains of AP that occurred at an average frequency of 3 (SEM0.5) Hz. The plateaus reached an
amplitude of 16 (SEM 0·9) mV and, within the bursts, the spike
shape remained nearly constant throughout the plateau dura-tion and reached an averagefiring frequency of 152 (SEM14) Hz
(see inset in Fig. 5(a)). These bursts, which appeared at approximately −60 (SEM 0·9) mV, were classified as regular
bursts (RB) because of their regularfiring upon the plateaus. In 7 of the remaining cells, the bursts consisted of large plateau potentials (31 (SEM2) mV) upon which an adaptative spikefiring
could be observed (Fig. 5(b)). The amplitude of the intraburst spikes in these cases decreased progressively, whereas their duration increased until they became only wavelets on the plateau (see inset in Fig. 5(b)). These plateaus were triggered at approximately −62 (SEM 2) mV and lasted significantly longer
than those supporting the RB (491 (SEM91) ms v. 85 (SEM11) ms,
Mann–Whitney rank sum test, P = 0·002). These bursts recurred regularly at an average frequency of 1·3 (SEM0·5) Hz and were
classified as adaptative bursts (AB). In the remaining six cells out of twenty-nine (21 %) that showed NMDA-induced bursts in the normally nourished animals, the bursts consisted of long-lasting plateau potentials (448 (SEM72) ms) that were subdivided
into smaller plateaus overrode by small clusters of spikes (Fig. 5(c)). The amplitude of the main plateau was 17 (SEM2) mV. These bursts that have been classified as irregular bursts (IB) because of their irregular spiking upon the plateaus appeared at significantly more hyperpolarised potential than the RB (−63 (SEM1) mV v.− 61 (SEM0·7) mV, unpaired Student’s t test, P = 0.02)
and recurred at an average frequency of 1·3 (SEM0·2) Hz.
The NMDA-induced bursts within the U group were triggered at the same potential compared with the bursts of the N group (−61 (SEM 0·7) mV) and could also be classified into three
different types. However, their relative distribution differed with the IB type dominating (nine out the nineteen cells) (Fig. 5(d)). These bursts occurred at a mean frequency of 1·5 (SEM0·3) Hz
and their plateaus had an average amplitude and duration of 13 (SEM2) mV and 661 (SEM188) ms, respectively. The remaining
bursts were divided into equal parts between the RB (n 5) and the AB (n 5) groups (Fig. 5(d)). The AB in the undernourished animal occurred at a mean frequency of 0·6 (SEM0·2) Hz, and
the average amplitude and duration of their plateaus were 28 (SEM2) mV and 566 (SEM138) ms, respectively. The RB in the
undernourished animals did not differ significantly from those of the N group, in either their burst frequency (1·6 (SEM0·5) Hz),
duration (279 (SEM 133) ms) or the plateau amplitude
(11 (SEM 1) mV). Only the firing frequency within the bursts differed significantly between both groups (89 (SEM 31) v. 152
(SEM 14) Hz, unpaired Student’s t test, P = 0·047). The burst
characteristics of NVsnpr neurons obtained from nourished and undernourished animals are summarised in Table 4. When all the bursts are pulled together, only the bursting frequency and plateau duration differed significantly between both the groups (Mann–Whitney rank sum tests, P < 0·05).
Histochemical and morphometric analysis of the masseter muscle
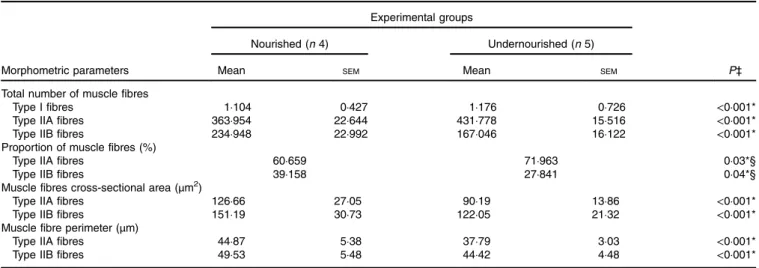
Anatomical examination of the masseter muscle was performed for four andfive animals in the N and U groups, respectively. Fig. 6(a) shows examples of two superficial masseter muscle sections stained for myofibrillar ATPase activity showing the variability in fibre type content between both experimental groups. Table 5 lists all the results regarding the numbers and areas of each type offibre in both animal groups based on the histochemical and morphometric analysis of 600fibre bundles from the surface of the masseter muscles. Low-protein diet offered during the lactation period significantly increased the total number of type IIA fibres (Table 5; two-way ANOVA, Bonferroni t test, P< 0·001) and decreased the number of type IIB fibres (Table 5; two-way ANOVA, Bonferroni t test, P< 0·001). These differences in number were also reflected in the different proportions of muscle fibre types. The under-nourished animals had a significantly higher percentage of type IIAfibres compared with the N group (Table 5; χ2test, P= 0·03). However, type IIBfibres of the U group showed a lower pro-portion (%) in relation to control animals (Table 5; χ2 test, P= 0·04).
The analysis of the number of muscle fibres per mm2 also showed that undernourished animals had a larger number of type IIA v. type IIB fibres compared with nourished animals
Fig. 3. Effects of undernutrition on the electrophysiological properties of trigeminal main sensory nucleus (NVsnpr) neurons. (a) Variations of NVsnpr neuron resting membrane potential (RMP; a1), firing threshold (a2) and input resistance (a3) with age in the normally nourished ( ) and undernourished ( ) groups. Continuous lines ( : (a1) linear fit (r 0·01, P = 0·379), (a2) linear fit (r 0·15, P = 0·760), (a3) linear fit (r 0·10, P = 0·231); : (a1) linear fit (r 0·19, P = 0·857), (a2) linear fit (r 0·20, P = 0·931), (a3) linear fit (r 0·20, P = 0·173)) are best-fit linear regression functions (r correlation coefficients). (b1) Example of spontaneous activity recorded in an NVsnpr neuron from the nourished group. (b2) Histogram of the percentages of cells that were spontaneously active in the normally nourished ( ) and undernourished ( ) groups (left). (b3) Histogram of the mean values and standard errors of firing frequency of the spontaneous activity in the normally nourished ( ) and undernourished ( ) groups. (c1) Example of an action potential (AP) with a monophasic AHP. The dotted lines and arrows delimited the measures that were considered for analysis. (c2) Example of an AP with a biphasic after hyperpolarisation (AHP). (c3) Histogram of the relative distribution of both types of AHP in the normally nourished ( ) and undernourished ( ) groups. (d) Variation of NVsnpr neurons AP and AHPs amplitude (d1 and d3) and duration (d2 and d4) with age in the normally nourished ( ) and undernourished ( ) groups. Continuous lines ( : (d1) linear fit (r 0·26, P = 0·113), (d2) linear fit (r 0·82, P = 0·001), (d3) linear fit (r 0·36, P = 0·066), (d4) linear fit (r 0·35, P = 0·070); : (d1) linear fit (r 0·58, P = 0·029), (d2) linear fit (r 0·33, P = 0·104), (d3) linear fit (r 0·12, P = 0·566), (d4) linear fit (r 0·30, P = 0·116)) are best-fit linear regression functions (r correlation coefficients). (e1) Response of an NVsnpr neuron to membrane hyperpolarisation showing a depolarising sag (arrow) at the onset of the hyperpolarising pulse and a rebound firing at cessation (arrowhead). (e2) Histogram of the percentages of cells showing a depolarising sag in the normally ( ) and undernourished ( ) groups. (e3) Histogram of the percentages of cells showing a rebound firing in the normally ( ) and undernourished ( ) groups. Values are means with their standard errors and as proportions (%). *P < 0·05, ** P < 0·001, χ2test.
(forty-eight type IIA and nineteen type IIB v. forty type IIA and twenty-six type IIB, respectively) (Fig. 6(b); two-way ANOVA, Bonferroni t test, P< 0·01).
Moreover, protein undernutrition also affected morphometric parameters of the superficial masseter muscle. Both types II fibres (A and B) of undernourished animals showed lower cross-sectional area and perimeter than those of the N group (see Table 5; two-way ANOVA, Bonferroni t test, P< 0·001). Discussion
We investigated the effects of the neonatal low-protein diet on the masticatory efficiency in rats. The main finding of the pre-sent study is that neonatal undernutrition alters the number of masticatory sequences and cycles conducted before swallow-ing, modifies the firing pattern of neurons in the dorsal NVsnpr and leads to early changes in the phenotype of thefibres, as well as in the morphology of the superficial masseter muscle. These findings suggest that neonatal protein undernutrition reduces masticatory efficiency in rats by decreasing the time of oral food processing and decreasing the strength of chewing strokes required for grinding food during feeding behaviour.
Offspring body weight
We observed that undernutrition during the critical period of development reduces body weight. Our results support studies showing that protein undernutrition affect food intake and weight gain(32–34). This effect may be a consequence of the protein deficiency that was imposed on the mothers during the suckling period. The restriction of maternal proteins causes changes in the composition and volume of breast milk(35), and may be related to the body weight of their offspring(33,34,36). This deficiency in body weight gain may result, among other things, from the fact that, despite the increases in basal levels of growth hormone (GH) associated with undernutrition(37), a decrease is observed in the expression and binding of GH receptors(38)causing insensitivity and resistance to GH(39).
Analysis of the jaw movements during mastication This study is thefirst to investigate the effect of neonatal low-protein diet on masticatory efficiency in rats. We first evaluated the effects of neonatal protein undernutrition on the jaw movements during mastication by analysing the jaw movements using the approach described by Mostafeezur et al.(27). Animals
10 mV 10 s 0.5 nA –53 mV 0 nA NMDA 10 mV 2 s 200 ms 20 ms 20 ms 10 mV 10 mV 10 mV –53 mV –65 mV Nourished (n 43) 0 20 40 60 80 Undernourished (n 39) 0 20 40 60 80 Bursting No bursting 0 20 40 60 80 14–15 16–17 18–21 n 8 n 11 n 10 n 3 n 4 n 12 n 29 n 14 n 19 n 20 Bursting No bursting Cells (%) Cells (%) Bursting cells (%) Age (d) * (a) (b1) (b2) (b3)
Fig. 4. Induction of rhythmic bursting in trigeminal main sensory nucleus (NVsnpr) neurons with N-methyl-D-aspartate (NMDA). (a) Local NMDA application near a cell spontaneously active at resting membrane potential (RMP) (left inset, magnification of the action potentials) induces rhythmic burst firing (right inset: magnification of the bursts) if injected with hyperpolarising current (bottom trace) to maintain its membrane potential within the Na persistent current activation range. (b1) Histogram of the percentages of bursting ( , nourished (29 bursting cells)) and non-bursting (□) cells in the normally nourished group. (b2) Histogram of the percentages of bursting ( , undernourished (19 bursting cells)) and non-bursting (□) cells in the undernourished group. (c) Histogram of the relative distribution of the bursting cells in relation to age in normally nourished ( , 29 bursting cells) and undernourished ( , 19 bursting cells) groups. Values are proportions (%). *P < 0·05, χ2test.
whose mothers were fed a low-protein diet during lactation had fewer masticatory sequences as well as fewer cycles per sequence. They also tended to have fewer incisions when compared with the N group, but this difference was NS. The reduction in cycle frequency correlates well with the reduction in bursting frequency, whereas the decrease in propensity to burst could be responsible for the fewer masticatory sequences. However, other factors may also explain the results obtained regarding the masticatory behaviour. According to a recent systematic review of the literature by Ferraz-Pereira et al.(40),
perinatal low-protein and/or energy diet delays the growth of the mandible; reduces the synthesis of collagen as well as the deposit of calcium and protein content of the mandible; delays dental eruption; limits growth of the incisors and molars; and increases susceptibility to caries. All of these alterations can cause changes in the phases of food incision, crushing and pulverising, inducing modifications in the masticatory sequence and cycle.
Another important factor is the relationship between the number of chewing cycles and sequences, time of food oral
10 mV 200 ms 10 mV 50 ms 1 s 200 ms 10 mV 10 mV 50 ms 10 mV 100 ms 10 mV RB –63 mV –63 mV AB –65 mV IB 0 20 40 60 RB AB IB Bursts category n 16 n 7 n 6 n 9 n 5 n 5
Percentage of bursting cells
(a)
(c)
(b)
(d)
Fig. 5. Effects of undernutrition on N-methyl-D-aspartate (NMDA)-induced bursts properties (a) Example of NMDA-induced bursting in an trigeminal main sensory nucleus (NVsnpr) neuron showing the regular burst (RB) type (inset shows the regular firing overriding the plateau). (b) Example of NMDA-induced bursting in an NVsnpr neuron showing the adaptative burst (AB) type (inset shows the progressive change of spike shape and wavelets). (c) Example of NMDA-induced bursting in an NVsnpr neuron showing the irregular burst (IB) type (inset shows the irregular firing and small plateaus overriding the main plateau). (d) Histogram of the relative distribution of the different burst types in the normally nourished ( , 29 bursting cells/43) and undernourished ( , 19 bursting cells/39) groups. Values are proportions (%).
Table 4. Effects of undernutrition on bursting properties of neurons located in the dorsal part of the trigeminal principal sensory nucleus following N-methyl-D-aspartate application†
(Mean values with their standard errors; percentages)
Experimental groups
Nourished Undernourished
Parameters Mean SEM n Mean SEM n P
Number of bursting cells 29/43 19/39 0·484‡
Burt frequency (Hz) 2·5 0·4 43 1·3 0·2 39 0·032§*
Intraburst firing frequency in RB (Hz) 152 14 16 89 31 5 0·047||*
Membrane potential burst (mV) −61 0·7 43 −61 0·7 39 0·604||
Plateaus amplitude (mV) 20 1 43 16 2 39 0·060§
Plateaus duration (ms) 269 47 43 536 103 39 0·014§*
RB, regular bursts.
* P < 0·05, nourished v. undernourished.
† Assessed using whole-cell patch recordings in in vitro brainstem slice preparations (nourished, n 43; undernourished, n 39) from 14 to 21-day-old rats. Rats were subjected to nutritional manipulation (nourished,n 24 or undernourished, n 23) during the lactation period.
‡ P values were obtained from the χ2test comparing the differences between the treatment groups.
§P values were obtained from the Mann–Whitney Rank Sum test comparing the differences between the treatment groups. || P values were obtained from the unpaired Student’s t test comparing the differences between the treatment groups.
Table 5. Effects of undernutrition on total number, proportion and morphometric parameters of different types of fibres in the superficial masseter muscle† (Mean values with their standard errors; percentages)
Experimental groups
Nourished (n 4) Undernourished (n 5)
Morphometric parameters Mean SEM Mean SEM P‡
Total number of muscle fibres
Type I fibres 1·104 0·427 1·176 0·726 <0·001*
Type IIA fibres 363·954 22·644 431·778 15·516 <0·001*
Type IIB fibres 234·948 22·992 167·046 16·122 <0·001*
Proportion of muscle fibres (%)
Type IIA fibres 60·659 71·963 0·03*§
Type IIB fibres 39·158 27·841 0·04*§
Muscle fibres cross-sectional area (μm2)
Type IIA fibres 126·66 27·05 90·19 13·86 <0·001*
Type IIB fibres 151·19 30·73 122·05 21·32 <0·001*
Muscle fibre perimeter (μm)
Type IIA fibres 44·87 5·38 37·79 3·03 <0·001*
Type IIB fibres 49·53 5·48 44·42 4·48 <0·001*
* P < 0·05, nourished v. undernourished.
† Rats (25 d old) were subjected to nutritional manipulation (nourished, n 4 or undernourished, n 5) during the lactation period.
‡ A two-way ANOVA for multiple comparisons was used to identify differences between factors (nutritional manipulation and fibre types) and the Bonferroni corrected t test applied to determine where differences occurred.
§P values were obtained from the χ2test comparing the differences between the treatment groups.
I
IIB
IIA
IIB IIA
Number of fibres per mm
2 Nourished Undernourished 0 10 20 30 40 50 IIA IIB 60 (a) (b) I
**
Fig. 6. Effects of undernutrition on the fibre composition of masseter muscles. (a) Rat superficial masseter muscle sections stained for myofibrillar ATPase activity after pre-incubation in a buffer at pH 4.7 showing the variability in fibre type content between each experimental group. At this pH, the type I fibres are stained dark; the type IIA fibres are stained light; and the type IIB are stained grey. Left, nourished group (n 4); right, undernourished group (n 5). (b). Effects of undernutrition on the number of muscle fibres per mm2of different types of fibres in the superficial masseter muscle at 25 d of life. Rats were subjected to nutritional manipulation (nourished
( ) or undernourished ( )) during the lactation period. Values are means with their standard errors represented by vertical bars. Two-way ANOVA; nutritional manipulation and fibre type. ** Multiple comparisons (P <0·01, Bonferroni t test): nourished v. undernourished.
processing and satiety. The efficiency of mastication, as evi-denced by the number of chewing cycles and sequences, can influence the process of satiety by several mechanisms(41)
. Studies in rodents report that chewing has a direct effect on satiety through histaminergic activation of the ventromedial and paraventricular nucleus of the hypothalamus(41,42). Chewing is also a key stimulus of the cephalic phase of digestion. There-fore, increasing the chewing effort before swallowing can increase the response of the cephalic phase of appetite-related hormones such as insulin, cholecystokinin and pancreatic polypeptide(43–45). Finally, the larger number of chewing cycles increases the time of oral processing, therefore reducing the appetite or food intake(46–48). Studies indicate that the fast feed rate, great bite size or short duration of oral processing, which is related to a reduction in the number of chewing cycles and sequences, can promote over-eating(47), which is associated with high body weight or risk of weight gain(49). In this regard, it is suggested that animals whose mothers were fed a low-protein diet during lactation performed fewer chewing cycles and sequences, or had a shorter oral food processing duration before swallowing, and hence delayed satiety. It is noteworthy that, although not the focus of this study, previous research from our laboratory showed delayed satiety as an effect of perinatal protein undernutrition(50). However, the mechanisms related to this delay are still being elucidated.
Electrophysiological properties of trigeminal main sensory nucleus neurons
For a better understanding of the mechanisms underlying our behavioural findings, we next investigated the effects of neo-natal protein deficiency on the part of the neuronal circuitry that controls mastication. We evaluated the effects of neonatal protein undernutrition on the membrane intrinsic properties and firing patterns of neurons in the dorsal part of NVsnpr, which are thought to form a part of the masticatory central pattern generator. Protein deficiency during lactation did not seem to have a major effect on the membrane properties of NVsnpr neurons recorded from animals aged 14 to 21 d. These data are in accordance with the study by Rushmore et al.(51) who examined the effects of prenatal undernutrition on the intrinsic membrane properties and AP characteristics of dentate granule and CA1 pyramidal cells. The authors noted that the neuronal membrane properties and firing characteristics of hippocampal cells of rats submitted to protein undernutrition during gestation were unchanged compared with control animals(51). This lack of change in membrane properties is surprising, given the abundance of studies reporting an effect of protein undernutrition on morphological, biochemical and functional maturation of the central nervous system (for review(52,53)). These numerous reports suggest that neurons could undergo important structural changes, which in turn could result in changes in membrane intrinsic properties, as electrophysiological parameters of neurons are partly inherent of their morphological characteristics. The absence of change in basic membrane properties in our study suggests that the mor-phology and integrity of NVsnpr neurons are both well preserved in undernourished rats. In this regard, Gressens et al.(54)reported
that, in spite of the observation of numerous abnormalities in brain development, brain weight and cytoarchitecture in postnatal animals subjected to protein undernutrition during gestation were unchanged compared with control animals. This relative preservation of brain tissue integrity may result from a potential evolutionary mechanism that spares brain tissue during the critical period from insults that may compromise survival, at the expense of other body tissues, such as adipose tissue and muscle, which may suffer more significant alterations(55). Even though most of the basic membrane properties of NVsnpr neurons did not change with under-nutrition, these neurons seem nevertheless to show a slightly decreased excitability, as they show less spontaneous activity and a lower percentage of depolarising sag and reboundfiring at the end of membrane hyperpolarisation. The depolarising sag is caused by Ih, an inward current activated by membrane hyperpolarisation commonly observed in rhythmogenic neu-rons and that has been associated with pacemaker properties in a number of neurons (for review(56)). Its depolarising effect often causes a rebound firing by activating Na and voltage-dependent channels. The decreased percentage of depolarising sag and associated reboundfiring suggests that protein under-nutrition may alter NVsnpr neurons’ bursting characteristics. Indeed, the number of cells that burst and their bursting fre-quency were reduced in offspring of mothers who suffered protein undernutrition during the period of lactation. These observations are in accordance with the study of Stern et al.(57) that reports a decrease in the incidence of spontaneous neuronal bursting activity in the forebrains of adult under-nourished rats. Interestingly, these changes in rhythmicfiring of NVsnpr neurons were paralleled with changes in the movement pattern. Indeed, undernourished animals had fewer chewing episodes and a slower chewing rhythm.
A previous study from our lab has shown that the plateau supporting bursting in NVsnpr neurons relies on a voltage-dependent INaP even when bursting is elicited by NMDA, because it can be blocked by Riluzole, a blocker of INaP channels(30,31). The voltage dependency of the plateau (between−60 and −50 mV) corresponds to the INaP activation range(10,58). This explains why hyperpolarisation was required to induce bursting with NMDA to maintain the membrane potential within the INaPactivation range. We have also shown that Ca2+-dependent K+currents determined the duration of the plateau and are probably responsible for its termination. Burst parameters indicative of INaP characteristics, such as the amplitude of the plateau and the membrane potential at which they appear, were not different between the two groups. The two main differences in burst characteristics observed in this study are an increase in plateau duration and a decrease in bursting frequency in the U group. Both these changes were probably inter-related as their measures were altered by roughly a factor of two (i.e. the duration doubled while the frequency was reduced by half). The increase in plateau duration could reflect an alteration of the conductances responsible for burst termination or alternately a change in the extracellular ion concentration that could change the driving forces responsible for the plateau. Changes in extracellular ion concentration could result from an effect of undernutrition on
astrocyte function. Several studies have shown that under-nutrition and protein deficiency alter glial function and maturation(54,59–62). Although opposite effects were sometimes reported regarding maturation, an interesting observation is that changes in the level of the astrocytic protein S100β were observed in the tissue and in the cerebrospinalfluid(55).
The effects of undernutrition on bursting in NVsnpr neurons may also result from alterations in neurotransmitter systems, as bursting involves an interplay between intrinsic membrane properties and synaptic connections. Indeed, undernutrition has been shown to alter the level of several neuro-transmitters(63–68) as well as the number and distribution of their receptors and to alter their receptor number and distribution(69–72). With particular interest to our study where NMDA was used to simulate the activation of glutamatergic inputs to NVsnpr neurons and induce bursting, Rotta et al.(66) reported that undernutrition induced changes in glutamate release and sensitivity of a sub-type of glutamatergic receptors that were accompanied by changes in biting but not in locomotion. Undernutrition has also been shown to affect the γ-aminobutyric acid (GABA)ergic system in several ways (i.e. in the number of GABAergic neurons(73), the composition and sensitivity of GABAergic receptors(67,71) and the frequency of miniature inhibitory post-synaptic currents(74)). In a recent study, protein deficiency was associated with reduced sensory processing and a substantial increase in GAD65 neurons in the whisker barrel cortex(63). In the locomotor system, agonists of GABAA and GABAB receptors have been shown to reduce the frequency of bursting, whereas GABA uptake blockers (nipecotic acid) and a benzodiazepine receptor agonist induced a pronounced slowing of the NMDA-induced fictive locomotion(75). Thus, the reduced chewing frequency observed in our study may involve a similar effect of protein deficiency on the trigeminal GABAergic neurons.
Histochemical and morphologic analysis of muscle Finally, in an attempt at understanding how undernutrition may affect masticatory efficiency, we examined its impact on the composition of masseteric muscle fibres and on the cross-sectional area and perimeter of each fibre bundle of the superficial masseter, which determines the strength of chewing strokes required for food grinding during feeding behaviour.
Protein undernutrition during lactation increased the pro-portion of type IIAfibres and reduced the proportion of type IIB fibres in the superficial masseter muscle, suggesting a delay in phenotypical and morphological maturation of the masseter muscle. The surface region of the masseter muscle of mice is primarily composed of fast type II musclefibres(76,77). In thefirst 2 weeks of life, the type IIA fastfibres of oxidative–glycolytic metabolism largely predominate, but with functional maturation and transition from suckling to chewing the distribution of the faster contraction and less fatigue-resistant type IIB fibres of glycolytic metabolism increases(13). Thus, we expected to observe a larger number of type IIBfibres, as our assessments were performed soon after weaning in 25-d-old animals. Our findings of fewer fast type IIB fibres in undernourished animals are in accordance with those obtained with another model of
undernutrition, where the proportion of fast type IIfibres was diminished to the level of type Ifibres(78). The fewer fast type IIBfibres observed here may reflect a delay in the maturation of the masseter muscle, which may correspond to the delay in maturation of the bursting properties of NVsnpr neurons. The delayed maturation of the muscles may also result from the effects of protein undernutrition on testosterone levels. Studies have shown that neonatal low-protein diet may have a wide variety of effects on the endocrine system(79,80). With respect to the reproductive system, food restriction reduces the level of protein of an androgen receptor in the testes of adult rats(81), as well as decreases the weight of the testes, epididymis and prostate(81). Undernutrition also causes decreased serum con-centration of luteinizing hormone, follicle stimulating hormone and testosterone(81,82). Regarding the relationship between testosterone levels and development of skeletal muscles, studies show that the proportions of musclefibres of different phenotypes are androgen-mediated(83). Indeed, in several species, the muscles of mastication are sexually dimorphic relatively to the proportions of fibres of different pheno-types(76,84–86). The distinct fibre isoforms confer distinct contractibility properties to the muscle. Thus, through its effect on the endocrine system, undernutrition may affect muscle efficiency by changing its fibre composition.
Regarding morphometric parameters, we found that nutritional restriction led to a reduction in both the cross-sectional area and perimeter of the muscle fibres of type IIA and IIB. These results are in agreement with studies showing that perinatal undernutrition can induce muscle atrophy and may irreversibly change muscle morphology(20,21). This may result from the fact that perinatal undernutrition consequent to changes in the composition and volume of breast milk after restriction of maternal protein(35)can reduce cell proliferation and compromise the number of musclefibres and nuclei in the offspring(19).
The amount of strength that a muscle can produce depends not only on the type of myosin isoform but also on its cross-sectional area(87), which increases with the amount of resistance during contraction(88). This suggests that the force of contraction of the superficial masseter should diminish in undernourished animals, as both fastfibres showed smaller cross-sectional areas.
Our study has some limitations. For instance, the method used for mastication behaviour analysis is still somewhat rudi-mentary, requiring computer tools in order to improve its assessment. In addition, it would have been interesting to cover a larger age range in order to get a sense of development and determine whether the observed effects of undernutrition are merely the result of a delayed maturation or represent a per-manent shortfall that needs to be addressed. However, these limitations do not reduce the importance of ourfindings, as our study made it possible to demonstrate that neonatal protein deficiency affects masticatory efficiency by slowing, weakening and delaying maturation of the masticatory muscles and the associated neuronal circuitry.
Functional implications
In summary, behavioural, electrophysiological and morpho-logicalfindings of the present study suggest that animals whose
mothers were fed a low-protein diet during lactation have changes in masticatory function, leading to reduced masticatory efficiency. Impairment of mastication seems to lead to changes in the pattern of food intake, which may cause a deficit in nutrient intake, or even increase the likelihood of digestive diseases and reduce intestinal absorption(89). Dysfunction in mastication can lead to inappropriate selection of food(89)– that is, there is an increase in the consumption of soft and easy-to-chew food items and a decrease in the intake of hard foods such as vegetables and raw nuts,fibrous foods like meat and dry foods like breads(90). Studies in humans with altered mas-tication report a preference for processed foods over natural foods(89). This fact may favour the absorption of fat and mark-edly increased levels of cholesterol and saturated fatty acids. Given the above, there is a greater predisposition to obesity(91). Thus, to obtain a proper nutrition, besides eating foods rich in essential nutrients, we need food to be degraded properly.
Acknowledgements
We are grateful to Arlette Kolta and Dorly Verdier for his collaboration, teaching and carrying out Patch-clamp experiments conducted at the Université de Montréal.
K. N. F. P. was the recipient of a doctoral fellowship from the Brazilian Coordenação de Aperfeiçoamento de Pessoal de Nível Superior (CAPES). The present study was partially supported by the Programa de Doutorando no Brasil com Estágio no Exterior – PDEE (BEX 6770/10-0) and partially supported by a grant of the Canadian Institutes for Health Research (CIHR: grant number 14392). The funders had no role in the design and analysis of the study or in the writing of this article.
K. N. F. P., A. K. and R. M. d. C. conceived the study, designed the experiments, analysed the data and wrote the manuscript; R. d. S. A., D. V., D. C. L. and A. E. T. carried out some of the experiments and contributed to the writing of the manuscript. All the authors read and approved thefinal version of the manuscript.
There are no conflicts of interest to declare.
References
1. Westneat MW & Hall WG (1992) Ontogeny of feeding motor patterns in infant rats: an electromyographic analysis of suckling and chewing. Behav Neurosci 106, 539–554. 2. Gojo K, Abe S & Ide Y (2002) Characteristics of myofibres in
the masseter muscle of mice during postnatal growth period. Anat Histol Embryol 31, 105–112.
3. Kogo M, Funk GD & Chandler SH (1996) Rhythmical oral-motor activity recorded in an in vitro brainstem pre-paration. Somatosens Mot Res 13, 39–48.
4. Nakamura Y, Katakura N & Nakajima M (1999) Generation of rhythmical ingestive activities of the trigeminal, facial, and hypoglossal motoneurons in in vitro CNS preparations isolated from rats and mice. J Med Dent Sci 46, 63–73. 5. Tanaka S, Kogo M, Chandler SH, et al. (1999) Localization of
oral-motor rhythmogenic circuits in the isolated rat brainstem preparation. Brain Res 821, 190–199.
6. Tsuboi A, Kolta A, Chen CC, et al. (2003) Neurons of the trigeminal main sensory nucleus participate in the generation of rhythmic motor patterns. Eur J Neurosci 17, 229–238. 7. Kolta A, Westberg KG & Lund JP (2000) Identification of
brainstem interneurons projecting to the trigeminal motor nucleus and adjacent structures in the rabbit. J Chem Neuroanat 19, 175–195.
8. Li YQ, Takada M & Mizuno N (1993) Identification of pre-motor interneurons which project bilaterally to the trigeminal motor, facial or hypoglossal nuclei: a fluorescent retrograde double-labeling study in the rat. Brain Res 611, 160–164. 9. Athanassiadis T, Olsson KA, Kolta A, et al. (2005) Identi
fica-tion of c-Fos immunoreactive brainstem neurons activated during fictive mastication in the rabbit. Exp Brain Res 165, 478–489.
10. Brocard F, Verdier D, Arsenault I, et al. (2006) Emergence of intrinsic bursting in trigeminal sensory neurons parallels the acquisition of mastication in weanling rats. J Neurophysiol 96, 2410–2424.
11. Perry SV (1970) Biochemical adaptation during development and growth in a skeletal muscle. In The Physiology and Biochemistry of Muscle as a Food, vol. 2, pp. 537–553 [EJ Briskey, RG Cassens and BB Marsh, editors]. Madison, WI: University of Wisconsin Press.
12. Shida T, Abe S, Sakiyama K, et al. (2005) Superficial and deep layer muscle fibre properties of the mouse masseter before and after weaning. Arch Oral Biol 50, 65–71.
13. Langenbach GE, van Wessel T, Brugman P, et al. (2008) Is fiber-type composition related to daily jaw muscle activity during postnatal development? Cells Tissues Organs 187, 307–315.
14. Lucas A, Fewtrell MS & Cole TJ (1999) Fetal origins of adult disease-the hypothesis revisited. BMJ 319, 245–249. 15. Lucas A (1998) Programming by early nutrition: an
experi-mental approach. J Nutr 128, 401S–406S.
16. Tuchscherer M, Otten W, Kanitz E, et al. (2012) Effects of inadequate maternal dietary protein:carbohydrate ratios during pregnancy on offspring immunity in pigs. BMC Vet Res 8, 232.
17. Resnick O, Miller M, Forbes W, et al. (1979) Developmental protein malnutrition: influences on the central nervous system of the rat. Neurosc Biobehav Rev 3, 233–246.
18. Lopes de Souza S, Orozco-Solis R, Grit I, et al. (2008) Perinatal protein restriction reduces the inhibitory action of serotonin on food intake. Eur J Neurosci 27, 1400–1408.
19. Toscano AE, Manhaes-de-Castro R & Canon F (2008) Effect of a low-protein diet during pregnancy on skeletal muscle mechanical properties of offspring rats. Nutrition 24, 270–278. 20. Park KS, Kim SK, Kim MS, et al. (2003) Fetal and early post-natal protein malnutrition cause long-term changes in rat liver and muscle mitochondria. J Nutr 133, 3085–3090.
21. Bayol S, Jones D, Goldspink G, et al. (2004) The influence of undernutrition during gestation on skeletal muscle cellularity and on the expression of genes that control muscle growth. Br J Nutr 91, 331–339.
22. Alippi RM, Meta MD, Olivera MI, et al. (2002) Effect of protein-energy malnutrition in early life on the dimensions and bone quality of the adult rat mandible. Arch Oral Biol 47, 47–53. 23. Bozzini C, Barcelo AC, Alippi RM, et al. (1989) The
con-centration of dietary casein required for normal mandibular growth in the rat. J Dental Res 68, 840–842.
24. Menaker L & Navia JM (1973) Effect of undernutrition during the perinatal period on caries development in the rat. IV. Effects of differential tooth eruption and exposure to a cario-genic diet on subsequent dental caries incidence. J Dental Res 52, 692–697.