ISMRE2018/XXXX-2018 ALGERIA
Experimental investigation on friction coefficient
and wear under different normal loads and sliding
speed for different materials pairs
1
stBougoffa Mohammed Seyf Eddine, 2
ndSayah Tahar .
1st Laboratoire de Science et Génie des Matériaux, Faculté de Génie Mécanique et Procédés U.S.T.H.B, B.P. 32 El Alia, Bab Ezzouar, Alger 16111, Algérie,
2nd Laboratoire de Science et Génie des Matériaux, Faculté de Génie Mécanique et Procédés U.S.T.H.B, B.P. 32 El Alia, Bab Ezzouar, Alger 16111, Algérie,
……… Seif.bougoffa@gmail.com
Abstract—In the present research, friction coefficients of
different materials pairs are investigated and compared. Using CSM tribometer. Experiments are carried out when different types of samples such as aluminum and brass slide on steel pin. Experiments are conducted at normal load 3,5,8 and 10 N, sliding velocity 0.24, 0.35 and 0.48 m/s. Variations of friction coefficient with the duration of friction at different normal load and sliding velocity are investigated. Results show that the friction coefficient decreases with the increase of normal load and sliding velocity for all the tested pairs. On the other hand It is also found that the mass loss increase with the increase of normal load and sliding velocity.
Keywords—Friction coefficient, Normal load, Sliding velocity, Mass loss.
I. INTRODUCTION
It is known that friction coefficient depends on a number of parameters as normal load, geometry, relative surface motion, sliding velocity, temperature, relative humidity such, lubrication and vibration [1-2]. Among these factors normal load and sliding velocity are the two major factors that play significant role for the variation of friction, the coefficient of friction may not remain constant as a function of load in the case of materials with surface films which are either deliberately applied or produced by reaction with environment. For most materials the friction coefficient is low at low loads and a transition occurs to a higher value as the normal load is increased. Friction may increase or decrease as a result of increased sliding velocity for different materials combinations. At low loads, the oxide film effectively increase separation between the two surfaces which will decrease the real area of contact, hence the friction coefficient is low. Furthermore, the third law of friction, which states that friction is independent of velocity, is not generally valid. Friction reduction is due to negative slope of the dependence of the friction force upon velocity because the friction force is a function of velocity and time of contact. Also when velocity increases, momentum transfer in the normal direction increases producing an upward force on the upper surface. This results in a little or no true metallic contact [3]. At higher load conditions, the film breaks down, resulting in intimate metallic contact, which is responsible for higher friction [4]. It was observed that the coefficient of friction may be very low for very smooth surfaces and/or at loads down to micro-to-nanonewton range
[5, 6]. Generally, Friction coefficient and wear rate of metals and alloys showed different behavior under different operating conditions [7,8,9,10]. Although numerous studies have been conducted to further investigate and enhance the properties of these materials, however, the friction and wear behavior of aluminum and brass are not entirely clear. The main aim of the present article is to investigate the effects of normal load and sliding velocity on friction coefficient of different material pairs to improve performance and quality in industry.
II. EXPERIMENTAL METHOD
A. Experimental device
The tests were carried out on a tribometer brand CSM. a cylindrical mass posed in its medium on an axis being used as support. The support of the mass transmits the normal force (1), by actuating the lever (2), with the pawn (3) fixed by bite (4) rotated by an electrical motor (5). The coefficient of friction is determined during the tests by measuring the mass loss for the pion by determining the loss of volume during the test. This simple method facilitates the study of the mechanisms of friction for a large variety of material couple without agent of lubrication. Moreover, the control of the parameters of test such as speed, the contact pressure, the frequency, the duration of test as well as the environmental parameters (temperature, hygroscope, lubrication) make it possible to reproduce the real requests of use of these materials. The materials chosen in this investigation are Aluminum and brass.
Fig. 1. View of the CSM Tribometer B. Experimental procedure
The detail experimental conditions are shown in Table 1.
TABLEI.EXPERIMENTAL CONDITIONS. N ° Parameters Operating conditions
1 Normal load (N) 3, 5, 8, 10 2 Sliding velocity (m/s) 0.24, 0.35, 0.48 3 Sliding distance (m) 432, 630, 882 4 Duration of the test (s) 1800 5 Average surface
roughness of samples 0.5 - 0.7 µm 6 Surface condition Dry 7 Temperature(°c) 20(±1) 8 Relative humidity 40(±1) %
9 Pin material steel
10 Material of samples Brass aluminum
III. RESULTS
A. Effect of normal load on friction coefficient
Fig. 2 and 3 shows the variation of friction coefficient with respect to time at different normal load for Aluminum and brass.
Fig. 2. Variation of Coefficient of friction with respect to time at different normal load (sliding velocity: 0.35 m/s; pair
Steel-Aluminum).
Fig. 3. Variation of Coefficient of friction with respect to time at different normal load (sliding velocity: 0.35 m/s; pair Steel-Brass).
Curve 1 of these two figures is drawn for normal load 3N. From this curve, it is observed that at the initial duration of friction, the value of friction coefficient in steel-aluminum and steel-brass pair respectively is 0.40 and 0.20 and then increases very steadily up to 0.45 and 0.60 over a duration of 360 and 1008 seconds of friction and after that it remains constant for the rest of the experimental time. At the initial stage of friction test, friction is low and the factors responsible for this low friction are due to the presence of a layer of foreign material on the disc surface. This layer on the disc surface in general comprises of (i) moisture, (ii) oxide of metals, (iii) deposited lubricating material, etc. Copper readily oxidizes in air, so that, at initial duration of friction, the oxide film easily separates the two material surfaces and there is little or no true metallic contact and also the oxide film has low shear strength. After initial friction, the film (deposited layer) breaks up and clean surfaces come in contact which increase the bonding force between the contacting surfaces. At the same time due to the ploughing effect, inclusion of trapped wear particles and roughening of the disc surface, the friction force increases with duration of friction. After certain duration of friction, the increase of roughness and other parameters may reach to a certain steady state value and hence the values of friction coefficient remain constant for the rest of the time. Curves 2,3 and 4 of these figures are drawn for normal load 5,8 and 10 N respectively and show similar trends as that of curve 1.
From these curves, it is also observed that time to reach steady state value is different for different normal load. Results show that at normal load 3,5,8 and 10 N, steel-aluminum takes 360, 200,350 and 359 Seconds respectively to reach steady friction. It indicates that the higher the normal load, the time to reach steady friction is less. This is because the surface roughness and other parameter attain a steady level at a shorter period of time with the increase in normal load. The trends of these results are similar to the results of Chowdhury and Helali [11, 12]. Similar trends are observed for steel-brass.
Figure 4 shows the comparison of the variation of friction coefficient with normal load for the above said material pairs. Curves of this figure are drawn for steel-brass and steel-aluminum pairs. It is shown that friction coefficient varies from 0.41 to 0.25 and 0.40 to 0.38 with the variation of normal load from 3 to 10 N for brass and steel-aluminum pairs respectively. These results show that friction coefficient decreases with the increase in normal load. Increased surface roughening and a large quantity of wear
debris are believed to be responsible for the decrease in friction [13, 14] with the increase in normal load. Similar behavior is obtained for Al–Stainless steel pair [15] i.e friction coefficient decreases with the increase in normal load. Vince (1785) also noted that the friction coefficient decreases with increasing N pressure and that, for a given pressure, it decreases with increasing pressure P and that, for given pressure, it decreases as the contact area becomes small. 0 0.1 0.2 0.3 0.4 0.5 3N 5N 8N 10N C O F Load (N) aluminum brass
Fig. 4. Variation of coefficient of friction with the variation of normal load (Sliding velocity: 0.35 m/s; different pair). From the obtained results, it can also be seen that the highest values of the friction coefficient are obtained for steel-aluminum pair and the lowest values of friction coefficient are obtained for steel-brass pair.
B. Effect of Sliding velocity on friction coefficient
Fig. 5 and 6 shows the variation coefficient of friction with the respect to time at different sliding speed for different materials pair. The curve in Fig. 5 drawn for speed 0.24 m/s shows the variation of coefficient of friction of aluminum and brass with duration of friction. During the starting, value coefficient of friction is 0.17 which remains constant for few seconds then increases almost linearly up to 0.40 over a duration of 80 seconds of friction and after that it remains constant for the rest of the experimental time. Other curves of this figure show the values of coefficient of friction at 0.35 and 0.48 m/s sliding speed.
All these curves show similar trend as before. Other parameters such as normal load (5 N), surface roughness (0.5 - 0.7 µm) and Room temperature are identical for these curves. These findings are in agreement with the findings of Chowdhury and Helali [16, 17] for mild steel and composite materials. In the curves of Fig. 5 and 6 it is also seen that the values of friction co-efficient decreases with the increase of sliding speed. These results are presented in Fig. 7. The decrease of friction coefficient of brass and aluminum with the increase of sliding speed may be due to the change in the shear rate which can influence the mechanical properties of the mating materials. The strength of these materials is greater at higher shear strain rates [18, 19] which results in a lower real area of contact and a lower coefficient of friction in dry contact condition. These findings are in agreement with the findings of Chowdhury and Helali [11] for mild steel, ebonite and GFRP sliding against mild steel and It has also been confirmed by M. Fellah et al. [20]. Desaguilers (1734) also noted that the friction of the moving body is proportional to speed. Bochet (1858) presented a mechanical study to link the value of the sliding friction coefficient to
the speed of movement. It was found that the sliding friction of the intensity decreases as the speed increases. Galton (1878) and Deprez (1884) also found that the coefficient of friction decreases with increasing speed. Mercier & Dubois (1937) were interested in the variations of the friction coefficient with speed. They found that for high speeds, as for high pressure, the variations of the friction coefficient are slower.
Fig. 5. variation coefficient of friction with the respect to time at different sliding velocity (Normal load =3N; Steel-Aluminum).
Fig. 6. variation coefficient of friction with the respect to time at different sliding velocity (Normal load =3N; Steel-Brass).
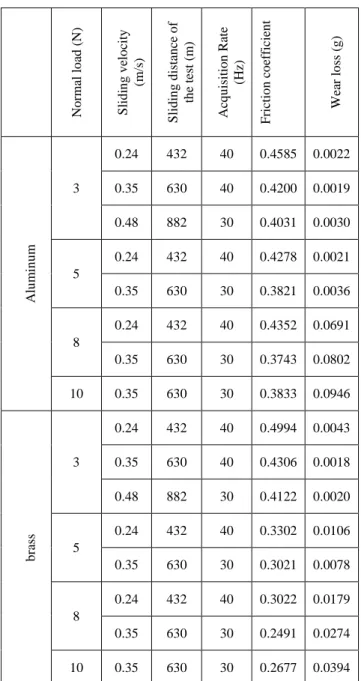
Fig. 7. Variation of friction coefficient with the variation of sliding velocity (Normal load =3N; different materials pair). Table 2 shows Characteristics of specimen’s conditions of the tests and Friction coefficient at different normal loads for different material pairs (sliding velocity: 0.24, 0.35 and 0.48 m/s).
TABLE II. Friction coefficient at different normal loads for different material pairs (sliding velocity: 0.24, 0.35 and 0.48 m/s)
M
ate
No rm al lo ad (N) S li d in g v elo cit y (m /s) S li d in g d istan ce o f th e tes t (m ) Ac q u isit io n Ra te (Hz ) F rictio n c o efficie n t Wea r lo ss (g ) Alu m in u m 3 0.24 432 40 0.4585 0.0022 0.35 630 40 0.4200 0.0019 0.48 882 30 0.4031 0.0030 5 0.24 432 40 0.4278 0.0021 0.35 630 30 0.3821 0.0036 8 0.24 432 40 0.4352 0.0691 0.35 630 30 0.3743 0.0802 10 0.35 630 30 0.3833 0.0946 b ra ss 3 0.24 432 40 0.4994 0.0043 0.35 630 40 0.4306 0.0018 0.48 882 30 0.4122 0.0020 5 0.24 432 40 0.3302 0.0106 0.35 630 30 0.3021 0.0078 8 0.24 432 40 0.3022 0.0179 0.35 630 30 0.2491 0.0274 10 0.35 630 30 0.2677 0.0394
C. Effect of load and Sliding velocity on wear
Several experiments are carried out to observe the effect of normal load and sliding speed on mass loss of aluminum. Curve of Fig. 9 shows the variation of mass loss with the variation of speed. From this figure, it is observed that mass loss increases with the increase of sliding speed. This is due to the fact that duration of friction is the same for all sliding speed, while the length of friction is more in case of higher speed [10]. The materials mild steel-mild steel couples [10] also show similar behavior i.e. mass loss increases with the increase of sliding speed. Figure 8 indicates the variation of mass loss with normal load. The curve of the figure shows that mass loss increases with the increase of normal load. This is due to the fact as the normal load increases frictional heat generates at the contact surface and hence strength of materials decreases.
Fig. 8. Variation of wear loss with the variation of normal load (Sliding Speed =0.35 m/s; different materials pair).
Fig. 9. Variation of wear loss with the variation of sliding speed (Normal load =3N; different materials pair)
IV. CONCLUSIONS
The presence of normal load and sliding velocity indeed affects the friction force considerably. The values of friction coefficient decrease with the increase in normal load for steel-brass, and steel-aluminium pairs. Also, the values of friction coefficient increase with the increase in sliding velocity for the tested material pairs. Friction coefficient varies with the duration of friction and after certain duration of test, friction coefficient becomes steady for the observed range of normal load and sliding velocity. Generally, the results were converged but the highest values of the friction coefficient are obtained for steel-aluminium pair and the lowest values of friction coefficient are obtained for steel-brass pair. The mass loss, on the other hand, increase with the increase of sliding speed and normal load. As the (i) the friction coefficient decreases and (ii) mass loss increases with the increase of normal load and sliding speed, therefore maintaining appropriate level of sliding speed and normal load friction and wear may be kept to some lower value to improve mechanical processes.
ACKNOWLEDGMENT
Several experiments in this work were conducted outside our laboratory for that, the authors would like to thank: LSDM laboratory (USTHB University).
REFERENCES
[1] M.B. Peterson and W.O. Winer, Wear Theory and Mechanisms, Wear Control Handbook. ASME, New York, NY, pp. 35-80, 1980. [2] B. Bhushan, Principle and Applications of Tribology. New York:
John Wiley & Sons, Inc, 1999.
[3] H. D. Fridman, P. Levesque, Reduction of static friction by sonic vibrations, J. Appl. Phys,Vol. 30, pp. 1572-1575, (1959).
[4] E. Rabinowicz, Friction and Wear of Materials, 2nd Edition, Wiley, (1995).
[5] B. Bhushan, Handbook of Micro/Nanotribology, 2nd edition, CRC Press, (1999).
[6] B. Bhushan, A. V. Kulkarni, Effect of Normal Load on Microscale Friction Measurements, Thin Solid Films, Vol. 278, 49-56, 293, 333 (1996).
[7] M.A. Chowdhury, M.M. Helali, 'The Effect of Relative Humidity and Roughness on the Friction Coefficient under Horizontal Vibration', The Open Mechanical Engineering Journal, vol. 2, pp. 128- 135, 2008.
[8] M. Kandeva, L. Vasileva, R. Rangelov and S. Simeonova, 'Wear-resistance of Aluminum Matrix Microcomposite Materials', Tribology in Industry, vol. 33, no. 2, pp. 57-62, 2011.
[9] M.A. Chowdhury, D.M. Nuruzzaman, A.H. Mia, M.L. Rahaman, Friction Coefficient of Different Material Pairs Under Different Normal Loads and Sliding Velocities, Tribology in Industry, Vol. 34, No 1 (2012) 18-23.
[10] M.A. Chowdhury a, D.M. Nuruzzaman, Experimental Investigation on Friction and Wear Properties of Different Steel Materials, Tribology in Industry, Vol. 35, No. 1 (2013) 42‐50.
[11] M.A. Chowdhury, M.M. Helali: The Effect of frequency of Vibration and Humidity on the Coefficient of Friction, Tribology International, Vol. 39, No. 9, pp. 958 – 962, 2006.
[12] M.A. Chowdhury, M.M. Helali: The Effect of Amplitude of Vibration on the Coefficient of Friction, Tribology International, Vol. 41, No. 4, pp. 307‐ 314, 2008.
[13] B. Bhushan: Tribology and Mechanics of Magnetic Storage Devices, 2nd edition, Springer‐Verlag, New York, 1996.
[14] P.J. Blau: Scale Effects in Sliding Friction: An Experimental Study, in Fundamentals of Friction: Macroscopic and Microscopic Processes (I.L., Singer and H. M., Pollock, eds.), Vol. E220, pp. 523‐534, Kluwer Academic, Dordrecht, Netherlands, 1992.
[15] M.A. Chowdhury, M.K. Khalil, D.M, Nuruzzaman, M.L. Rahaman: The Effect of Sliding Speed and Normal Load on Friction and Wear Property of Aluminum, International Journal of Mechanical & Mechatronics Engineering, Vol. 11, No. 1, pp. 53‐57. 2011. [16] M. A. Chowdhury, M. M. Helali, The frictional behavior of mild steel
under horizontal vibration. Tribology International, Vol. 42, pp. (946-950) 2009.
[17] M. A. Chowdhury, M. M. Helali, The frictional behavior of composite materials under horizontal vibration. Industrial Lubrication and Tribology, Vol. 61, Issue 5, pp. 246-253, (2009).
[18] B. Bhushan, W. E. Jahsman, Propagat ion of Weak Waves in Elast ic- Plast ic and Elast ic-viscoplast ic Solids With interfaces, Int. J. Solids and Struc.,Vol. 14, 39-51, (1978).
[19] B. Bhushan, W. E. Jahsman, Measurement of Dynamic Material Behavior under Nearly Uniaxial St rain Condit ion, Int. J. Solids and Struc., Vol. 14, 739-753,(1978).
[20] M. Fellah, M. Abdul samed, M. Labaïz, O. Assala, L. Dekhil, I. Alain, “Sliding friction and wear performance of the nano-bioceramic á-Al2O3 prepared by high energy milling”. Tribology international, 91, 151-159 (2015).