HAL Id: tel-01950349
https://tel.archives-ouvertes.fr/tel-01950349
Submitted on 10 Dec 2018
HAL is a multi-disciplinary open access archive for the deposit and dissemination of sci-entific research documents, whether they are pub-lished or not. The documents may come from teaching and research institutions in France or abroad, or from public or private research centers.
L’archive ouverte pluridisciplinaire HAL, est destinée au dépôt et à la diffusion de documents scientifiques de niveau recherche, publiés ou non, émanant des établissements d’enseignement et de recherche français ou étrangers, des laboratoires publics ou privés.
formation : application to uranium
Flavia Marina Serafim Maia
To cite this version:
Flavia Marina Serafim Maia. Impact of increasing temperature up to 80 °C on the behaviour of radionuclides in the Callovo-oxfordian formation : application to uranium. Earth Sciences. Ecole na-tionale supérieure Mines-Télécom Atlantique, 2018. English. �NNT : 2018IMTA0078�. �tel-01950349�
T
HESE DE DOCTORAT DE
L
’É
COLEN
ATIONALES
UPERIEUREM
INES-T
ELECOMA
TLANTIQUEB
RETAGNEP
AYS DE LAL
OIRE-
IMT
A
TLANTIQUECOMUE UNIVERSITE BRETAGNE LOIRE
ECOLE DOCTORALE N°596 Matière, Molécules, Matériaux Spécialité : Science des Matériaux
Impact de l’élévation de la température jusqu’à 80°C sur le
comporte-ment des radionucléides dans le Callovo-Oxfordien : application à
l’uranium
Thèse présentée et soutenue à Nantes, le 30/05/2018
Unité de recherche : Subatech – Laboratoire de Physique Subatomique et des Technologies Associées Thèse N° : 2018IMTA0078
Par
Flávia Marina Serafim MAIA
Rapporteurs avant soutenance :
Christophe Tournassat HDR, Ing. de Recherche, BRGM Emmanuel Tertre Professeur, Université de Poitiers
Composition du Jury :
Président : Bernd Grambow Professeur à IMTA, Subatech Examinateurs : Christophe Tournassat HDR, Ing. de Recherche, BRGM
Emmanuel Tertre Professeur, Université de Poitiers Bart Baeyens Chercheur Dr., PSI
Gilles Berger HDR, IRAP Dir. de thèse : Gilles Montavon HDR, Subatech
Co-dir. de thèse : Mireia Grivé Docteur, Amphos21 Consulting S.L. Spain
Invité(s)
Lara Duro Docteur, Amphos21 Consulting S.L. Thomas Vercouter Chercheur Dr., CEA Saclay
D
OCTORAL
T
HESIS FROM
IMT
ATLANTIQUE
COMUE UNIVERSITY OF BRETAGNE LOIRE
DOCTORAL SCHOOL N°596 Matter Molecules and Material Specialisation: Material Sciences
by
Flávia Marina Serafim MAIA
Impact of increasing the temperature up to 80 ºC on the
behav-iour of radionuclides in the Callovo-Oxfordian Formation:
appli-cation to Uranium
Thèse présentée et soutenue à Nantes, le 30/05/2018
Unité de recherche : Subatech – Laboratoire de Physique Subatomique et des Technologies Associées
Thèse N°:2018IMTA0078
Reviewers before defence:
Christophe Tournassat HDR, Research Eng., BRGM Emmanuel Tertre Professor, Université de Poitiers
Composition du Jury :
President: Bernd Grambow IMTA Professor, Subatech Reviewers: Christophe Tournassat HDR, Research Eng., BRGM
Emmanuel Tertre Professor, University of Poitiers Bart Baeyens PhD. Researcher, PSI
Gilles Berger HDR, IRAP Thesis director: Gilles Montavon HDR, Subatech
Thesis Co-dir.: Mireia Grivé PhD., Amphos21 Consulting S.L.
Inviter(s)
Lara Duro PhD., Amphos21 Consulting S.L. Thomas Vercouter PhD. Researcher, CEA Saclay Benoît Madé PhD., Andra
Aos meus mais que tudo: Mãe, Pai e a minha querida irmã Cristina
Acknowledgements
I am not a person of many writing words, I spent most of my time talking and all my thanks were given to each one of you in particular and by person. Although, I want to leave it registered here. Most probably I will forget someone, but no hard feelings on me please! It’s already quite difficult to find the right words to describe what each one of you have contributed for this period of my life. First and foremost, I would like to thank my parent as this thesis came to existence due to their amaz-ing support, not only because they are my parents and gave birth to me but also because of their enthusiastic motivation to always follow my dreams and goals, and especially for their patience for my curiosity and questioning everything!
Thanks go to my supervisors for their support during this project. Mireia Grivé, I want to thank her for first inviting me to start this PhD. Our distance made the communication between us more difficult but in the end, I am thankful to her for being there in the crucial moments of this long journey. To Gilles Montavon, I thank him for all his time, dedication and support during these 3 ½ years. Espe-cially for being there whenever needed, always finding the time among his numerous students and for our long discussions into late Friday afternoons.
This thesis could not have been done without the financial support from Andra. Andra is thanked for the GL-CTEC PhD scholarship which allowed me to undertake this project. I am therefore thankful to Benoît Madé and Eric Giffaut, from Andra, for their supervision and direction.
I must also thank Subatech especially the Radiochemistry group for the warmly welcome. I thank in particular Solange Ribet, Céline Bailly and Axelle Dupont for their help, discussions and technical support. Also, Catherine Landesman for out scientific discussions.
To my AMAZING colleagues and friends at Subatech: Iuliia, Ning, Christophe, Benjamin, Hugues, Andreas, Yahaya, Soumaya, Amaury, Arnaud and Étienne thank all of you guys for our long frenchinglish coffee times and for making my days at work cheerful and very pleasant.
Very special thanks to Ona, Bea, Laurent and Sara for their encouragement and for their emotional support given at the most difficult moments of this journey. Without you guys I would be most prob-ably doing something completely different by now! Not that that would be bad but the feeling of finishing a thesis awesome, without support I would never be able to live this! Oh, additional thanks to Sara for her excellent work on the edition of my manuscript and scientific advice for the writing of this thesis.
And last but not least, I thank the person that stayed by my side during the last period of this journey. I know that we have not known each other for long and we met during the most difficult and hard
phase of the PhD, the moment that I was about to finish it! I am very grateful to Adrien for his patience (sometimes not that much!) during my long days of writing and my mood swings. And most important of all for showing me that life is not only a PhD.
Table of Contents
Acknowledgements ... v
List of Figures ...xi
List of Tables ... xvii
Résumé Étendu ... xxiii
Chaper 1 Introduction ... 29
1.1. Context ... 31
1.1.1. Characterisation of the Callovo-Oxfordian Formation System ... 32
1.1.1.1. Chemical composition of the Callovo-Oxfordian porewater ... 34
1.2. Scopes of the thesis work ... 35
1.3. References ... 36
Chaper 2 Speciation of Ca-U(VI)-CO3 ternary complexes ... 39
2.1. Introduction ... 39
2.1.1. Ca-U(VI)-CO3 system ... 39
2.1.1. Mg-U(VI)-CO3 system ... 42
2.1.1. Effect of temperature ... 42
2.2. Determination of the thermodynamic data of Ca-U(VI)-CO3 aqueous species... 44
2.2.1. Ionic Exchange Method ... 44
2.2.1.1. Experimental approach ... 45
2.2.1.1.1. Materials and Solutions ... 45
2.2.1.1.2. Batch experiments ... 46
2.2.1.2. Conceptual model ... 48
2.2.1.2.1. Numerical approach ... 49
2.2.1.2.2. Application of the conceptual model on Dong and Brooks (2006) experimental data... 50
2.3. Results ... 51
2.3.1. Experimental tests ... 51
2.3.1.1. Controlling test on temperature and pCO2 ... 51
2.3.1.1.1. Controlling test on the initial concentration of U(VI) and electrolyte background ... 52
2.3.1.2.1. In the absence of calcium ... 54
2.3.1.2.2. In the presence of calcium ... 58
2.3.1.2.2.1. Fitting with PEST ... 59
2.3.1.2.2.2. Benchmark of fitting using 2D mapping ... 61
2.3.1.2.3. Evaluation of stability constants and enthalpy of reaction ... 62
2.3.1.2.4. Comparison with previous literature data ... 65
2.4. Summary ... 68
2.5. References ... 69
Chaper 3 Behaviour of Uranium in Callovo-Oxfordian Formation at 20 ºC ... 73
3.1. Introduction ... 73
3.1.1. Background ... 74
3.1.1.1. What are clay minerals? ... 74
3.1.1.2. What are the retention processes? ... 77
3.1.1.2.1. How to describe the retention processes? ... 77
The retention mechanisms: ... 78
Description and quantification of surface mechanisms: ... 79
3.1.1.2.2. How to interpolate sorption models on natural samples? ... 82
3.2. Experimental work ... 85
3.2.1. Uranium sorption edge and isotherm experiments ... 87
3.3. Sorption of U(VI) on illite ... 87
3.3.1. In the absence of carbonate ... 87
3.3.2. In the presence of carbonate ... 89
3.3.3. Impact of the presence of Ca-U(VI)-CO3 ... 95
3.4. Sorption of U(VI) on Callovo-Oxfordian clay fraction ... 97
3.4.1. In the absence of carbonate ... 97
3.4.2. In the presence of carbonate ... 97
3.4.3. Impact of the presence of Ca-U(VI)-CO3 ... 98
3.5. Sorption of U(VI) on Callovo-Oxfordian claystone ... 99
3.6. Summary ... 103
3.7. References ... 105
Chaper 4 Impact of the temperature on the sorption of U(VI) in the Callovo-Oxfordian Formation ... 109
4.1. Introduction ... 109
4.1.1. Thermodynamic parameters for sorption processes ... 110
Protolysis reactions: ... 110
Ionic exchange and surface complexation reactions: ... 111
4.2. Effect of the temperature on the adsorption processes of uranium on clays and clay minerals ... 112
4.2.1. Experimental approach ... 112
4.2.2. Model Approach ... 113
4.2.3. U(VI)/illite system in temperature up to 80ºC ... 116
4.2.3.1. In the absence of carbonate ... 116
Experimental data: ... 116
Modelling results: ... 117
4.2.3.2. In the presence of carbonate ... 124
Experimental data: ... 124
Modelling Results: ... 126
4.2.4. U(VI)/ Callovo-Oxfordian clay fraction system at 80ºC ... 128
4.2.5. Impact of Ca-U(VI)-CO3 on the retention of U(VI) at 80 ºC ... 130
4.3. Summary ... 132
4.4. References ... 134
Chaper 5 Conclusions ... 137
5.1. Perspectives ... 139
Appendix A: Material and Methods ... 141
A.1. ICP-MS analysis: ... 141
A.1.1. Optimisation method ... 141
Internal standard solution: ... 142
Internal standard correction: ... 142
Calibration curve: ... 142
A.2. TOC Analyser:... 144
Method of measurement ... 144
Uncertainty of measurement: ... 145
A.3. Determination of the alkalinity: ... 145
A.4. pH measurements ... 145
A.5. Stock solutions ... 146
Calcium, Sodium and carbonate: ... 146
Uranium: ... 146
Synthetic Callovo-Oxfordian porewater: ... 146
A.6. Solid phases: ... 147
Anion Exchange resin: ... 147
Callovo-Oxfordian claystone: ... 147
Callovo-Oxfordian clay fraction: ... 148
A.7. Batch experiments procedures ... 150
A.7.1. Open system (atmospheric conditions) procedure:... 151
A.7.2. Closed system (controlled atmosphere) procedure: ... 151
Appendix B: Auxiliary calculations ... 153
B.1. Calculation of the amount of exchanger considered in the resin ... 153
B.2. Calculation of the sorption parameters of clay minerals ... 153
B.3. Calculation of the concentration of U(VI) sorbed on the solid: ... 154
B.4. Calculation of distribution coefficient of U(VI): ... 154
Appendix C: Experimental results ... 155
C.1. Complementary tests ... 155
C.1.1. Temperature control test: ... 155
C.1.2. Sealing control test: ... 158
C.1.3. Tightness control test: ... 160
C.1.4. PPCO tubes control tests: ... 161
Total Organic Carbon: ... 161
C.2. Chemical composition of stock solutions: ... 164
C.3. Speciation of Ca-U(VI)-CO3 species experimental results: ... 164
C.4. Kinetic experiments ... 168
C.4.1. Callovo-Oxfordian claystone: ... 168
C.4.2. Illite: ... 169
C.5. Illite: sorption experiments ... 170
C.5.1. Sorption isotherms: ... 170
C.5.2. Sorption edges: ... 185
C.6. Callovo-Oxfordian clay fraction: sorption isotherm experiments ... 188
C.7. Callovo-Oxfordian claystone samples: isotherm experiments ... 194
Appendix D: Modelling results ... 197
D.1. Geochemical modelling literature data for the Ca-U(VI)-CO3 ternary species ... 197
D.2. Ionic exchange method ... 200
D.2.1. Type I experiments (ΔS/L): ... 200
D.2.2. Type II experiments (ΔCa): ... 201
Appendix E: Thermodynamic data ... 205
Appendix F: PEST and PhreeqC files ... 207
PEST input files: ... 207
20 ºC and 1% of CO2(g) as a function of S/L ratio ... 207
80 ºC and 5% of CO2(g) [U(VI)] as a function of calcium ... 210
List of Figures
Figure 1. Schematic representation of deep geological nuclear waste disposal multi-barrier system (1) Callovo-Oxfordian host-rock; (2) engineered barrier for IWL; (3) engineered barrier for HWL; (4) and (5) HWL primary package (e.g. vitrified waste). ... 30 Figure 2. Schematic pathway for the safety assessment of the nuclear disposal. ... 31 Figure 3. Schematic representation of U(VI) controlling processes in radioactive waste disposal system using host-clay rock. The main processes concerning in the present study are highlighted in red. ... 32 Figure 4. Geological location of the underground research laboratory within the Paris Basin (upper) and cross
section of the geological formations surrounding the underground research laboratory. Adapted from Linard et al., 2011. ... 33 Figure 5. Calculated U(VI) speciation as a function of calcium concentrations between 0 and 5∙10-3 M at 25 ºC,
[U(VI)]total = 1∙10-8 M, [CO32-]total = 3∙10-3 M, pH = 7.2 and ionic strength of 0.1 M using NaNO3 as electrolyte.
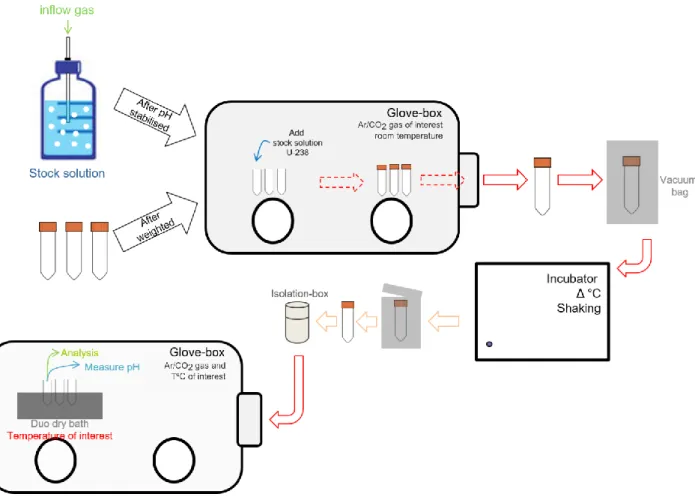
Calculations performed with ThermoChimie database v9b. ... 41 Figure 6. Scheme of the experimental set-up for the closed system experiments. ... 47 Figure 7. Experimental data originated from supporting information of Dong and Brooks (2006). Fit approach of
the a) U(VI) sorbed onto resin as function of U(VI) in equilibrium in solution and b) the distribution of U(VI) as a function of calcium. ... 50 Figure 8. Mineral saturation index as a function of Ca considered for a) Dong and Brooks (2006) using
ThermoChimie database Davies (2009) and b) Endrizzi and Rao (2014) using ThermoChimie database SIT (2014). ... 52 Figure 9. Concentration of U(VI) in solution as a function of the concentration of calcium in solution at pH of 7.8
(± 0.1), total [U(VI)] = 4.7 (± 0.3)·10-7 M, I = 0.1 (± 0.005) M NaClO
4, in atmospheric conditions and 20 °C.
... 54 Figure 10. Measured pH as a function of S/L ratio in the experiments in the absence of calcium at a) 20 ºC in
equilibrium with 1% of CO2(g) and b) 80 ºC in equilibrium with 5% of CO2(g). ... 55
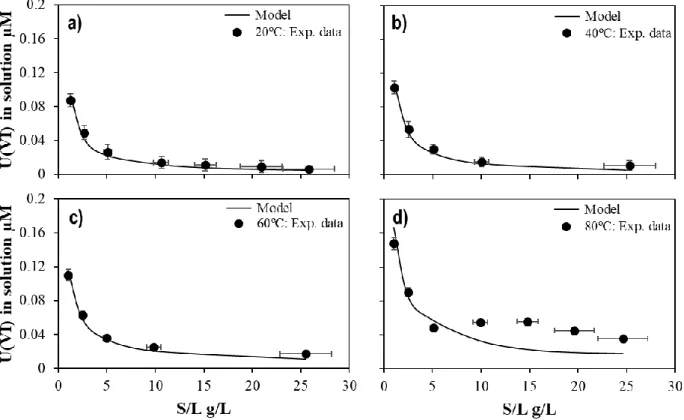
Figure 11. Speciation distribution of U(VI) in the absence of calcium in solution as a function of the temperature. ... 56 Figure 12. Concentration of U(VI) in the absence of calcium in solution as a function of the solid-liquid ratio (g/L)
at a) 20 ºC in equilibrium with 1% of CO2(g); b) 40 ºC in equilibrium with 1% of CO2(g); c) 60 ºC in equilibrium
with 3% of CO2(g); and d) 80 ºC in equilibrium with 5% of CO2(g). Solid-line: Model fitting of the concentration
of U(VI) as a function of the solid-liquid ratio at 20, 40, 60 and 80ºC. ... 55 Figure 13. Dependency of the calculated log10KX1 value from Reaction 10 with the temperature. ... 57
Figure 14. Concentration of U(VI) in equilibrium in solution as a function of calcium at different temperatures in 0.1 M of NaNO3. ... 58
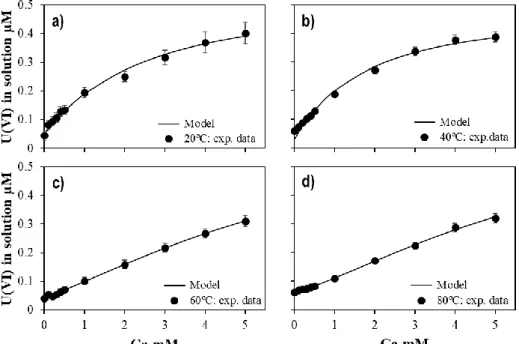
Figure 15. Symbols: Measured concentration of U(VI) for the Type II experiments as a function of the concentration of calcium at a) 20 ºC and b) 40 ºC in equilibrium with 1% of CO2(g); c) 60 ºC in equilibrium with 3% of CO2(g);
and d) 80 ºC in equilibrium with 5% of CO2(g). Solid-line: calculated U(VI) concentration using the model
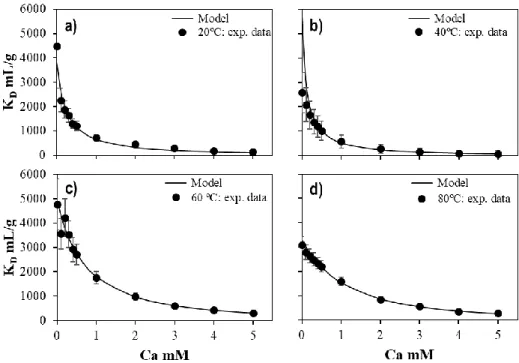
Figure 16. Symbols: Experimental KD of U(VI) for the experiments Type II as function of the concentration of
calcium at a) 20 ºC and b) 40 ºC in equilibrium with 1% of CO2(g); c) 60 ºC in equilibrium with 3% of CO2(g);
and d) 80 ºC in equilibrium with 5% of CO2(g). Solid-line: calculated U(VI) concentration using the model
proposed in the present work. ... 60 Figure 17. Temperature effect of the formation of CaUO2(CO3)32- (left) and Ca2UO2(CO3)3(aq) (right). ... 60
Figure 18. 2D mapping of the stability constants of Ca-U(VI)-CO3 aqueous complexes distribution at 20, 40, 60 and
80 ºC under respective pCO2. Squares: optimised values using PEST+Phreeqc; Circles: optimised values using
Excel+Phreeqc. ... 61 Figure 19. Dependency of the calculated log10β value for Reaction 1 (left) and Reaction 2 (right) with the
temperature using PEST-PhreeqC (black circles) and Excel-PhreeqC (white squares). ... 62 Figure 20. Variation of CaUO2(CO3)32- (left) and Ca2UO2(CO3)3(aq)(right) stability constants with the temperature.
Black: PEST approach. Red: 2D mapping approach. The lines represent least squares fitting following the constant enthalpy of the reaction equation. ... 63 Figure 21. Symbols: measured U(VI) concentration as a function of the concentration of calcium in solution for
Type II experiments at 20, 40, 60 and 80 ºC. Solid line: Calculated uranium concentration using the standard stability constant and enthalpy values from Table 14. ... 64 Figure 22. Symbols: experimental KD value for U(VI) as a function of the concentration of calcium in solution for
Type II experiments at 20, 40, 60 and 80 ºC. Solid line: Calculated KD using the standard stability constant and
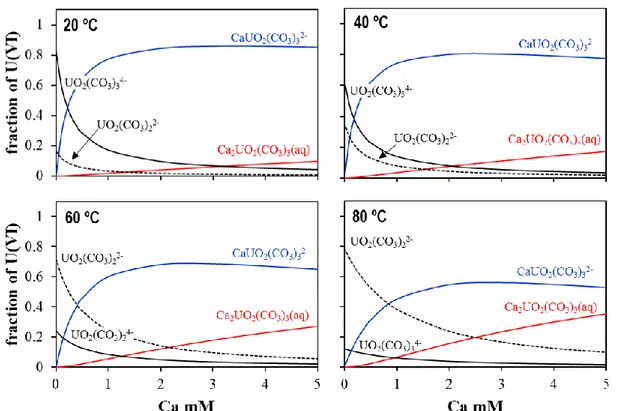
... 64 Figure 23. Calculated uranium aqueous speciation of the concentration of calcium in solution for Type II
experiments at 20, 40, 60 and 80 ºC... 65 Figure 24. Comparison of the stability constants at 25 ºC determined from different studies with the stability
constants determined in the present work (p.w.). KAL00: Kalmykov and Choppin (2000); BER01: Bernhard et al. (2001); DON06: Dong and Brooks (2006); LEE13: Lee and Yun (2013); END14: Endrizzi and Rao (2014); JO17: Jo and Yun (2017); p.w.: present work. ... 66 Figure 25. Calculated U(VI) aqueous speciation at calcium concentrations between 0 and 5·10-3 M at 25ºC. [U]
T =
1·10-8 M, [C]
T = 3·10-3 M, pH = 7.2 and I = 0.1 M. Left: Calculations performed using the stability constants
from Dong and Brooks for Ca-U(VI)-CO3 complexes. Right: Calculations performed using the stability
constants determined in the present work for Ca-U(VI)-CO3 complexes. ... 66
Figure 26. Symbols: measured U(VI) concentration as a function of the concentration of calcium in solution for experiments at 20, 40, 60 and 80ºC performed in present work. Blue-line: Calculated uranium concentration using the thermodynamic data for Ca-U(VI)-CO3 complexes determined in present work. Red-line: calculated
uranium concentration using the thermodynamic data for Ca-U(VI)-CO3 complexes reported in [1] Endrizzi and
Rao (2014). ... 68 Figure 27. Representation of a) aluminium oxyde octahedra, b) silicium oxyde tetrahedra, c) magnesium oxyde
octahedra, plan formed by combination of one tetrahedral sheet with d) one dioctrahedral sheet, and e) one trioctahedrical sheet. (Adapted from Ngouana, 2014). ... 75 Figure 28. Structural elements of phyllosilicates of tedrahedral and octahedral sheets linked to form a 1:1 layer type
structure and linked to form 2:1 layer type structure (Adapted from Sposito et al., 1999; http://www.pnas.org/content/96/7/3358). ... 75 Figure 29. Regular and random interstratified clay minerals. A and B are layers with different periodicity along the
c direction (Theng, 2012). ... 76 Figure 30. Schematic representation of cation exchange with one uranyl cation and two Na+ cations, and uranyl
surface complexation bond to the edge of surface. ... 79 Figure 31. Schematic representation of the placements of ions, charges (σ) potential (Ψ) and capacitances (C) for
Figure 32. a) Callovo-Oxfordian claystone sample: Sorption of 6.8 (±0.2)∙10-7 M of U(VI) as a function of time in
1% of CO2(g), synthetic COx porewater, pH of 7.3 (± 0.1) and S/L of 24 g/L. b) Illite: Sorption of 9.8 (±0.8)∙10 -8 M of U(VI) as a function of time in atmospheric pCO
2, 0.1 M of NaCl, pH 6.3 (± 0.1) and S/L of 0.5 g/L. .. 86
Figure 33. Speciation distribution of the aqueous uranyl species (left) and uranyl hydrolysis surface complexes (right) as function of the pH in the absence of carbonates at 0.1 M of NaNO3 in contact with illite with S/L of 2
g/L and U(VI)initial of 1.1(±0.05)∙10-7 M. ... 88
Figure 34. Comparison of the sorption edges of U(VI) on Na-illite in the absence of carbonates between p.w.: present work (0.1 M of NaNO3, S/L of 2 g/L and U(VI)initial of 1.1(±0.05)∙10-7 M) and [1] Bradbury and Baeyens (2009)
(0.1 M of NaClO4, S/L 2.6 g/L and U(VI)initial of 10-7 M). ... 88
Figure 35. Sorption isotherm of U(VI) onto Na-illite in the absence of carbonates in Ar(g) atmosphere at 0.1 M of NaNO3, S/L of 2 g/L and pH of 6.4. ... 89
Figure 36. Sorption isotherms of U(VI) on Na-illite in the absence of carbonates between present work (0.1 M of NaNO3 in S/L of 2 g/L and pH of 6.4) and work of Bradbury and Baeyens (2005) (0.1 M of NaClO4, S/L 2.6
g/L and pH of 5.8). ... 89 Figure 37. Sorption edges of U(VI) on illite in 0.1 M of NaNO3, S/L of 2 g/L and U(VI)initial of 1.1(±0.1)∙10-7 M, in
the absence (open circles) and presence (blue circles) of carbonates in equilibrium with atmospheric CO2. .... 90
Figure 38. Speciation distribution of the aqueous uranyl species (left) and uranyl hydrolysis and carbonato surface complexes (right) as function of the pH in the absence of carbonates at 0.1 M. ... 91 Figure 39. Model approach on sorption edge of U(VI) on illite. Model 0: neither ≡SsOUO2CO323- or
≡Ss,wOUO2CO3- are considered; Model I: considering the logK from Montmorillonite; Model II: only ≡SsOUO2CO323- with log10 K = 17.5 (±0.5) is considered; and Model III: the ≡SsOUO2CO323-, the
≡SsOUO2CO3- and ≡SwOUO2CO3- are considered, with log10 K of 17.5, 9.8 and 9.3, respectively. Error bars
that are not visible are smaller than the symbol size. ... 92 Figure 40. Sorption isotherms of U(VI) onto illite in the absence of carbonates (o) at equilibrium pH of 6.4 in 0.1
M of NaCl and presence of carbonates in equilibrium with atmospheric pCO2 (●) at equilibrium pH of 7.3 in 0.1
M of NaNO3. Error bars that are not visible are smaller than the symbol size. ... 93
Figure 41. Prediction model of sorption of U(VI) onto illite in equilibrium with pCO2 atmospheric in 0.1 M of
NaNO3 at pH 7.3. a) Model II: only ≡SsOUO2CO323- in considered; b) Model III: U(VI)-CO3 surface
complexation reactions from Table 24. Error bars that are not visible are smaller than the symbol size. ... 93 Figure 42. Sorption isotherms of U(VI) onto illite in the presence of carbonates in equilibrium with atmospheric
pCO2, 1% and 5% of CO2(g) in 0.1 NaNO3, pH fixed at 7.3 (● and ●), and 6.6 (●), respectively. Error bars that
are not visible are smaller than the symbol size. ... 94 Figure 43. Model approach for the sorption isotherms of U(VI) onto illite in 0.1 M of NaNO3, S/L of 2 g/L at pH
7.3 in equilibrium with 1% of CO2(g) (left top and bottom) and pH 6.6 in equilibrium with 5% of CO2(g) (right
top and bottom). Model II: only ≡SsOUO2CO323- in considered; Model III: U(VI)-CO3 surface complexation
reactions from Table 24. Error bars that are not visible are smaller than the symbol size. ... 95 Figure 44. Sorption isotherms of U(VI) on illite in the presence of 1% of CO2(g) under 0.1 M NaNO3 at pH 7.3 and
synthetic COx porewater at pH 7.1. Error bars that are not visible are smaller than the symbol size. ... 96 Figure 45. Sorption isotherms of U(VI) on illite as a function of the U(VI) in COx porewater in equilibrium with
1% of CO2(g). Model II: only ≡ 𝑺𝒔𝑶𝑼𝑶𝟐𝑪𝑶𝟑𝟐𝟑 − in considered taking also in account the thermodynamic
data for Ca-U(VI)-CO3 ternary complexes (see Chapter 2). Error bars that are not visible are smaller than the
symbol size. ... 96 Figure 46. a) Sorption isotherm of U(VI) onto (o) illite and (◊) Callovo-Oxfordian clay fraction (illite + I/S) in the
absence of carbonates in both 2 g/L under 0.1 M NaNO3 at pH of 6.4 and 7.0 (respectively). b) Sorption isotherm
of U(VI) onto (●) illite and (♦) Callovo-Oxfordian clay fraction (illite + I/S) in the presence of carbonates in equilibrium with 1% of CO2(g) in both 2 g/L under 0.1 M NaNO3 at pH of 7.3 and 7.2 (respectively). Model
approach for illite (solid-line) and for COx clay fraction (dash-line). Error bars that are not visible are smaller than the symbol size. ... 98
Figure 47. a) Sorption isotherms of U(VI) on 2 g/L of COx clay fraction (illite + I/S) in equibilibrium with 1% of CO2(g) in 0.1 M of NaNO3 (♦) and synthetic COx porewater (♦). b) Sorption isotherm of U(VI) on (●) 10 g/L
of illite and (♦) on 2 g/L of COx clay fraction (illite + I/S) in equilibrium with 1% of CO2(g) in synthetic COx
porewater conditions. Model approach for illite (solid-line) and for COx clay fraction (dash-line). Error bars that are not visible are smaller than the symbol size. ... 99 Figure 48. Sorption isotherm of U(VI) onto (●) illite and (♦) COx clay fraction (illite + I/S) and (□) Callovo-Oxfordian clays sample in equilibrium with 1% of CO2(g) in synthetic COx porewater conditions. Error bars
that are not visible are smaller than the symbol size. ... 100 Figure 49. Model approach (solid line) for sorption isotherm of U(VI) on Callovo-Oxfordian claystone samples in
equilibrium with pCO2 of 1% of CO2(g) in Callovo-Oxfordian synthetic porewater with pH 7.5. Error bars that
are not visible are smaller than the symbol size. ... 100 Figure 50. Experimental and model (black line) data from Hartmann et al. (2008) and the prediction model proposed
in the present work (red lines) considering the new stability constant ≡SsOUO2CO323- and its respective uncertainties. ... 101 Figure 51. Comparison of sorption isotherms of U(VI) on the Opalinus clay from [1] Joseph et al. (2011) and Boda
clay [2] Marques Fernandes et al. (2015) and [3] Amayri et al. (2016) with the COx clayey rock from the [p.w.] present work. ... 102 Figure 52. Model prediction for the sorption isotherms of U(VI) on a) OPA clay from [1] Joseph et al. (2011); b)
OPA clay from [2] Marques Fernandes et al. (2015); and c) Boda clay from [2] Marques Fernandes et al. (2015); [p.w.] COx clay from present work. Solid-lines: model approach proposed in present work; Dash-line: model uncertainties of the ≡SsOUO2CO323- (log10K = 17.5 ± 0.5)... 103 Figure 53. Impact of the temperature on the distribution coefficient of U(VI) as a function of the concentration of
U(VI) in equilibrium in COx claystone samples. (●) and (□) experimental data from the present work. red-line: model approach at 80ºC considering the model approach proposed in Chapter 3 and the thermodynamic parameters of U(VI) aqueous speciation (Chapter 2). ... 110 Figure 54. Linear relationship between Log10Kºx of aqueous species and Log10SKºx of surface complexes for illite
and montmorillonite, considering both hydrolysis complexes. Solid-line: correlation of illite surface complexation data; dashed-line: correlation of montmorillonite surface complexation data. ... 115 Figure 55. Distribution coefficient for the sorption of U(VI) at 1∙10-7 M of U(VI) onto illite as a function of pH in
0.1 M of NaNO3 in the absence of carbonates. Error bars that are not visible are smaller than the symbol size.
... 117 Figure 56. Temperature effect on the sorption isotherm of U(VI) onto illite in the absence of carbonates at pH of
equilibrium of 6.4−6.5 in 0.1 M of NaNO3. Error bars that are not visible are smaller than the symbol size. . 117
Figure 57. Distribution of U(VI) aqueous species as a function of the pH at 20ºC (solid lines) and 80ºC (dashed lines) in the absence of the carbonates. ... 118 Figure 58. Model approach for the distribution coefficient of U(VI) as a function of the pH at a) 20 ºC and b) 80 ºC
in the absence of carbonates. Model II: base model without enthalpy data (see Chapter 3); Model IV: model considering the correlation factor 1 with aqueous and surface complexes for enthalpy values (Table 33). Error bars that are not visible are smaller than the symbol size. ... 119 Figure 59. Model approach on sorption of isotherms of U(VI) in the absence of carbonates at a) 20 ºC; b) 60 ºC; and
c) 80 ºC. Model II: model approach without enthalpy values (see Chapter 3); Model IV: model approach considering the enthalpy values (see Table 33). Error bars that are not visible are smaller than the symbol size. ... 119 Figure 60. Distribution of U(VI) hydrolysis surface complexes of illite at 20ºC (solid-lines) and 80ºC (dashed-lines)
as a function of the pH. Calculations taking the parameters given in Table 33. ... 120 Figure 61. Fitting model for sorption edge experiments (a) at 20 ºC and (b) at 80 ºC (with ±0.2 log units of
uncertainty for the stability constants); for sorption isotherm experiments (c) at 20 ºC (with ±0.2 log units of uncertainty for the stability constants); (d) at 60 ºC and (e) at 80 ºC (with ±0.5 log units of uncertainty for the stability constants). Error bars that are not visible are smaller than the symbol size. ... 121
Figure 62. Relationship between Log10Kºx of aqueous species and Log10SKºx of surface complexes for illite
determined at 20, 60 and 80ºC in comparison with the respective standard stability constants at 25ºC (solid-line) for illite reported by Bradbury and Baeyens (2009). ... 122 Figure 63. Relation of constant of hydrolysis surface complexation (T) and standard constant of hydrolysis surface
complexation (T0) as a function of the 1/T0−1/T for the surface species a) ≡SsOUO2+, b) ≡SsOUO2OH, c)
≡SsOUO2(OH)2-, and d) ≡SsOUO2(OH)32-. Symbols: experimental data; Dashed-lines: regression line calculated for the enthalpy values. ... 122 Figure 64. Symbols: measured experimental data from sorption edge and isotherm of U(VI) at different
temperatures. Solid-lines: calculated U(VI) concentration using enthalpy values calculated from Table 35. Dashed-lines correspond to the uncertainty of the enthalpy values. Error bars that are not visible are smaller than the symbol size. ... 123 Figure 65. Distribution coefficient of U(VI) as a function of the pH in 0.1 NaCl a) in the absence or presence of
carbonates in equilibrium with pCO2 atmospheric at 80 ºC. Error bars that are not visible are smaller than the
symbol size. ... 124 Figure 66. Sorption isotherms of U(VI) on illite at different temperatures in equilibrium with a) Ar(g); b) pCO2
atmospheric; c) pCO2 of 1% of CO2(g); and d) pCO2 of 5% of CO2(g). Error bars that are not visible are smaller
than the symbol size. ... 125 Figure 67. Distribution of the speciation U(VI) in solution as a function of the pH at 20 (solid-lines) and 80 ºC
(dashed-lined) in equilibrium with pCO2 atmospheric. ... 126
Figure 68. Sorption edge of U(VI) in equilibrium with pCO2 atmospheric. Model V: enthalpy values considered
only for hydrolysis surface complexation reactions (Table 35). ... 127 Figure 69. Model approach considering only the enthalpy of the hydrolysis of surface complexes at different
temperatures in the presence of carbonates (see Table 35). Dashed-lines correspond to the uncertainty of the enthalpy values of the hydrolysis surface complexes. ... 127 Figure 70. Sorption isotherms of U(VI) on illite and Callovo-Oxfordian clay fraction (illite + I/S) system at 80 ºC
a) in the absence of carbonates and b) in the presence of carbonates in equilibrium with pCO2 of 5% of CO2(g).
... 128 Figure 71. Model approach for describing the sorption isotherms of U(VI) on Callovo-Oxfordian clay fraction (illite
+ I/S) at 20 and 80 ºC a) in the absence and b) in the presence of carbonates in equilibrium with 1% and 5% of CO2(g), respectively. Taking the thermodynamic parameters for illite and montmorillonite (see Table 39) the
solid-lines correspond to the model prediction at 20ºC; and the dashed-lines correspond to the model prediction at 80 ºC. ... 129 Figure 72. Sorption isotherms of the U(VI) in synthetic porewater performed at 20 and 80 ºC for a) U(VI)/illite
system; b) U(VI)/ Callovo-Oxfordian clay fraction system; and c) U(VI)/ Callovo-Oxfordian claystone system. Model approach considering thermodynamic data for surface reactions from Table 39 and using the thermodynamic data for Ca-U(VI)-CO3 aqueous complexes (see Table 14). Solid-line: model at 20 ºC;
dashed-line: model at 80ºC. ... 131 Figure 73. Impact of the temperature on the distribution coefficient of U(VI) as a function of the concentration of
U(VI) in equilibrium in Callovo-Oxfordian claystone system. (●) and (□) experimental data from the present work. red-line: model approach at 80ºC considering the model approach proposed in the present study and the thermodynamic parameters of U(VI) aqueous speciation (Table 14). ... 131
Figure A. 1. Schematic representation of the calibration plot of ICP-MS measurements. Black-cross correspond to the measurement of each standard solution; solid-line corresponds to the regression line (𝒚𝒄𝒂𝒍𝒄 = 𝒃𝒙 + 𝒄); dash-lines corresponds to the inferior and superior error of ycalc. ... 144
Figure C. 1. Temperature isolation box. a) internal layer aluminium; b) external layer of Teflon; c) tubes inside isolation box; d) closure of the isolation box. ... 155
Figure C. 2. Temperature measurements as a function of time at open lid and closed lid with small aperture. .... 156 Figure C. 3. Temperature measurements as a function of time in presence or absence of the isolation Teflon layer. ... 156 Figure C. 4. Experimental test of the oxidation of Fe(II) to Fe(III) as gas sealing control. ... 159 Figure C. 5. pH measured in atmospheric conditions of the COx porewater as a function of time. ... 159 Figure C. 6. Volume of water loss (%) at 80 ºC during agitation with tubes with no sealing tape as a function of
time. ... 160 Figure C. 7. Comparison results of the number of washes with ultra-pure water between 3-4 days or 1 days. ... 161 Figure C. 8. Total organic carbon as function of the munber of washing and time of contact. a) washing with ultra-pure water and rinsed with ultra-ultra-pure water between each wash; b) first rinsed with 5% of HNO3 at 100 ºC before
washed with ultra-pure water and rinsed with ultra-pure water between washes. ... 162
Figure D. 1. Left: distribution of the U(VI) (black-lines: Ca2UO2(CO3)3(aq); green-lines: UO2(CO3)34-); Right:
saturation index of Calcite as a function of calcium for: A) I = 0.1 m; B) I = 0.3 m; C) I = 0.5 m; D) I = 0.7 m; E) I = 1 m; and F) I = 3 m from Kalmykov and Choppin (2000) using Thermochimie database SIT (2009). . 197 Figure D. 2. (left) distribution of U(VI) speciation and (right) saturation index of Calcite as a function of the calcium
concentration considering the experimental conditions of Bernhard et al. (2001) using Thermochimie database Davies (2014). Solid-line: U(VI) = 1·10-4 M; dash-line: U(VI) = 5·10-5 M; dot-line: U(VI) = 2·10-5 M. ... 199
Figure D. 3. Distribution of U(VI) speciation and the saturation index of calcite as a function of the calcium concentration considering the experimental conditions of Lee and Yun (2013) using Thermochimie database Davies (2014). ... 199 Figure D. 4. (left) distribution of U(VI) speciation and (right) mineral saturation index as a function of the calcium
concentration considering the experimental conditions of Endrizzi and Rao (2006) using Thermochimie database Davies (2014). ... 199 Figure D. 5. Distribution of U(VI) speciation at 20ºC and 1% of CO2(g) taking the log10β113 = 27.4 ± 0.1 and
log10β213 = 29.8 ± 1.1 (calculated from PEST-Phreeqc). ... 201
Figure D. 6. Distribution of U(VI) speciation at 40ºC and 1% of CO2(g) taking the log10β113 = 27.2 ± 0.1 and
log10β213 = 29.9 ± 0.7 (calculated from PEST-Phreeqc). ... 202
Figure D. 7. Distribution of U(VI) speciation at 60ºC and 3% of CO2(g) taking the log10β113 = 26.7 ± 0.03 and
log10β213 = 29.6 ± 0.1 (calculated from PEST-Phreeqc). ... 202
Figure D. 8. Distribution of U(VI) speciation at 80ºC and 5% of CO2(g) taking the log10β113 = 26.5 ± 0.1 and
List of Tables
Table 1. Average and extreme values of the mineralogical composition (wt%) of the host layer in borehole EST205 Meure/Haute-Marne site (Gaucher et al., 2004). ... 34 Table 2. Chemical composition of the Callovo-Oxfordian porewater calculated by geochemical modelling according
to the temperature increasing using the reduced mineralogy. ... 35 Table 3. Chemical composition of the Callovo-Oxfordian porewater calculated by geochemical modelling according
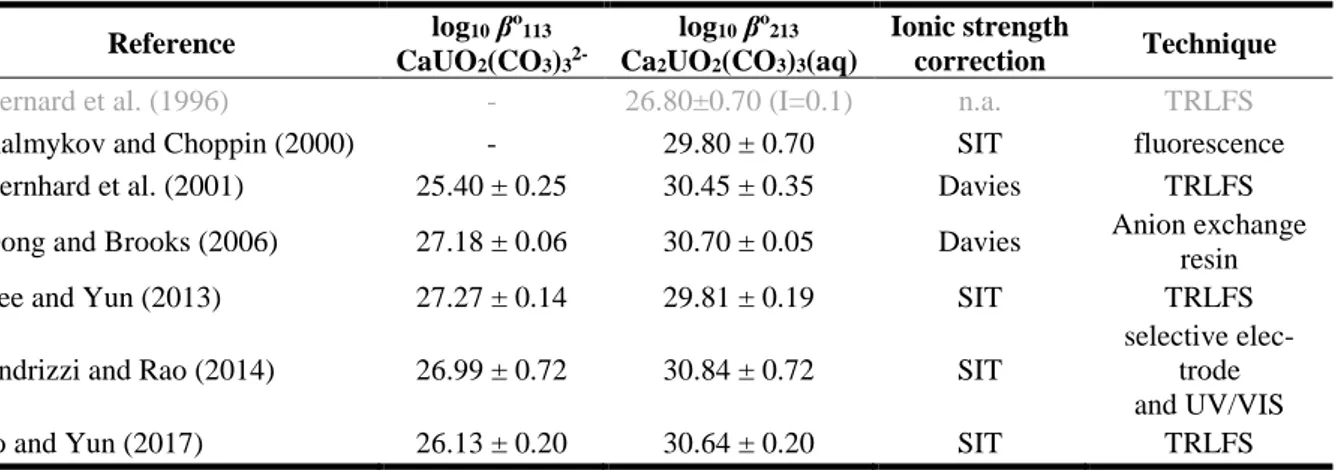
to the temperature increasing using the completed mineralogy. ... 35 Table 4. Summary of the literature analysing the stability constants of Ca-U(VI)-CO3 complexes. Data in grey have
been superseded by later references of the same authors (2001). ... 41 Table 5. Summary of the literature on the stability constants for Mg-U(VI)-CO3 complexes. Data in grey have been
superseded by later references of the same authors. ... 42 Table 6. Stability constants for Ca-U(VI)-CO3 complexes at I = 0.1M and different temperatures suggested by Jo
and Yun (2017). ... 43 Table 7. Summary of the batch experiments performed in the present work. ... 47 Table 8. Description of the tests performed in different temperatures and in closed system experiments. ... 51 Table 9. Theoretical and measured parameters from the evaluation of CO2(g) in equilibrium at different
temperatures. Theor.: theoretical value in agreement with the initial conditions of the experiments; Exp.: pH and alkanity measured at the end of the experiment, and pCO2 calculated according pH and alkanity measurements.
... 51 Table 10. Estimated values for the Log10KX at different temperatures and pCO2 (atm). ... 57
Table 11. Theoretical and measured pH, alkalinity and pCO2 of the batch experiments at different temperatures.
Theor.: theoretical values according to the initial conditions of the experiments; Measured pH and alklinity in equilibrium; and calculated pCO2 in agreement with pH and alkalinity measured. ... 58
Table 12. Results of the fitting for the stability constants of Ca-U(VI)-CO3 complexes using PEST. ... 60
Table 13. Stability constants of Ca-U(VI)-CO3 complexes calculated by 2D mapping method. ... 62
Table 14. Thermodynamic data of Ca-U(VI)-CO3 ternary complexes determined in this work. ... 63
Table 15. Calculated UO2∙2H2O(am) solubility and aqueous U(VI) speciation under Callovo-Oxfordian conditions
(Tournassat et al., 2008, Table 3) ... 67 Table 16. Comparison of the thermodynamic parameters of the Ca-U(VI)-CO3 ternary complexes reactions. p.w.
present work; (1) Endrizzi and Rao (2017); (2) Jo and Yun (2017); n.d. not defined. ... 67 Table 17. Classification of the planar hydrated phyllosilicates and some examples for each clay mineral species
(Theng, 2012). (the higlighted clay minerals are the ones relevant for the present study) ... 76 Table 18. Sorption parameters for U(VI) onto clay minerals of Callovo-Oxfordian formation (Bradbury and
Baeyens, 1997, 2004). ... 83 Table 19. Cationic exchange and surface complexation reactions used in the sorption model. ... 83
Table 20. Distribution of surface complexation reactions of U(VI) on illite and montmorillonite in Callovo-Oxfordian formation system (pH = 7.2 and pCO2 = 10-2.1 atm) ... 84
Table 21. Description of the experimental cases performed on different phases of Callovo-Oxfordian formation at 20 ºC. ... 85 Table 22. Summary of the experimental conditions for sorption of uranium in different components of Callovo-Oxfordian formation. ... 86 Table 23. Alkalinity and pH measurements before and after the equilibrium with illite. pCO2 calculated from the
equilibrium pH/alkalinity. ... 90 Table 24. Uranyl carbonate surface complexation reactions proposed for illite in Model III. ... 92 Table 25. pH and alkalinity measurements after equilibrium with pCO2 atmospheric, 1% and 5% CO2(g) ... 94
Table 26. Surface species of U(VI) distribution on illite and montmorillonite for Callovo-Oxfordian formation experimental conditions. ... 100 Table 27. Comparison of the main chemical parameters for OPA clay, Boda clay and COx clay. [1] Joseph et al.
(2011); [2] Marques Fernandes et al. (2015); [p.w.] present work. (*) measurements of alkalinity (meq/L). . 102 Table 28. Compilation of the surface reactions for both illite and montmorillonite taken in for the model prediction.
(n.a. not applied) ... 104 Table 29. Description of the U(VI) sorption experiments carried out on illite, Callovo-Oxfordian clay fraction and
clays samples as a function of temperature. ... 113 Table 30. Experimental conditions of the sorption experimental cases for the different phases of Callovo-Oxfordian
formation at different temperatures. (pw = porewater). ... 113 Table 31. Aqueous speciation of U(VI) (Guillaumont et al., 2003) and surface complexation reactions and respective
stability constants (Bradbury and Baeyens, 2009; Marques Fernandes et al., 2015) and enthalpy values (unknown: to be determined) used on the predictive model. (n.a.: not applied). ... 114 Table 32. pH and alkalinity measured in equilibrium for the sorption isotherms on illite in inert atmosphere at
different temperatures. ... 117 Table 33. Surface complexation constants on strong sites together with the corresponding hydrolysis constants and
enthalpy values for illite considered in Model IV. ... 118 Table 34. Log10OHKxº fitted based on sorption edges and isotherms experiments performed at different temperatures
for illite. ... 121 Table 35. Enthalpy values calculated from fitting of the stability constants of hydrolysis surface site species at
different temperatures. The uncertainty was determined considering only the propagation error of the standard deviation of the stability constants. ... 123 Table 36. Alkalinity and pH measurements before and after the equilibrium with illite at 80 ºC. pCO2 calculated
from the equilibrium pH/alkalinity. ... 125 Table 37. pH of equilibrium and alkalinity measurements in the presence of carbonates at 60 and 80ºC. ... 126 Table 38. pH and alkalinity measurements in equilibrium for the sorption isotherms on clay fraction at 80 ºC in
different atmospheres. ... 129 Table 39. Enthalpy values for the hydrolysis surface complexation reactions for illite and montmorillonite
considered in the present study. ... 129 Table 40. Experimental pH and alkalinity measurements at 20 and 80 ºC for illite, Callovo-Oxfordian clay fraction
and claystone samples in synthetic Callovo-Oxfordian porewater in equilibrium with 1% and 5% of CO2(g),
respectively. ... 130 Table 41. Aqueous and surface speciation at 20 and 80ºC for the Callovo-Oxfordian formation system in equilibrium
Table 42. Proposed thermodynamic parameters for the surface complexation reactions considered in the model approach. ... 133
Table A. 1. Concentration and dilution calculations of the standard solutions for determination of the calibration curve of ICP-MS analysis ... 142 Table A. 2. Theoretical chemical composition of the Callovo-Oxfordian porewater at 20 ºC and 80ºC. ... 146 Table A. 3. Salt content in g/L used in preparation of synthetic COx porewater at 20 and 80ºC ... 147 Table A. 4. Mineral composition of Callovo-Oxfordian claystone ... 147 Table A. 5. Experimental conditions for the batch experiments. Temp.= temperature; COx = Callovo-Oxfordian; I
= Ionic strength. ... 150
Table B. 1. Amount of exchanger-NO3 (mol/L) for the different solid-liquid ratio (𝝌) considered in the closed
system experiments. ... 153
Table C. 1. Experimental test of the control of the temperature using an isolation-aluminium box without external layer of Teflon. ... 156 Table C. 2. Experimental test of the control of the temperature using an isolation-aluminium box with external layer
of Teflon. ... 157 Table C. 3. Experimental test for sealing control. ... 159 Table C. 4. Experimental results of the tightness of the tubes without sealing tape. ... 160 Table C. 5. Uncertainty of the signal of the TOC Analyser determined using standard solution of IC, TC and ultra-pure water. ... 162 Table C. 6. TOC measurements of the experimental tests. ... 163 Table C. 7. Chemical composition of the synthetic Callovo-Oxfordian porewater. Uncertainty of k=2 ... 164 Table C. 8. Measurements of the pH for the sorption edge experiments in atmospheric pCO2. (1) used only in the
experiments at 80ºC; (2) this solution was not taken for the experiments performed at 20ºC. ... 164
Table C. 9. Alkalinity measurements using H2SO4 (0.16 N) in the blank samples of the batch experiments using
anionic-exchange resin. *measured ... 164 Table C. 10. Experimental results of the ionic exchange method at 20ºC in atmospheric conditions in the presence
of calcium, 0.1 M of NaClO4 at fixed solid-liquid ratio adding initially [U(VI)] = 5·10-7M... 165
Table C. 11. Experimental results of the ionic exchange method at 20ºC in closed system at 1% of CO2(g) in the
absence of calcium and varying the solid-liquid ration, in 0.1M of NaNO3 adding initially [U(VI)] = 5·10-7M.
(Ba: blank sample without U(VI); Bb: blank sample without resin with U) ... 165 Table C. 12. Experimental results of the ionic exchange method at 20ºC in closed system at 1% of CO2(g) in the
presence of calcium, 0.1 M of NaNO3 at fixed solid-liquid ratio adding initially [U(VI)] = 5·10-7M. (blank
samples in the absence of calcium (0) or presence of calcium (19) for Ba: without U(VI); and Bb: without resin with U) ... 166 Table C. 13. Experimental results of the ionic exchange method at 40ºC in closed system at 1% of CO2(g) in the
absence of calcium and varying the solid-liquid ration, in 0.1M of NaNO3 adding initially [U(VI)] = 5·10-7M.
(Ba: blank sample without U(VI); Bb: blank sample without resin with U) ... 166 Table C. 14. Experimental results of the ionic exchange method at 40ºC in closed system at 1% of CO2(g) in the
presence of calcium, 0.1 M of NaNO3 at fixed solid-liquid ratio adding initially [U(VI)] = 5·10-7M. . (blank
samples in the absence of calcium (0) or presence of calcium (19) for Ba: without U(VI); and Bb: without resin with U) ... 166
Table C. 15. Experimental results of the ionic exchange method at 60ºC in closed system at 3% of CO2(g) in the
absence of calcium and varying the solid-liquid ration, in 0.1M of NaNO3 adding initially [U(VI)] = 5·10-7M.
(Ba: blank sample without U(VI); Bb: blank sample without resin with U) ... 167 Table C. 16. Experimental results of the ionic exchange method at 60 ºC in closed system at 3% of CO2(g) in the
presence of calcium, 0.1 M of NaNO3 at fixed solid-liquid ratio adding initially [U(VI)] = 5·10-7M. . (blank
samples in the absence of calcium (0) or presence of calcium (19) for Ba: without U(VI); and Bb: without resin with U) ... 167 Table C. 17. Experimental results of the ionic exchange method at 80 ºC in closed system at 5% of CO2(g) in the
absence of calcium and varying the solid-liquid ration, in 0.1M of NaNO3 adding initially [U(VI)] = 5·10-7M.
(Ba: blank sample without U(VI); Bb: blank sample without resin with U) ... 168 Table C. 18. Experimental results of the ionic exchange method at 80ºC in closed system at 5% of CO2(g) in the
presence of calcium, 0.1 M of NaNO3 at fixed solid-liquid ratio adding initially [U(VI)] = 5·10-7M. . (blank
samples in the absence of calcium (0) or presence of calcium (19) for Ba: without U(VI); and Bb: without resin with U). ... 168 Table C. 19. Kinetic results of sorption of U(VI) onto Callovo-Oxfordian claystone at 20 ºC in 1% CO2(g), using
synthetic Callovo-Oxfordian porewater and initial U(VI) = 6.8(±0.2)∙10-7M. ... 168
Table C. 20. Kinetic results of sorption of U(VI) onto Callovo-Oxfordian claystone at 80 ºC in 5% CO2(g), using
synthetic Callovo-Oxfordian porewater and initial U(VI) = 6.8(±0.2)∙10-7M. ... 169
Table C. 21. Kinetic results of sorption of U(VI) onto Illite at 20 ºC in 1% CO2(g), using synthetic
Callovo-Oxfordian porewater and initial U(VI) = 9.6(±0.8)∙10-8M. ... 169
Table C. 22. Kinetic results of sorption of U(VI) onto illite at 80 ºC in 5% CO2(g), using synthetic
Callovo-Oxfordian porewater and initial U(VI) = 6.8(±0.2)∙10-7M. ... 169
Table C. 23. Alkalinity measurements in sorption isotherms experiments of U(VI)/illite system (2 g/L) at different temperatures. *synthetic Callovo-Oxfordian porewater. ... 170 Table C. 24. Experimental results of the sorption isotherms of U(VI) onto illite at 20ºC in Ar(g) in 0.1 M of NaNO3
at fixed solid-liquid ratio. (BF: blank sample filtrated; BNF: blank sample no filtrated) ... 171 Table C. 25. Experimental results of the sorption isotherms of U(VI) onto illite at 20ºC in atmospheric conditions
in 0.1 M of NaCl at fixed solid-liquid ratio. (BF: blank sample filtrated; BNF: blank sample no filtrated) .... 172 Table C. 26. Experimental results of the sorption isotherms of U(VI) onto illite at 20ºC in 1% of CO2(g) in 0.1 M
of NaNO3 at fixed solid-liquid ratio. (BF: blank sample filtrated; BNF: blank sample no filtrated) ... 173
Table C. 27. Experimental results of the sorption isotherms of U(VI) onto illite at 20ºC in 5% of CO2(g) in 0.1 M
of NaNO3 at fixed solid-liquid ratio. (BF: blank sample filtrated; BNF: blank sample no filtrated) ... 174
Table C. 28. Experimental results of the sorption isotherms of U(VI) onto illite at 20ºC in 1% of CO2(g) in synthetic
Callovo-Oxfordian porewater at fixed solid-liquid ratio. (BF: blank sample filtrated; BNF: blank sample no filtrated) ... 175 Table C. 29. Experimental results of the sorption isotherms of U(VI) onto illite at 60ºC in Ar(g) in 0.1 M of NaNO3
at fixed solid-liquid ratio. (BF: blank sample filtrated; BNF: blank sample no filtrated) ... 176 Table C. 30. Experimental results of the sorption isotherms of U(VI) onto illite at 60ºC in atmospheric pCO2 in 0.1
M of NaCl at fixed solid-liquid ratio. (BF: blank sample filtrated; BNF: blank sample no filtrated)... 177 Table C. 31. Experimental results of the sorption isotherms of U(VI) onto illite at 60ºC in 1% of CO2(g) in 0.1 M
of NaNO3 at fixed solid-liquid ratio. (BF: blank sample filtrated; BNF: blank sample no filtrated) ... 178
Table C. 32. Experimental results of the sorption isotherms of U(VI) onto illite at 60ºC in 5% of CO2(g) in 0.1 M
of NaNO3 at fixed solid-liquid ratio. (BF: blank sample filtrated; BNF: blank sample no filtrated) ... 179
Table C. 33. Experimental results of the sorption isotherms of U(VI) onto illite at 80ºC in Ar(g) in 0.1 M of NaNO3
at fixed solid-liquid ratio. (BF: blank sample filtrated; BNF: blank sample no filtrated) ... 180 Table C. 34. Experimental results of the sorption isotherms of U(VI) onto illite at 80ºC in atmospheric pCO2 in 0.1
Table C. 35. Experimental results of the sorption isotherms of U(VI) onto illite at 80ºC in 1% of CO2(g) in 0.1 M
of NaNO3 at fixed solid-liquid ratio. (BF: blank sample filtrated; BNF: blank sample no filtrated) ... 182
Table C. 36. Experimental results of the sorption isotherms of U(VI) onto illite at 80ºC in 5% of CO2(g) in 0.1 M
of NaNO3 at fixed solid-liquid ratio. (BF: blank sample filtrated; BNF: blank sample no filtrated) ... 183
Table C. 37. Experimental results of the sorption isotherms of U(VI) onto illite at 80ºC in 5% of CO2(g) in synthetic
Callovo-Oxfordian porewater at fixed solid-liquid ratio. (BF: blank sample filtrated; BNF: blank sample no filtrated) ... 184 Table C. 38. pH results of each tube measured before the batch equilibrium at 20 ºC in atmospheric pCO2. ... 185
Table C. 39. pH results of each tube measured before the batch equilibrium at 80 ºC in atmospheric pCO2. ... 185
Table C. 40. Experimental results of the sorption edges of U(VI) onto illite at 20ºC in Ar(g) in 0.1 M of NaNO3 at
fixed solid-liquid ratio of 2 g/L with [U(VI)]initial = 1.02(±0.06)∙10-7M. (BF: blank sample filtrated; BNF: blank
sample no filtrated) ... 186 Table C. 41. Experimental results of the sorption edges of U(VI) onto illite at 20ºC in atmospheric pCO2 in 0.1 M
of NaCl at fixed solid-liquid ratio of 0.5-1 g/L with [U(VI)]initial = 1.02(±0.06)∙10-7M. (BF: blank sample filtrated;
BNF: blank sample no filtrated) ... 186 Table C. 42. Experimental results of the sorption edges of U(VI) onto illite at 80 ºC in Ar(g) in 0.1 M of NaNO3 at
fixed solid-liquid ratio of 2 g/L with [U(VI)]initial = 1.02(±0.06)∙10-7M. (BF: blank sample filtrated; BNF: blank
sample no filtrated) ... 187 Table C. 43. Experimental results of the sorption edges of U(VI) onto illite at 80ºC in atmospheric pCO2 in 0.1 M
of NaCl at fixed solid-liquid ratio of 0.5-1 g/L with [U(VI)]initial = 3.07(±0.01)∙10-8M. (BF: blank sample filtrated;
BNF: blank sample no filtrated) ... 187 Table C. 44. Alkalinity measurements in sorption isotherms experiments of U(VI)/clay fraction system at different
temperatures. *synthetic Callovo-Oxfordian porewater. ... 188 Table C. 45. Experimental results of the sorption isotherms of U(VI) onto Callovo-Oxfordian clay fraction at 20ºC
in Ar(g) in 0.1 M of NaNO3 at fixed solid-liquid ratio. ... 188
Table C. 46. Experimental results of the sorption isotherms of U(VI) onto Callovo-Oxfordian clay fraction at 20 ºC in 1% of CO2(g) in 0.1 M of NaNO3 at fixed solid-liquid ratio. (BF: blank sample filtrated; BNF: blank sample
no filtrated) ... 189 Table C. 47. Experimental results of the sorption isotherms of U(VI) onto Callovo-Oxfordian clay fraction at 20 ºC
in 1% of CO2(g) in synthetic Callovo-Oxfordian porewater at fixed solid-liquid ratio. (BF: blank sample filtrated;
BNF: blank sample no filtrated) ... 190 Table C. 48. Experimental results of the sorption isotherms of U(VI) onto Callovo-Oxfordian clay fraction at 80 ºC
in Ar(g) in 0.1 M of NaNO3 at fixed solid-liquid ratio of 2 g/L. (BF: blank sample filtrated; BNF: blank sample
no filtrated) ... 191 Table C. 49. Experimental results of the sorption isotherms of U(VI) onto Callovo-Oxfordian clay fraction at 80 ºC
in 5% of CO2(g) in 0.1 M of NaNO3 at fixed solid-liquid ratio. (BF: blank sample filtrated; BNF: blank sample
no filtrated) ... 192 Table C. 50. Experimental results of the sorption isotherms of U(VI) onto Callovo-Oxfordian clay fraction at 80 ºC
in 5% of CO2(g) in Callovo-Oxfordian porewater at fixed solid-liquid ratio. (BF: blank sample filtrated; BNF:
blank sample no filtrated) ... 193 Table C. 51. Alkalinity measurements in sorption isotherms experiments of U(VI)/claystone system at 20 and 80ºC
in synthetic Callovo-Oxfordian porewater. ... 194 Table C. 52. Experimental results of the sorption isotherms of U(VI) onto Callovo-Oxfordian claystone at 20 ºC in
1% of CO2(g) in Cox porewater at fixed solid-liquid ratio. ... 194
Table C. 53. Experimental results of the sorption isotherms of U(VI) onto Callovo-Oxfordian claystone samples at 80 ºC in 5% of CO2(g) in Callovo-Oxfordian porewater at fixed solid-liquid ratio. ... 195
Table D. 1. Summary of the main parameters used for determination of stability constants of Ca-U(VI)-CO3 complexes using different experimental methods (n.d.: not determined). ... 198 Table D. 2. Modelling results using PEST coupled to Phreeqc for experiments as a function of S/L in the absence
of Ca at 20 ºC and 1% of CO2(g) ... 200
Table D. 3. Modelling results using PEST coupled to Phreeqc for experiments as a function of S/L in the absence of Ca at 40 ºC and 1% of CO2(g) ... 200
Table D. 4. Modelling results using PEST coupled to Phreeqc for experiments as a function of S/L in the absence of Ca at 60 ºC and 3% of CO2(g) ... 200
Table D. 5. Modelling results using PEST coupled to Phreeqc for experiments as a function of S/L in the absence of Ca at 80 ºC and 5% of CO2(g) ... 201
Table D. 6. Modelling results using PEST coupled to Phreeqc for experiments as a function of Ca at fixed S/L, 20ºC and 1% of CO2(g) ... 201
Table D. 7. Modelling results using PEST coupled to Phreeqc for experiments as a function of Ca at fixed S/L, 40ºC and 1% of CO2(g) ... 202
Table D. 8. Modelling results using PEST coupled to Phreeqc for experiments as a function of Ca at fixed S/L, 60ºC and 3% of CO2(g) ... 202
Table D. 9. Modelling results using PEST coupled to Phreeqc for experiments as a function of Ca at fixed S/L, 80ºC and 5% of CO2(g) ... 203
Table E. 1. Thermodynamic data for the aqueous species considered for the calculation of stability constants of Ca-U(VI)-CO3 complexes. Note that log10β values and enthalpies of reaction are in agreement with the chemical
reactions that are included in ThermoChimie database v.9 ... 205 Table E. 2. Thermodynamic data for the solid phases considered for the calculation of stability constants of Ca-U(VI)-CO3 complexes. Note that log10K and enthalpies of reaction are in agreement with the chemical reactions
Résumé Étendu
La présence éventuelle de radionucléides dans l’environnement, due à l'utilisation de la production d'énergie nucléaire et à la manipulation généralisée des radio-isotopes dans la recherche, l'industrie, la médecine et l'agriculture, soulève un certain nombre de préoccupations environnementales. Il est essentiel dans ce contexte de comprendre le comportement chimique des radionucléides pour per-mettre une prévision fiable de leur migration dans le milieu naturel.
En France, la formation argileuse du Callovo-Oxfordien (COx), située en Meuse / Haute-Marne (Est de la France), est à l'étude comme barrière géologique pour le projet de stockage des déchets radioac-tifs « Cigéo : Centre industriel de stockage géologique ». Cette formation argileuse, de plus de 130 m d'épaisseur et à 500 m de profondeur, est caractérisée par une faible perméabilité ce qui limite la circulation de l’eau, principale cause de la dissémination des radioéléments. De plus, il s’agit d’une zone qui présente une bonne homogénéité sur plusieurs km2 (minéralogie, propriétés physicochi-miques) (Andra, 2005). Enfin, elle est caractérisée par un assemblage minéralogique riche en phases argileuses qui jouent un rôle important dans le contrôle des propriétés physico-chimiques et le ralen-tissement de la migration des radionucléides compte tenu de leurs importantes capacités de rétention. L'environnement géologique au voisinage d’un stockage de déchets nucléaires sera évidemment sou-mis à des perturbations (par exemple thermiques, hydrauliques, mécaniques et chimiques, connues sous le nom de THMC) et à différents niveaux de radioactivité au cours du temps. L’une des pertur-bations primordiales durant les premières années est l’augmentation de la température autour du stockage, favorisée par les désintégrations radioactives au sein des déchets de haute activité à vie longue. Dans la roche argileuse hôte, cet effet peut non seulement modifier la composition chimique de l'eau interstitielle (pH, potentiel d'oxydoréduction et pression du gaz), mais aussi provoquer des processus d'interaction eau-roche-gaz (par exemple : dissolution, précipitation), voire modifier les propriétés de sorption.
Actuellement, dans les installations françaises, le combustible usé est composé en plus de la matière fissile (oxydes d'uranium et oxydes mixtes d'uranium et de plutonium) des produits de fission et des actinides mineurs responsables de plus de 98 % de la radioactivité. Ces derniers, considérés comme des déchets, sont séparés pour être conditionnés au sein de matrices de verre par des procédés de vitrification (Andra, 2005). Le combustible usé, qui n’est pas retraité, n’est pas considéré comme un déchet. Le degré de radioactivité de ces combustibles usés est comparable à celui des déchets vitrifiés. L’interaction du rayonnement α émis par les radio-isotopes avec l'eau peut conduire à des réactions provoquant la corrosion et la dissolution du verre, libérant ainsi les radioéléments (notamment U, Pu, etc…). La mobilité de l’uranium dans la géosphère est intrinsèquement liée à sa solubilité qui dépend de son degré d’oxydation (communément en conditions naturelles U(IV) ou U(VI)) et à la stabilité des espèces aqueuses présentes dans l’eau porale de la formation argileuse (Runde, 2000).
Les résultats d’exercices de modélisation géochimique, qui s’appuient sur les données thermodyna-miques issues du projet international coordonné par l’Agence de l’Energie Nucléaire (NEA-TDB ; Guillaumont et al., 2003), prédisent l’existence de l’uranium au degré d’oxydation U(IV) dans les con-ditions physico-chimiques représentatives de l’eau porale des argilites à l’état naturel. Au degré d’oxydation U(IV), l’uranium est peu soluble et les espèces dissoutes associées peuvent réagir forte-ment avec les surfaces argileuses des argilites du Callovo-Oxfordien ce qui rend cet éléforte-ment peu mobile. Cependant, des données publiées ont clairement établi l'existence de complexes ternaires Ca-U(VI)-CO3 (Bernhard et al., 1996, 2001 ; Kalmykov et Choppin, 2000 ; Dong et Brooks, 2006 ; Lee et Yun, 2013 ; Endrizzi et Rao., 2014 ; Jo et Yun, 2017) dans les conditions physico-chimiques des argilites (pH ≈ 7,2 et Eh ≈ -200 mV). Ainsi, la présence de ces complexes ternaires en solution peut conduire à stabiliser l’uranium au degré d’oxydation U(VI) en solution et donc augmenter la solubilité de l’uranium et une mobilité plus élevée du fait d’une rétention moindre sur les surfaces argileuses (Joseph et al., 2013 ; Vercouter et al., 2015 ; Tullborg et al., 2017).
Le travail de thèse s’inscrit dans ce contexte et a pour but de mieux comprendre le comportement de l’uranium dans la formation des argilites du Callovo-Oxfordien en prenant en compte de façon ex-haustive toutes les données publiées notamment sur la stabilité des complexes ternaires d’uranyl. L’effet de la température (20 à 80 °C) sur ce comportement est particulièrement étudié.
La première partie du travail a pour but d’identifier et de quantifier l’effet de la température sur la formation des complexes ternaires Ca-U(VI)-CO3. Les processus de rétention de l’uranium sont en-suite étudiés à 20 °C, en se concentrant sur la sorption de U(VI) sur des minéraux argileux de réfé-rence (illite et montmorillonite), sur la fraction argileuse des argilites du Callovo-Oxfordien (illite et interstratifié illite/smectite) et au contact d’échantillon brut d’argilites du Callovo-Oxfordien. Le mo-dèle de sorption développé à 20 °C, combiné avec les paramètres thermodynamiques qui caractérisent les complexes ternaires, a servi de base pour l’étude de l’effet de la température sur la sorption de U(VI) pour les divers systèmes argileux.
Effet de la température sur la stabilité des complexes ternaires dans le système «
Ca-U(VI)-CO
3»
La mesure des constantes de complexation aqueuse à différentes températures est basée sur une mé-thode de compétition proposée par Dong et Brooks (2006). La mémé-thode a été adaptée pour permettre l’étude en température (via l’utilisation d’une résine plus stable) et la concentration en uranium a été ajustée pour éviter tout problème de précipitation. Des tests préliminaires ont été réalisés pour garantir le bon fonctionnement du montage expérimental et pour évaluer l'équilibre entre la pression de CO2(g) et les solutions aqueuses.
Les résultats indiquent que les deux complexes aqueux ternaires étudiés ont des comportements dif-férents en température. Avec l’augmentation de la température, la formation du complexe anionique (CaUO2(CO3)32-) est défavorisée, alors que celle du complexe neutre (Ca2UO2(CO3)3(aq)) n’est pas influencée.
Ainsi, à partir des données expérimentales, les constantes de stabilité pour CaUO2(CO3)32- (log10 βº113 = 27,3 ± 0.2) et Ca2UO2(CO3)3(aq) (log10 βº213 = 29.7 ± 0.3) ont été calculées en suivant deux ap-proches d’ajustement différentes. Les valeurs obtenues sont cohérentes avec celles publiées, ce qui valide la méthode et le modèle conceptuel proposé. De plus, les données d'enthalpie ont été détermi-nées pour la formation des complexes ternaires Ca-U(VI)-CO3. Les enthalpies de formation de
CaUO2(CO3)32- et Ca2UO2(CO3)3(aq) sont respectivement égales à -27,4 ± 8,2 et à 0 ± 1,8 kJ/mol. La valeur de ΔrHº du complexe anionique est négative, comme cela est proposé par Endrizzi et Rao (2014), même si celle-ci est deux fois plus faible dans le cas présent. Cependant, pour le complexe neutre, la valeur de ΔrHº est en désaccord avec celle proposée par Endrizzi et Rao (2014) (-47 kJ / mol). Les autres paramètres thermodynamiques (entropie et énergie libre de Gibbs) sont en bon ac-cord avec ceux publiés par Endrizzi et Rao (2014).
Modèle de sorption U(VI)/argilites du Callovo-Oxfordien à 20 °C
La formation des argilites du Callovo-Oxfordien est constituée principalement de quartz, de minéraux carbonatés (comme la calcite, la dolomite), de pyrite et d’une fraction argileuse qui contient en ma-jorité de l’illite et des argiles interstratifiées I/S (illite/smectite). Pour simplifier l’étude, dans une première approche, les hypothèses suivantes sont faites : (i) la fraction argileuse est considérée comme étant à l’origine de la rétention de l’uranium ; (ii) la fraction I/S est décrite comme un mélange d’illite et de smectite et enfin (iii) la réactivité de la phase argileuse est décrite par deux pôles qui sont l’illite et la montmorillonite (comme minéral représentatif des smectites) (Bradbury et Baeyens, 1997, 2005, 2011 ; Chen et al., 2014 ; Marques Fernandes et al., 2015). Le modèle 2SPNE SC/CE proposé par Bradbury et Baeyens (1997) a été utilisé pour décrire les interactions entre U(VI) et les phases argileuses modèles.
Si le système U(VI)/montmorillonite est bien décrit et paramétré (Bradbury et Baeyens, 1999 ; Marques Fernandes et al., 2012 ; Tournassat et al., 2009, 2018), ce n’est pas le cas pour le système U(VI)/illite pour lequel l’influence des carbonates sur la rétention a été très peu étudiée. C’est pour-quoi, un travail expérimental a été réalisé avec l’illite, en complément des études réalisées avec la fraction extraite du COx et des argilites du COx.
Le modèle proposé pour l’illite peut relativement bien expliquer les données expérimentales obtenues pour une large gamme de conditions expérimentales (pH = 6 à 7,3 ; pCO2 de 10-3,5 à 10-2,1 ; NaNO3 0,1M et composition chimique de l’eau porale synthétique des argilites du Callovo-Oxfordien). Il considère les paramètres de la montmorillonite pour les espèces hydrolysées de surface. Cependant, une nouvelle constante pour le complexe de surface ≡SsOUO2(CO3)32- est proposée. La valeur de la constante de sorption apparaît plus élevée pour l’illite (log10 K = 17,5) que celle proposée pour la montmorillonite (log10 K = 15,5, Marques Fernandes et al, 2012).
Le modèle permet également de décrire de manière convenable le comportement de U(VI) en pré-sence de la fraction argileuse des argilites du Callovo-Oxfordien (illite et I/S), bien qu'un léger déca-lage ait pu être observé entre l’expérience et le calcul en absence de carbonates. Dans la mesure où le modèle proposé fonctionne correctement dans les conditions physico-chimiques représentatives de la formation du Callovo-Oxfordien (présence de carbonates), aucun changement de paramètre n'a été effectué et l'hypothèse de décrire I/S comme deux pôles d’illite et de montmorillonite est considérée comme valable.
Enfin, le modèle proposé a été appliqué avec succès pour décrire les données de sorption obtenues pour le système U(VI)/argilites du Callovo-Oxfordien. Il permet également de décrire le comporte-ment de U(VI) en présence d’autres roches argileuses, telles que les argiles de l’Opalinus (Amayri et al., 2016 ; Joseph et al., 2013 ; Marques Fernandes et al., 2015) et de Boda (Marques Fernandes et al., 2015). Les résultats obtenus indiquent que la fraction argileuse gouverne la rétention de U(VI). De manière simplifiée, la spéciation en solution est contrôlée par les complexes ternaires de U(VI)