Open Archive TOULOUSE Archive Ouverte (OATAO)
OATAO is an open access repository that collects the work of Toulouse researchers and
makes it freely available over the web where possible.
This is an author-deposited version published in :
http://oatao.univ-toulouse.fr/
Eprints ID : 16708
To link to this article : DOI : 10.1016/j.surfcoat.2013.05.045
URL :
http://dx.doi.org/10.1016/j.surfcoat.2013.05.045
To cite this version :
Levasseur, O. and Stafford, Luc and Gherardi,
Nicolas and Naudé, Nicolas and Beche, Eric and Esvan, Jérôme and
Blanchet, Pierre and Riedl, Bernard and Sarkissian, Andranik Role
of substrate outgassing on the formation dynamics of either
hydrophilic or hydrophobic wood surfaces in atmospheric-pressure,
organosilicon plasmas. (2013) Surface and Coatings Technology,
vol. 234. pp. 42-47. ISSN 0257-8972
Any correspondence concerning this service should be sent to the repository
administrator:
staff-oatao@listes-diff.inp-toulouse.fr
Role of substrate outgassing on the formation dynamics of either
hydrophilic or hydrophobic wood surfaces in atmospheric-pressure,
organosilicon plasmas
O. Levasseur
a, L. Stafford
a,⁎
, N. Gherardi
b,c,d,e,f, N. Naudé
b,c,d,e,f, E. Beche
g, J. Esvan
h,
P. Blanchet
i, B. Riedl
j, A. Sarkissian
kaDépartement de Physique, Université de Montréal, Montréal, QC H3C 3J7, Canada bUniversité de Toulouse, F-31062 Toulouse Cedex 9, France
cUPS, F-31062 Toulouse Cedex 9, France dINPT, F-31062 Toulouse Cedex 9, France eLAPLACE, F-31062 Toulouse Cedex 9, France fCNRS, F-31062 Toulouse Cedex 9, France
gPROMES-CNRS/UPR 8521, Centre du four solaire Felix TROMBE, Odeillo, 66120 Font-Romeu, France hCIRIMAT-ENSIACET, 31030 Toulouse Cedex 4, France
iFPInnovations – Division des Produits du Bois, Québec, QC G1P 4R4, Canada jCentre de Recherche sur le Bois, Université Laval, Québec, QC G1K 7P4, Canada kPlasmionique, Varennes, QC J3X 1S2, Canada
a b s t r a c t
Keywords:
Atmospheric-pressure plasmas Dielectric barrier discharges Functional coatings Organosilicon plasmas Wood
This work examines the influence of substrate outgassing on the deposition dynamics of either hydrophilic or hydrophobic coatings on wood surfaces in organosilicon, dielectric barrier discharges. Sugar maple and black spruce wood samples were placed on the bottom electrode and the discharge was sustained in N2–HMDSO
(hexamethyldisiloxane) gas mixtures by applying a 24 kV peak-to-peak voltage at 2 kHz. Current–voltage characteristics revealed a transition from a filamentary to a homogeneous discharge with increasing plasma treatment time, t. Based on optical emission spectroscopy, the filamentary behavior was ascribed to the release of air and humidity from the wood substrate following discharge exposure which produced significant quenching of N2metastables. This effect vanished at longer treatment times due to the nearly complete “pumping” of
products from the wood substrate and the progressive deposition of a “barrier” layer. Analysis of the surface wettability through static, water contact angles (WCAs) and of the surface composition through Fourier-Transform-Infra-Red-Spectroscopy and X-ray-Photoelectron-Spectroscopy indicated that for t b 10 min, the wood surface was more hydrophilic due to the formation of a SiOxlayer, a typical behavior for HMDSO deposition in presence
of oxygen. On the other hand, for t > 10 min, the static WCA increased up to ~140° due to the deposition of hydrophobic Si(CH3)3-O-Si(CH3)2, Si(CH3)3, and Si(CH3)2functional groups.
1. Introduction
Dielectric barrier discharges (DBDs) were thoroughly investigated over the last several years with one of the main goals being the achievement of a homogeneous, or glow, discharge at high operating pressure in various gas mixtures[1–13]. This keen interest is mainly driven by the fact that atmospheric-pressure DBDs present major advantages over low-pressure plasmas for polymer treatments, one of the most important being the ability to work with cold plasmas without the use of high-end and expensive vacuum pumping sys-tems. Over the last decade, many gaseous or liquid precursors, such as organosilicon compounds like hexamethyldisilazane (HMDSN)
and hexamethyldisiloxane (HMDSO), were added to these cold, atmospheric-pressure plasmas for plasma-enhanced chemical vapor deposition (PECVD) applications [14]. A wide variety of coatings have been obtained by such PECVD methods, including those relevant for photovoltaic and biomedical applications[15,16]. Application of DBDs to the treatment of textiles and wood is however much more challenging than for conventional substrates such as polymer foil, Si or SiO2. This can not only be attributed to the highly complex
chemi-cal nature of these polymers but also to their generally porous micro-structure which can release impurities in the discharge either from plasma–substrate chemical reactions or from sample outgassing (if not pumped-down beforehand). Such impurities can greatly alter the discharge stability and gas-phase kinetics which are both known to play an important role on the plasma deposition dynamics. For ex-ample, it is well-known that small admixtures of oxygen in dielectric
⁎ Corresponding author. Tel.: +1 5143436542; fax: +1 5143432071.
E-mail address:luc.stafford@umontreal.ca(L. Stafford).
barrier discharges operated in N2lead to a transition from a
homoge-neous to a filamentary discharge which increases the difficulty of obtaining spatially uniform plasma-deposited layers[17]. In addition, the addition of small amounts of O2into a N2/HMDSO plasma
gener-ally leads to the formation of a SiOxlayer instead of the organosilicon
coatings obtained in pure N2/HMDSO discharges[18].
In a previous publication, we have shown that an atmospheric pressure DBD operated in He/HMDSO gas mixtures leads to the depo-sition of highly hydrophobic functional groups on wood substrates, producing coatings with static, water contact angles in the 130° range and with a high long-term stability following natural weathering, a very promising result for structural and decorative outdoor applications
[19]. Other authors have also shown promising hydrophilic or hydro-phobic wood surfaces following atmospheric-pressure plasma treat-ments [see, for example, Refs.20–23]. In this work, we capitalize on the very porous nature of wood, which can retain a significant amount of impurities, to examine the influence of substrate outgassing during PECVD on the discharge stability and on the evolution of the properties of plasma-deposited thin films.
2. Experimental details
2.1. Experimental setup and plasma diagnostics
The DBD apparatus used in this work was described in details in our previous publication[19]. Briefly, the discharge is sustained into a sealed stainless steel chamber between two 25 × 55 mm metallic electrodes covered with two 0.635 mm thick, 70 × 115 mm alumina sheets. Sugar maple (Acer saccharum Marsh.) and black spruce (Picea
mariana Mill.) samples, 2 mm-thick and 70 × 115 mm in size were
placed on the bottom electrode. All samples were cut from the same board and sanded with 80 grit paper before each treatment. The dis-charge gap between the wood topmost surface and the top electrode was set to 1 mm. All experiments were realized using N2 (purity
grade UHP) as the carrier gas and HMDSO as the growth precursor. The mass flow rate of N2 was set to 3 SLPM (standard liters per
minute at STP) while the HMDSO concentration was set to 20 ppm. For selected samples, a primary vacuum down to about 50 mTorr was performed before the plasma treatment to allow considerable outgassing of the wood substrate and thus to highlight its role on the discharge stability and properties of plasma-deposited thin films. To sustain the plasma, a sinusoidal electrical stimulation with a fre-quency of 2 kHz and a peak-to-peak voltage of 24 kV was used.
The plasma was characterized through current–voltage (I–V) and optical emission spectroscopy (OES) analysis. The discharge regime was studied by measuring Va, the voltage applied to the gas, and Im,
the current flowing through the discharge cell[19]. For OES mea-surements, an optical fiber was installed on the back of the reactor with the tip pointing towards the interelectrode gap. Plasma emissions were analyzed using a PI-Acton spectrometer equipped with a 550 mm focal length monochromator and a Pixis 256E charged-coupled device camera. Emission spectra were taken between 300 and 900 nm with a 300 lines/mm grating. As only the overall evolution of the plasma emission was of interest in this study, the spectra were not corrected by the spectral response of the monochromator and detector.
2.2. Surface characterization
Following plasma exposure, the wettability with deionized water of each sample was characterized by measuring the sessile contact angle,θ, with a Digidrop GBX apparatus. Unless mentioned otherwise, θ values were determined with water drops of 3 μl in volume, 1 s after contact with the wood sample. Because of the strongly inhomo-geneous nature of wood in terms of chemical composition and micro-structure, at least 10 measurements on different parts of the surface were performed to obtain reliableθ values with minimal standard
deviations. As underlined by Strobel and Lyons [24] and by Di
Mundo and Palumbo[25], measurements in “static” mode, i.e. by sim-ply placing a drop of liquid on the surface, tend to miss a large part of the available information. Indeed, on non-ideal surfaces such as plasma-modified polymers, measuring both advancing and receding contact angles generally provides a more complete picture of the sur-face wettability: the advancing contact angle is more sensitive to the low-energy components while the receding contact angle is most sensitive to the high-energy ones. In the present work, however, con-tact angle measurements were only used to examine whether there was grafting of either hydrophilic or hydrophobic groups on the wood surface following plasma exposure and this aspect can readily be obtained through static measurements. Moreover, in conditions in which the wood surface strongly absorbs the water droplet, reced-ing angles are impossible to determine.
Analysis of the surface chemistry of raw and plasma-treated wood samples was done by Attenuated Total Reflectance Fourier Transform Infrared (ATR-FTIR) spectroscopy in the 700 to 4000 cm− 1
wave-number range using a Perkin Elmer (Spectrum 400) apparatus. Each spectrum displayed in this work represents the average of twelve-scans. Since our ATR-FTIR studies only provide qualitative data, the chemical composition of selected wood substrates was also investigated by X-ray Photoelectron Spectroscopy (XPS) using a Thermoelectron Kalpha device from Thermo Scientific. The photo-electron emission spectra were recorded using Al–Kα radiation (hν = 1486.6 eV) from a monochromatized source and the X-ray spot was approximately 400μm in size. The pass energy was fixed to 60 eV, the energy step size to 0.1 eV, and the dwell time to 50 ms. The spectrometer energy calibration was made using the Au 4f7/2 (83.9 ± 0.1 eV) and Cu 2p3/2 (932.8 ± 0.1 eV) photoelectron lines. The background XPS signal was removed using the Shirley method. The atomic concentrations were determined with accuracy less than 10% from photoelectron peak areas using the atomic sensitiv-ity factors reported by Scofield, taking into account the transmission function of the analyzer. This function was calculated at different pass energies from Ag 3d and Ag MNN peaks collected for a silver reference sample. The binding energy scale was established by referencing the C 1s value of adventitious carbon (284.6 ± 0.1 eV).
3. Experimental results and discussion
3.1. Role of substrate outgassing on the discharge properties
Fig. 1shows the discharge current for a sugar maple sample right after ignition of the first few discharges (t = 0,Fig. 1A) and after 60 min of plasma exposure (t = 60 min,Fig. 1B). Two distinct re-gions are present on these curves: i) the capacitive current associated with the sinusoidal portion of the electrical signal and ii) the dis-charge current that can consists of either one broad peak, which is typical of a homogeneous regime, or multiple narrower peaks, which is typical of a filamentary mode[14]. For samples not pumped down beforehand and for short treatment times, the multiple, ran-domly distributed and intense discharge current peaks of short dura-tion (~ 100 ns) indicate a strong filamentary behavior. As the wood treatment evolves, the I–Vs show a homogeneous-like behavior char-acterized by periodic and broad (~ 80μs) discharge current peaks. For samples pumped down beforehand (Fig. 1C), the homogeneous re-gime was observed right after ignition of the first few discharges, which indicates that substrate outgassing plays a very critical role on the discharge stability. The treatment time required to achieve ho-mogeneous I–V characteristics is obviously linked to the nature of the wood samples placed on the electrode since hardwood species are usually less porous than softwood species such that their outgassing time is much longer. As for the power absorbed or dissipated in the discharge, it was found to decrease from 2.5 to 0.8 W cm− 3between t = 0 and t = 60 min, a feature that is in good agreement with
the filamentary-to-homogeneous regime transition (filamentary dis-charges are characterized by higher absorbed powers than those in the homogeneous regimes[26,27]).
Optical emission spectroscopy was performed to examine in more details the impact of wood presence on the plasma properties. A typ-ical emission spectrum from a N2discharge with 20 ppm of HMDSO
and a sugar maple sample placed on the bottom electrode is shown inFig. 2. In addition to the expected strong emission from the second positive of N2(C3Πu-B3Πg) in the 300–600 nm range, emissions from the
fist negative system of N2+at 391 nm (B2Σu+,ν′ = 0 → X2Σg+,ν″ = 0)
and from the A2Σ+,
ν′ = 0 → X2
Π,ν″ = 0 rovibronic band of OH at 309 nm can also be observed. The release of oxygen-based products (as illustrated by the presence of the OH emission) in the nominally pure N2–HMDSO discharge can be ascribed to both the strong outgassing
of air (N2and O2) and humidity entrapped in the wood substrate as well
as to etching of the wood major components (cellulose, hemicelluloses and lignin). This is likely to be responsible for the filamentary behavior
displayed inFig. 1. As reported in[5,26,28], homogeneous or glow dis-charges can be attained by high metastables and seed electron densities. However, as oxygen impurities are introduced in the discharge, much higher collisional quenching rates and thus lower number densities of N2metastables are expected, which is known to lead to a filamentary
discharge for O2rate in N2higher than 500 ppm[29]. In contrast to
Ref.[14], it is worth mentioning that no CN emission was observed at 388 nm. This could happen when an oxidizing gas (O2, humidity) is
introduced in the gas phase. It could also suggest that the association rate of HMDSO and N2fragments in the plasma was relatively low; a
feature that can probably be ascribed to the relatively low dissocia-tion levels of both HMDSO and N2in the range of experimental
con-ditions investigated.
Fig. 3shows the time evolution of the OH, N2and N2+emission
bands at 309, 337 and 391 nm respectively for sugar maple and black spruce samples exposed to a nitrogen discharge. The emission
from N2 was found to remain fairly constant over the whole
-15 -10 -5 0 5 10 15 -15 -10 -5 0 5 10 15 0 200 400 600 800 1000 -15 -10 -5 0 5 10 15
B
C
A
-300 -200 -100 0 100 200 300 Applied voltage (kV) Time (µs) Current (mA) -15 -10 -5 0 5 10 15 20 -15 -10 -5 0 5 10 15 20Fig. 1. Comparison of the current-voltage characteristics of a N2discharge with a sugar maple sample for various times after ignition of the first few discharges: A) t = 10 s and
B) t = 60 min. Values for outgassed sugar maple samples are also shown for comparison in C). Operating frequency: 2 kHz, peak-to-peak voltage: 24 kV.
300 350 400 450 600 700 800 0 2000 4000 6000 8000 10000 12000 14000 16000 18000 386 388 390 392 394 396 398 0 100 200 300 400 500 600 700 Intensity (a.u.) Wavelength (nm) N2+ Intensity (a.u.) Wavelength (nm) N2 OH
Fig. 2. Typical time- and line-integrated plasma emission spectrum from a N2discharge
with a non-degassed sugar maple substrate. A zoom over the 390 nm wavelength range is also presented to better illustrate the N2+emission band at 391 nm. As
illus-trated, for this N2+band, the contribution from surrounding N2bands to the emission
intensity was removed using a simple linear baseline. The operating conditions are the same than inFig. 1A.
0 10 20 30 40 50 60 1 10 100 1000 10000 Outgassed 7.5x10 torr
Black spruce (OH-310nm) Black spruce (N -337nm) Black spruce (N -391nm) Sugar maple (OH-310nm) Sugar maple (N -337nm) Sugar maple (N -391nm)
Emission intensity (a.u.)
Treatment Time (mins)
Fig. 3. Influence of treatment time on the intensity of the OH (309 nm), N2–C (337 nm)
and N2+(391 nm) emission bands in a N2discharge for sugar maple and black spruce
wood samples. Values for outgassed sugar maple samples are also shown for compar-ison. Operating conditions are the same than inFig. 1.
60-minute exposure examined whereas the emission from N2+
decreased drastically within the first few minutes and vanished completely at longer treatment times. While emission from N2+ is
generally very weak in homogenous and nominally pure N2discharges,
it becomes more apparent in the presence of small admixtures of O2
due to the filamentary-to-homogeneous regime transition[30]. Even if emission from O and O2could not be observed in any of the emission
spectra, the combination of a filamentary discharge (Fig. 1) and a rela-tively high N2+emission at short treatment times (Fig. 3) appear strongly
linked to a high oxygen content in the discharge. As wood outgassing evolves, i.e. as O2 and humidity are being pumped down from the
substrate, the discharge becomes homogeneous and N2+emission
be-comes very small. A faster decrease of the N2+emission was observed
for black spruce than for sugar maple.
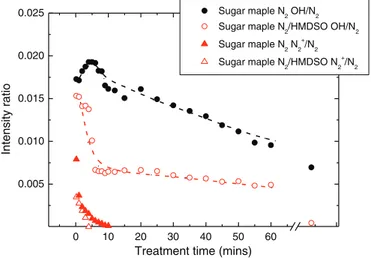
Fig. 4shows the N2+(391 nm)-to-N2(337 nm) and OH (309
nm)-to-N2(337 nm) intensity ratios for sugar maple samples exposed to
pure N2plasma and N2/HMDSO (20 ppm) plasmas. As a consequence
of the decrease in O2content and regime transition, the N2+-to-N2
ratio decreased with increasing plasma exposure time, going from 0.008 right after ignition of the first few discharges to 0 in about 10 min. A faster decrease was observed with 20 ppm of HMDSO, indi-cating that the growth of a thin layer on the plasma-exposed topmost surface prevents the release of air and humidity entrapped in the wood substrate. The OH-to-N2ratio also decreased with treatment
time in N2although the decrease was slower than for the N2+-to-N2. In
addition, the OH-to-N2ratio for samples pumped down to 50 mTorr
(~0.007) was comparable to the one measured for t = 60 min (~0.009), indicating that surface etching of the wood components which is expected to release significant amounts of OH remains impor-tant independently of wood outgassing effects. On the other hand,
with 20 ppm of HMDSO, the decrease of OH/N2 with t was much
more drastic than in pure N2, reaching the same 0.009 ratio in under
5 min and 0.005 after 60 min. This result is again ascribed to the depo-sition of a thin “barrier” layer preventing etching reactions.
3.2. Role of substrate outgassing on surface wettability
Fig. 5compares the dynamic water contact angles of sugar maple
samples exposed to a N2 plasma with 20 ppm HMDSO for 1 and
60 min with those obtained right after sanding. Dynamic water con-tact angles for samples outgassed prior to plasma exposure are also shown for comparison. All data were recorded as a function of time following the contact between the water droplet and the wood sur-face. As expected, freshly-sanded wood surfaces exhibited a highly hydrophilic behavior with the water droplet being completely
absorbed within a few seconds; a result that is in good agreement with those reported in[31]. For t = 60 min, both the as-received and pumped-down samples showed a hydrophobic behavior with static contact angles in the 140° range. Major difference arises when comparing the samples treated for 1 min. For samples pumped down, the WCA were in the same range as the samples treated for 60 min whereas those that were not outgassed beforehand exhibited a more complex time behavior: the WCA first rapidly decreased with a decay rate comparable to those of freshly-sanded samples and then decreased more slowly, going from ~50° to ~40° in about 25 s. This suggests that outgassing of the sample during such short treatment time leads to a more hydrophilic SiOx-like layer rather than the
more hydrophobic organosilicon layer expected from deposition in pure N2–HMDSO discharges[18]. As for the “two-rate” time behavior,
it can probably be ascribed to the non-conformity of the coating as a result of both the short treatment time and the high roughness (even after sanding) of wood surfaces.
The water contact angle at 1 s after the water drop is presented in
Fig. 6as a function of treatment time for sugar maple and black spruce
samples exposed to N2 discharges with 20 ppm of HMDSO. For
outgassed samples, similar WCAs were obtained for t ranging from 1 to 60 min for both wood species. The deposition rate in such con-ditions was roughly estimated by measuring the coating thickness using a KLA-Tencor Alpha-Step IQ profiler. Wood surfaces being too irregular to obtain reliable thicknesses, measurements were performed on a thick glass plate exposed to the same operating con-ditions with the same mean absorbed power of 1.0 W cm− 3in order
to get an order of magnitude of the deposited thickness. A deposition rate of about 15 nm/min was obtained. The results presented inFig. 4
thus indicate that even coatings with thicknesses which are much lower than the wood roughness (for example, of about 15 nm for t = 1 min.) can produce high static WCA. On the other hand, for samples not outgassed beforehand, the WCA increased from ~50° for t = 1 min to ~ 140° for t = 60 min. As mentioned earlier and shown below, this behavior can be ascribed to the wood outgassing which modifies the chemical composition of the plasma-deposited layer. As wood outgassing evolves, WCA values approach those expected for deposition in nominally pure N2/HMDSO discharges.
WCA measurements being surface sensitive, virtually seeing only the first monolayer of the substrate, high contact angles can be obtained at long treatment times even if the first few monolayers deposited on the topmost wood surface could be more hydrophilic. In the case of black spruce, a less prominent increase was observed, with the WCA going from ~125° for t = 4 min to 140° for t = 60 min. This result is consistent with the quicker outgassing time of this wood species underlined from the analysis of the emission
0 10 20 30 40 50 60
0.005 0.010 0.015 0.020
0.025 Sugar maple N2 OH/N2
Sugar maple N2/HMDSO OH/N2 Sugar maple N2 N2+/N2 Sugar maple N2/HMDSO N2+
/N2
Intensity ratio
Treatment time (mins)
Fig. 4. N2+-391 nm-to-N2-337 nm bandhead intensity ratio and OH-309
nm-to-N2-337 nm bandhead intensity ratio as a function of exposure time to either a N2or
N2/HMDSO (20 ppm) discharge with a non-degassed sugar maple substrate.
0 2 4 6 8 10 12 14 16 18 20 22 24 10 100 Freshly sanded 1min 1min (outgased) 60mins 60mins (outgased)
Water contact angle (degrees)
Time after water drop (s)
Fig. 5. Dynamics of the wetting process on sugar maple wood samples exposed to N2\HMDSO (20 ppm) plasmas for times ranging from 1 to 60 min. WCAs from
spectra (Fig. 3). It is worth mentioning that for samples not outgassed beforehand, a non-linear deposition rate is expected due to the evolv-ing discharge characteristics in regards to sample outgassevolv-ing. There-fore, an absolute thickness value of the hydrophilic or hydrophobic coating deposited on wood cannot simply be estimated from mea-surements of the deposition rates on glass samples as these samples are not subjected to the same outgassing effects.
3.3. Role of substrate outgassing on surface chemistry
To demonstrate the role of wood outgassing on the evolution of the chemical composition of the plasma-deposited layers obtained
in N2 discharge with 20 ppm of HMDSO, ATR-FTIR analysis was
performed on selected wood samples.Fig. 7compares the normalized ATR-FTIR spectra as a function of treatment time for sugar maple samples pumped down to about 50 mTorr before plasma exposure. A spectrum from a non-treated, freshly-sanded sample is also shown for comparison. The main visible features in the 3400 cm− 1
region corresponds to the O\H stretching mode while those in the 1800 cm− 1to 900 cm− 1range can be attributed to the wood's main
constituents, namely cellulose, hemicelluloses and lignin which are
essentially composed of C\O, C_C, C\H and C_O groups[32,33].
For t = 1 min, the spectrum is very similar to the raw spectrum due to the expected very low thickness of the plasma-deposited layer. For longer treatment times, there is a sharp increase in the signal from
hydrophobic functional groups such as CHx in the 2900 cm− 1
region as well as Si-(CH3)2,3at 800 and 840 cm− 1. Moreover, there is
a visible broadening of the 1230 cm− 1band leading to a single band
at 1259 cm− 1for the 60-minutes deposited sample. This result can be
attributed to the apparition of a new absorption band due to Si\C stretching in Si(CH3)2and a decrease in wood's main features as the
thickness of the plasma-deposited coating increases.
Fig. 8compares the influence of treatment time on the Si(CH3)2-to-CO
and CHx-to-OH band intensity ratios for outgassed (Fig. 8A) and
non-outgassed (Fig. 8B) samples exposed to the same discharge conditions. The prompt augmentation of the hydrophobic features like Si(CH3)x
and CHxover the wood's natural hydrophilic features OH and CO is
con-sistent with the highly hydrophobic behavior deduced from dynamic WCA measurements and from the quasi-linear increase of the coating thickness with plasma exposure time. On the other hand, for samples not-outgassed prior to plasma exposure, the Si(CH3)2-to-CO and
CHx-to-OH band intensity ratio remained quasi constant within the first
few minutes due to the important concentration fraction of wood hydro-philic groups; a feature that is consistent with the high wettability reported above for such surfaces. At longer treatment times, both ratios sharply increased, in good agreement with the prominent increase of the WCA displayed inFig. 6.
Since ATR-FTIR studies only provide relative information on the surface composition, a quantitative investigation was performed through XPS measurements.Table 1shows the atomic concentration fraction (in %) of C, O, N and Si for sugar maple samples exposed to N2–HMDSO (20 ppm) discharges for t ranging from 5 to 60 min.
Values for untreated and outgassed samples are also shown for com-parison. A drastic decrease of the carbon concentration together with an important increase of the Si, N, and O concentration was observed at short treatment times. As wood outgassing evolves, i.e. for longer treatment times, the C concentration increased, the O concentration decreased, and the N concentration increased, while the concentration
0 10 20 30 40 50 60 40 60 80 100 120 140 160
Water contact angle (degrees)
Treatment time (mins)
Outgased sugar maple Sugar maple Outgased black spruce Black spruce
Fig. 6. Influence of the plasma exposure time on the WCA for sugar maple and black spruce wood samples exposed to N2/HMDSO (20 ppm) plasmas. Operating conditions
are the same than inFig. 1.
4000 3500 3000 2500 2000 1500 1000 60 mins 15 mins 1 min Intensity (a.u.) Wavenumber (cm-1) Untreated
Fig. 7. Influence of the plasma exposure time on the ATR-FTIR spectra for outgassed sugar maple samples exposed to N2/HMDSO (20 ppm) plasmas. The spectrum of
untreated sugar maple is also shown for comparison. The normalization was done using the C\O band at approx. 1018 cm−1. Operating conditions are the same than inFig. 1.
0.0 0.3 0.6 0.9 1.2 1.5 1.8 0 10 20 30 40 50 60 0.0 0.3 0.6 0.9 1.2 1.5 1.8 CH3/OH Si(CH3)2/C-O
A
Intensity ratioTreatment time (mins)
B
Fig. 8. Influence of treatment time on intensity ratio of Si(CH3)2(800 cm− 1), CH3
(2960 cm− 1) and OH (3350 cm− 1). ATR-FTIR bands for A) an outgassed sugar maple
sample and B–C) a non-outgassed sugar maple sample. Operating conditions are the same than inFig. 1.
Table 1
Influence of the treatment time, t, on the atomic composition (at.%) of sugar maple samples treated in a N2–HMDSO discharge. Measurements were performed
immedi-ately after the plasma treatment. Values for untreated and outgassed samples are shown for comparison.
Element Untreated 5 min 15 min 30 min 60 min Outgassed
C1s 77.3 18.7 19.8 33.2 37.7 52.0
O1s 20.6 48.9 47.9 35.4 30.4 19.7
N1s Trace 2.5 1.4 2.8 4.5 5.3
of Si remained more or less constant. These results are consistent with our ATR-FTIR observations indicating that substrate outgassing leads to a more SiOx-like layer that shifts towards Si(CH3)xat longer plasma
exposition times when outgassing effects are less important. This fea-ture is better illustrated inFig. 9that shows the O-to-Si, C-to-O and C-to-Si atomic concentration ratios deduced from the data displayed inTable 1as a function of plasma deposition time. For t = 5 min, the O-to-Si ratio was 1.6, which is close to the composition of the highly hydrophilic SiO2coating. This ratio decreased down to about 1, the
value expected for deposition of large O-Si-(CH3)3fragments (equal
amount of Si and O). As for the C-to-Si and C-to-O, both atomic compo-sition ratios varied similarly, going from about 0.5 for t = 5 min to about 1.5 for t = 60 min. The values are however lower than those of the C-to-Si and C-to-O ratios of about 3 achieved for samples outgassed beforehand and consistent with the deposition of O-Si-(CH3)3groups.
The lower C-to-Si and C-to-O values obtained without prior outgassing of the wood samples indicates that small amounts of oxygen-based products remain in the gas-phase even after 60 min of discharge expo-sure and that these species still contribute to the removal of carbon groups from the coating. Similar atomic ratios were obtained on black spruce surfaces (not shown), although the decrease of the O-to-Si and increase of the C-to-Si and C-to-O were, as expected, more rapid. 4. Conclusion
In summary, the objective of this work was to examine the influ-ence of substrate outgassing on the deposition dynamics of hydro-philic or hydrophobic functional groups on sugar maple and black spruce wood substrates exposed to atmospheric-pressure dielectric barrier discharges in N2–HMDSO gas mixtures. Electrical
characteri-zation of the discharge revealed a transition from a filamentary to a homogeneous regime and a decrease of the absorbed power with in-creasing plasma treatment time. For samples outgassed beforehand, the discharge was homogeneous independently of plasma exposure time. Optical emission spectroscopy showed fairly constant emission from N2and a decrease of OH and N2+emissions with t. Change in the
discharge stability and plasma emission properties were ascribed to outgassing of air and humidity from the wood substrates. Outgassing effects were found to vanish with time due to the nearly complete “pumping” of free air and humidity entrapped in wood and the pro-gressive deposition of an organosilicon “barrier” layer. Surface wetta-bility of the plasma-deposited coatings was examined through water contact angles and revealed the formation of highly hydrophobic wood surfaces. However, for short deposition times, the surfaces remained hydrophilic due to the formation of SiOxlayer. Such feature
is typical for HMDSO deposition in the presence of small admixtures of oxygen. In our case, however, oxygen was injected in the gas phase involuntarily due to substrate outgassing. Future studies should exam-ine whether the presence of such “interfacial” SiOxlayer during growth
of hydrophobic organosilicon coatings in N2/HMDSO discharges helps
or deteriorates the adherence and long-term dimensional stability of the coatings.
Acknowledgments
This work was supported by the National Science and Engineering Research Council (NSERC), the Fonds de Recherche du Québec – Nature et Technologies (FRQNT) and the Association Nationale de la Recherche (ANR). The authors would also like to acknowledge the financial con-tribution of the Commission Permanente de Coopération Franco-Québécoise (CPCFQ) through the Samuel de Champlain program, the Direction des Relations Internationales of the Université de Montréal, and the Région Midi-Pyrénées.
References
[1] S. Kanazawa, et al., J. Phys. D Appl. Phys. 21 (1988) 838–840.
[2] F. Massines, et al., Eur. Phys. J. Appl. Phys. 47 (2) (2009) 22805.
[3] H. Luo, et al., Appl. Phys. Lett. 91 (22) (2007) 221504.
[4] K.V. Kozlov, et al., J. Phys. D Appl. Phys. 38 (4) (2005) 518–529.
[5] A. Sublet, et al., Plasma Sources Sci. Technol. 15 (4) (2006) 627–634.
[6] F. Massines, et al., J. Appl. Phys. 83 (6) (1998) 2950–2957.
[7] B. Eliasson, U. Kogelschatz, IEEE Trans. Plasma Sci. 19 (2) (1991) 309–323.
[8] U. Kogelschatz, B. Eliasson, W. Egli, J. Phys. IV 07 (C4) (1997), (C4-47-C4-66).
[9] U. Kogelschatz, Plasma Chem. Plasma Process. 23 (1) (2003) 1–46.
[10] B. Eliasson, U. Kogelschatz, J. Phys. B: At. Mol. Phys. 19 (8) (1986).
[11] U. Kogelschatz, IEEE Trans. Plasma Sci. 30 (4) (2002) 1400–1408.
[12] M. Šimor, et al., Appl. Phys. Lett. 81 (15) (2002) 2716.
[13] D. Braun, U. Kuchler, G. Pietsch, J. Phys. D: Appl. Phys 24 (4) (1991).
[14] D. Trunec, et al., J. Phys. D: Appl. Phys. 37 (15) (2004) 2112–2120.
[15] L.-B. Di, et al., J. Phys. D: Appl. Phys. 42 (3) (2009) 032001.
[16] P. Favia, R. d'Agostino, Surf. Coat. Technol. 98 (1998) 1102–1106.
[17] R. Brandenburg, et al., J. Phys. D: Appl. Phys. 38 (11) (2005) 1649–1657.
[18] K. Schmidt-Szalowski, et al., Plasma Polym. 5 (3/4) (2000) 173–190.
[19] O. Levasseur, et al., Plasma Processes Polym. 9 (11–12) (2012) 1168–1175.
[20] R. Mahlberg, et al., Int. J. Adhes. Adhes. 18 (1998) 283–297.
[21] A.R. Denes, et al., Holzforschung 53 (1999) 318–326.
[22] G. Avramidis, et al., Wood Mater. Sci. Eng. 4 (1–2) (2009) 52–60.
[23] M. Odraskova, et al., 28th ICPIG, Institute of Plasma Physics AS CR, v.v.i., Prague, Czech Republic, July 15-20 2007.
[24] M. Strobel, C.S. Lyons, Plasma Processes Polym. 8 (1) (2011) 8–13.
[25] R. Di Mundo, F. Palumbo, Plasma Processes Polym. 8 (1) (2011) 14–18.
[26] N. Gherardi, et al., Plasma Sources Sci. Technol. 9 (2000) 340–346.
[27] N. Naudé, et al., J. Phys. D: Appl. Phys. 38 (4) (2005) 530–538.
[28] F. Massines, et al., Surf. Coat. Technol. 174–175 (2003) 8–14.
[29]R. Brandenburg, et al., J. Phys. D: Appl. Phys. 38 (13) (2005) 2187–2197.
[30]A. Fridman, A. Chirokov, A. Gutsol, J. Phys. D: Appl. Phys. 38 (2) (2005) R1–R24.
[31]A. Wolkenhauer, et al., Int. J. Adhes. Adhes. 29 (1) (2009) 18–22.
[32]A. Awal, M. Sain, J. Appl. Polym. Sci. 122 (2) (2011) 956–963.
[33]K.K. Pandey, J. Appl. Polym. Sci. 71 (1999) 1969–1975.
0 20 40 60 0.0 0.5 1.0 1.5 2.0 2.5 3.0 0.0 0.5 1.0 1.5 2.0 2.5 3.0 O1s/Si2p C1s/O1s C1s/Si2p Atomic ratio
Treatment time (mins)
C/O in O-Si-(CH3)3
O/Si in O-Si-(CH3)x
Outgassed
O/Si in SiO2
Fig. 9. Influence of treatment time on atomic concentration ratios of O-to-Si, C-to-O and C-to-Si obtained by XPS analysis for samples exposed to N2/HMDSO plasmas.