Laboratoire d’Economie de Dauphine
WP n°8/
2011
Caroline Berchet
(LEDa-LEGOS, Université Paris Dauphine, IRDES)
Nicolas Sirven
(IRDES)Pôle Laboratoire d’Economie et de Gestion des Organisations de Santé (LEGOS) Place du Maréchal de Lattre de Tassigny 75775 Paris Cedex 16
Tél (33) 01 44 05 44 46 Fax (33) 01 44 05 40 67
E-mail : webmasterlegos@dauphine.fr Site : www.legos.daupine.fr
08
Autom
ne
Document de travail
Cross-Country Performance in Social Integration of
Older Migrants – A European Perspective
1
Cross-Country Performance in Social Integration
of Older Migrants – A European Perspective
Caroline Berchet
* and Nicolas Sirven
This version: November 2011
Abstract: This paper provides new empirical evidence on the relationship between migration and social integration. It explores the hypothesis that migrants essentially differ from non-migrants with regard to the length of residence in the country – which is a proxy of migrants’ social distance to natives. The determinants of social participation and interpersonal trust are examined at both the individual and institutional level. Using SHARE data and macroeconomic series, we first analyse the influence of migratory status and immigrant length of stay in the host country on social integration indicators. We then examine the role institutional characteristics play on cross-country differences in speed of social integration (i.e. immigrants’ propensity to social participation according to their length of stay in the host country). As expected, the immigrant population presents a lower likelihood than the native population to get involved in social activities and to trust other people. Nevertheless, the more immigrants have spent time in the host country, the more they take part in social activities. The analysis also reveals significant cross-country differences in immigrants’ speed of social integration. Macroeconomic series like the GINI coefficient of income inequality and the Corruption perceived index could explain these differences. From a public policy perspective, our results suggest that immigrants’ social integration is more rapidly achieved in “fair” countries – i.e. those with a more favourable social environment – where the levels of income inequality and perceived corruption are lower.
Keywords: Social capital, Ageing, Income inequality, Multilevel models. JEL Codes: F220, O520, C310.
“This work is part of the HEAPS research program (Health Economics of Ageing and Participation in Society,
www.irdes.fr/Heaps) supported by grant number ANR-09-JCJC-0141-01 awarded by the National Research Agency, France. This paper uses data from SHARELIFE release 1, as of November 24th 2010 or SHARE release 2.4.0, as of March 17th 2010. The SHARE data collection has been primarily funded by the European Commission through the 5th framework programme (project QLK6-CT-2001- 00360 in the thematic programme Quality of Life), through the 6th framework programme (projects SHARE-I3, RII-CT- 2006-062193, COMPARE, CIT5-CT-2005-028857, and SHARELIFE, CIT4-CT-2006-028812) and through the 7th framework programme (SHARE-PREP, 211909 and SHARE-LEAP, 227822). Additional funding from the U.S. National Institute on Aging (U01 AG09740-13S2, P01 AG005842, P01 AG08291, P30 AG12815, Y1-AG-4553-01 and OGHA 04-064, IAG BSR06-11, R21 AG025169) as well as from various national sources is gratefully acknowledged (see www.share-project.org for a full list of funding institutions).”
* Corresponding Author: caroline.berchet@dauphine.fr; berchet@irdes.fr
LEDa-LEGOS, Université Paris-Dauphine. Place du Maréchal de Lattre de Tassigny, 75775 Paris
Cedex 16.
IRDES (Institute for Research and Information in Health Economics), 10, rue Vauvenargues, 75018
2
1. Introduction
Successful integration strategies of migrants within the European Union rely on the one hand, on labour market policies such as antidiscrimination and migrant entrepreneurship promotion, and on the other hand, on social participation and social cohesion by promoting equal access to services (European Commission, 2005). They are in line with the broader policy of promoting social inclusion that is a one of the five key areas of the Europe 2020 strategy (European Commission, 2009). Social inclusion is indeed “the process from which individuals participate to society through professional activity, *…+ interaction with others, participation to collective institutions” (Schnapper, 2008). In the context of demographic ageing of the population, older persons have become one of the most important target groups of the Europe 2020 strategy in terms of reducing the risk of social exclusion. Amongst the various measures to promote the social inclusion of the older population, EU policies give special attention to encouraging volunteering (Bosswick & Heckmann, 2006; Naegele & Schnabel, 2010).
The positive outcomes of social participation for older people have long been documented in the empirical literature on “social capital”, underlining either the intrinsic features of interpersonal connectedness to alleviate social isolation (Lelkes, 2010), or the positive externalities for individual health (Sirven & Debrand, 2008) and other economic and well-being measures (Putnam, 1993; Woolcock, 1998). Although social capital usually consists of cultural and structural aspects (Grootaert & Van Bastelaer, 2002) respectively captured through the level of generalised trust and involvement in social activities, focus on the latter dimension may appear a more practicable target – since fostering civil society organisations depends to a large degree on the structural framework provided by the State. On this basis, the Council of the European Union designated the year 2011 as the “European Year of Voluntary Activities” (OJ, 2010).
The stake is important since today 30% of Europeans aged 55 or more already take part in voluntary
associations (Eurobarometer, 2010). However, there are large differences between countries in the
rates of social participation and formal volunteering by older people which follows a north–south gradient in Europe (Hank & Erlinghagen, 2010). Country specific cultural and historical backgrounds
are often cited to explain such differences, and levels of economic development and expenditure on
social services are also believed to play a role in individual decisions of involvement in voluntary activities (GHK, 2010). Focus on cross-country features to better understand the determinants of social capital concurs with a need to jointly identify people’s individual dispositions to take part in
social participation. European institutions indeed acknowledge that “at the moment, information on the preferences and priorities of volunteers tend to be lacking” (Eurofound, 2011).
The literature on social capital provides some interesting highlights on the factors that promote social participation and generalised trust. Amongst the usual determinants of social capital at the individual level (education, employment status, income, etc.), being an immigrant reduces the chances to take part in social activities (Breton, 2003; Kazemipur, 2004). One obvious reason is that migrants tend to face the usual social disadvantages that hamper social capital – significant gaps persist between this group and the majority population in terms of poverty, income, health, unemployment, education and early school-leaving (Berchet & Jusot, 2010). Another reason relies on the fact that, for the same age, migrants also differ from natives by a reduced length of residence in the host country – what may lead to a lesser degree of embededness in the (formal and informal) institutional environment of the host country (Aleksynska, 2011).
A first hypothesis to be tested could be that the longer migrants dwell in the country, the more they become familiar with resident norms and values, thus facilitating participation in social activities and enhanced generalised trust. Such a process can be seen as a reduction in the “social distance”
3 between migrants and natives that fosters social connectedness (Akerlof, 1997; Van der Vegt, 2002). A second hypothesis to be tested could be that some countries in Europe perform better than others in terms of social participation and generalized trust – with equal levels of migrants’ “length of
residence” – because of national systems characteristics1. Put differently, some countries with
different levels of migrant’s “length of residence” may experience similar levels of migrants’ social capital. This being empirically verified, the question would be why some European countries have different “speed of integration”? Focus on cross-country national features would then shed light on this issue.
Data from the Survey of Health, Ageing, and Retirement in Europe (SHARE) combined with macro-economic series meet the requirements to test these two assumptions. These databases allow combining individual socio-economic data with macro series of the socio-economic context and the features of welfare state regimes in multilevel models. SHARE data cover 14 countries in wave 2 (2006-07) and provide individual retrospective information on migrants’ year of arrival in the country of residence. SHARE focus on respondents aged 50 and over provides enough time depth to analyse the influence of migrant’s length of residence on the usual variables of social capital.
The set of individual and context variables to be included in the models are discussed in the next section on the basis of the existing empirical literature of the determinants of social capital. Section three presents the data sources in the detail and some descriptive statistics of the main variables of interest. Econometric models and models estimates are respectively discussed in sections four and five. Summary and policy implications are drawn in the conclusion.
2. Survey of the Literature
2.1. Individual determinants of social capital
Among the most commonly cited variables, education is of paramount importance in the decision to invest in social capital. On the one hand, higher education provides access to social network, increases opportunities for social participation, fosters communication skills and develops values or moral norms which promote interpersonal trust (Coleman, 1988; Brehm & Rahn, 1997; Glaeser et al, 2000; Fukuyama, 2000; Christauforou, 2005; Fidmurk & Gerxhani, 2005; Rupasingha et al, 2006). On the other hand, recent debate in the literature suggests that the individual “distance” to the average level of education in a given area may be of significant influence on the individual decision to get involved in social activities (Helliwell & Putnam, 2007).
A number of studies have empirically tested the effect of income and occupational status on both social participation and trust (Brehm & Rahn, 1997; Glaeser et al., 2000; Alesina & La Ferrara, 2000; Christauforou, 2005; Kumlin & Rosthein, 2005; Fidmurk & Gerxhani, 2005; Oorschot & Arts, 2005; Rupashingha et al., 2006). Three important factors are viewed in this light. First, the opportunity cost of social participation is believed to be lower than labour market outcomes. Glaeser (2000) predicts that individuals with a high income will invest less in social capital. He found however no evidence of this prediction and shown a positive relationship between social capital and income. Second, working activity and job-seeking would reduce — according to a substitution effect — individual time-constraint (or leisure time) that social participation requires. Third, relatively deprived or
1
Although some recent attention has been drawn to institutional features of the country of origin (Aleksynska, 2011), it appears more relevant here to focus on the host country characteristics because the population of interest is made of older people who migrated a long time ago. This population may be more influenced by a socio-economic environment they are imbedded in since several years.
4 unemployed people are likely to develop sentiments of stigmatization or discrimination, which not only undermine incentives to participate in social activity, but lead also to distrust individuals.
Marital status, age, gender and health are also found to be other relevant social capital determinants, although their impact on social participation and trust is not unequivocal. First, familial constraints could be a barrier to invest in social capital since individuals with preschool children tend to have a lower social participation (Alesina & La Ferrara, 2000), whereas on the other hand, having children at school could encourage inter-family networking which increases opportunities to invest in social capital (Alenisa & La Ferrara, 2000). Regarding the effect of age, some studies have shown an inverted U-shaped curve (Glaeser et al., 2000; Rupashingha et al., 2006) while other one have proved that older individuals tend to invest more in social participation (Oorschot & Arts, 2005). It seems, thirdly, that men tend to have a higher level of social participation — all other things being equal —; thereby emphasizing the cost for women to occupy multiple roles (Alenisa & La Ferrara, 2000; Fidmurk & Gerxhani, 2005). There is, finally, a dual causal effect between health status and social participation (Sirven & Debrand, 2011). A good health status may improve social participation and conversely social participation is found to increase health status or health care use. Sirven & Debrand (2011) have shown that the causal effect of health on social participation is larger than the feedback effect of social participation on health.
The migrant population under-invest in social capital (Alesksynska, 2011) for two reasons: they face more social disadvantage than the native population (Berchet & Jusot, 2010)and they suffer from a destruction of social bonds due to migration (Breton, 2003; de Palo et al., 2007). Mevertheless, migrants may benefit from communitarians and social connectedness in the host country. In this light, even if migration may hamper bonding social capital represented by relationship between close friends or neighbours (Breton, 2003; De Palo et al., 2007), bridging social capital related to social relationship between individual who share similar individuals’ characteristics may be encouraged (Kazemipur, 2003). Immigrant population may thus develop strong communal ties.
2.2. Institutional features matter
- Political, social, and economic context
Studies in political science provide empirical evidences in favour of the positive relationship between democracy and social capital. Democratic institutions seem to encourage the formation of social participation and trust since they provide a suitable climate for social interaction (Muller & Seligson, 1994; Sides 1999; Paxton, 2002; Stolle, 2003). Conversely, a non-democratic government may have the incentive to discourage both the formation of social activity and generalized trust in order to undermine the power of government opposition (Stolle, 2003). It has been shown that political freedom, the respect of civil rights and civil liberties significantly increase the level of trust and individual social participation, while corruption tends to decrease both social integration indicators (Muller & Seligson, 1994 ; Sides, 1999; Knack & Zack, 2001; Rosthein & Stolle, 2002; Paxton, 2002; Fidmurk & Gerxhani, 2005).
Additional empirical evidence also suggests that social heterogeneity measured by ethnic fractionalisation discourages individual investment in social capital (Sides, 1999; Alenisa & Ferrara, 2000; Kervin & Kline, 2002; Rupasingha et al., 2006; D’Hombres et al., 2010). Sides (1999) argues that ethnic fractionalisation may reflect a conflicted society which in turn decreases both social participation and trust. This last hypothesis suggests a preference for homogeneity; individuals prefer to interact with people that are similar to themselves (Alenisa & Ferrara, 2000). In light of this hypothesis, being part of a minority may hamper the investment in social capital through sentiments of stigmatization or marginalisation, hindering therefore the social consciousness of migrant population.
5 Although these two strands of the literature are of little relevance in the EU context, some other studies in economics have established that a country’s macroeconomic environment influences the level of social capital. First, individuals residing in countries with higher GDP per capita tend to have higher chances to take part in social activities and to present higher levels of trust (Sides, 1999; Whiteley, 2001; Rupasingha et al., 2006, Aleksynska, 2011). Second, empirical research indicates that non-egalitarian societies present a significantly lower level of individual social participation and interpersonal trust (Sides, 1999; Alenisa & Ferrara, 2000; Knack, 2002; D’Hombres et al., 2010). Greater income inequalities in a society are indeed believed to hinder incentives to invest in social capital: “when society’s rewards become more inequitably distributed; people may begin to feel exploited by others, thereby diminishing their faith in their fellow citizens” (Brehm & Rahn, 1997: 1009).
The influence of income inequality on immigrant social capital has to our knowledge never been studied in the empirical literature. However, greater level of income inequality in a society is frequently associated with greater economic segregation (Durlauf, 1996), which may imply a more important relative deprivation for immigrant population. The social environment appears not to be receptive for immigrant, decreasing their sense of cooperation or their wish to integrate in the society and leading them deprived of social participation (Breton, 2003).
- Welfare states regimes
The influence of welfare state regimes on people’s life in Europe has been discussed — as a matter of secondary importance — in terms of its potential consequences on civil society and social networks (Scheepers et al., 2002; Van Oorschot & Arts, 2005). On the one hand, some researchers emphasised that welfare state regimes contribute to “crowd out” civil society structure by hindering social relationships or social participation. Welfare state regimes are considered as a substitute for informal solidarity created by social participation, networking or interpersonal trust (Van Oorschot & Arts, 2005). It therefore encourages social isolation and selfishness which hampers social participation and the development of trust. Individual are then dependant of formal solidarity and may have lost their sense of cooperation and coordination (Fukuyama, 2000; Scheepers et al., 2002).
On the other hand, welfare state regimes are believed to “crowd in” civil society by strengthening social network, social participation and trust. The empirical literature mainly support the latter idea suggesting that welfare state regimes are considered as complementary to social network and participation in social activities. In this light, welfare states systems help integrating individuals having difficulties by providing them financial support leading to social cohesion, social participation and social consciousness (Rosthein, 2001; Van Oorchot, 2003; Salamon & Sokolowski, 2003; Van Oorchot & Arts, 2005). In addition, several studies have highlighted the importance of impartial institutions, as well as perception of equality on fostering generalized trust. For instance, in Sweden and the United States, generalized trust is higher among individuals who have benefited from universal welfare state programs. Conversely, the use of selective welfare state program may impede generalised trust due to discretionary behaviour and potential discriminatory practice from bureaucrats (Rosthein & Uslaner, 1999; Rosthein & Stolle, 2003; Stolle, 2003; Kumlin & Rosthein, 2005).
Welfare state regimes may generate a double-edge effect with respect to migrant integration in the host country. On the one hand, welfare state institutions may imply moral hazard if they lower the cost of integration in the host country (Nannestad, 2007). This hypothesis suggests that the generosity of welfare states is negatively correlated with migrant social participation and generalized trust (crowding out). On the other hand, if welfare state institutions foster migrant generalized trust
6 and encourage them to take part in civil society through social participation, then the “cooperation” model (crowding in) is more relevant.
3. Data
3.1. Sources
The analysis of the individual determinants of social engagement and interpersonal trust is based on data from the second wave of the Survey of Health, Ageing, and Retirement in Europe (SHARE,
www.share-project.org). SHARE is a multidisciplinary and cross-national cohort of individual data on health, socio-economic status and social and family relationships of individuals aged 50 and over (Börsch-Supan & Jürges, 2005). They are a balanced representation of the various regions in Europe, ranging from Scandinavia (Denmark and Sweden) through Central Europe (Austria, France, Germany, Switzerland, Belgium, the Netherlands, and Ireland) and Eastern Europe (Poland, The Czech Republic), to the Mediterranean (Spain, Italy and Greece). The second wave (2006-2007) consists of individuals surveyed in 14 countries and provides information on health, socio-economic status, social and family networks. Analyses are based on a sample of 31,852 non institutionalised individuals aged 50 and over with non-missing observations for the variables retained in the analysis (full rank data matrix).
Institutional variables describing the socio-economic context and the generosity of welfare state
regimes are taken from different sources. The OECD database (http://stats.oecd.org/) provides
comparative statistics and offers an overview of recent economic trends through the presentation of a wide range of short-term economic indicators not only for the OECD member countries but also for non-member countries. Economic indicators that provide the OCDE database concern for instance national accounts, demography, development, finance, health, social, and welfare statistics. Additional macro-series are taken from Transparency International and Alesina et al. (2003).
3.2. Variables
- Dependant variables: Indexes of social capital
Two dichotomous dependant variables are considered to measure social integration: involvement in social activities and interpersonal trust. Involvement in social activities is derived from the participation to any of the six social activities (voluntary/charity work; providing help to family, friends or neighbours; educational/training courses; sport/social club; religious organisation; and political activities). The variable takes the value 1 if the respondent claims to take part in at least one of these activities and 0 if he does take part in none of them mentioned. The scope of activities is rather large in order to best capture the idea of social integration. Different combinations of the items have been tested and the six social activities retained here are associated with the best scale reliability coefficient (α = 0.469) than any other combination of a lesser number of items. To measure interpersonal trust, respondent are asked to state on a scale from 0 to 10 where 0 means that one can't be too careful in dealing with people and 10 means that people can be trusted. The variable is then dichotomised, taking the value 1 if respondents provide a score that is higher than five and 0 if the level of trust ranges between 0 and 5.
- Migration related measures
The respondent’s country of birth and age at migration are used in our analysis to construct migration related measures. SHARE respondents are asked whether or not they were born in the country of interview which enables the sample to be divided into two categories: the native-born
7 population and the immigrant population. The initial intuition behind this sub-division is that native-born population has a better knowledge of the country’s formal (system, administration, law, etc.) and informal (norms, values) institutions which makes these people more able to take part in social activities and to have a higher level of trust in other people. Conversely, a potential lack of information or a lower degree of embededness in the socio-cultural environment may hinder the prospects of the immigrant population to get involved in social activities and to trust other people. Furthermore and according to the European Commission, immigrants in Europe face barriers and disincentives of social participation not only because they are often stigmatized or treated as undesirables but also because they may be deprived of certain rights, freedom and opportunities which impede both their economic and social integration (European Commission, 2003).
In addition, we suspect that social integration may not be homogeneous among the immigrant population. In particular, social integration could differ according to immigrant length of residence in the host country. Immigrants were asked to report their years of migration into the country, which enables to create a proxy of length of residence using their age at migration (which is equal to years of migration minus years of birth). The length of stay in the host country is often used to capture immigrant social assimilation (Aleksynska, 2011); a process that supposes a change in migrants’ behaviour over time. Previous researches (Aslund et al., 2009; De Palo et al., 2007) indicate that migrants’ greater length of stay in the host country is associated with both greater economic and social condition (social relationship, education, employment and household status). In this respect, it has been shown that immigrants may be initially at disadvantages but the social distance between native and immigrants tend to reduce over time and become nil after a long stay in the host country. The acknowledged positive consequences (OECD 2011) on social mobility, job market participation, and access to social right, make the “citizenship” criterion a potential additional candidate for our analysis. Nonetheless, in most OECD countries an immigrant needs to be resident in the host country for a number of years before being eligible to the national citizenship (OECD, 2010). As a consequence, immigrant naturalisation is highly correlated with immigrant length of stay in the host country or with their age at migration (OCDE, 2011). In addition, we believe that the length of stay (measured here through age at migration for older people) captures more accurately the long-term dynamic of the process of immigrant assimilation. Conversely, getting the national citizenship could bias the information on the process of immigrant assimilation; some administrative arrangement like marriages of convenience could indeed artificially “speed-up” the social integration time-path (Losego et Lutz, 2006). The last reason not to consider extensively the citizenship variable lies in the fact that interaction terms between migrant and citizenship lead to severe sample size reduction. In spite of all that flaws, the citizenship variable has not been totally discarded of the analysis since it will eventually be discussed in the descriptive statistics and in the robustness checks.
- Other individual covariates
Following previous studies we consider usual individual characteristics. We first consider demographic characteristics like age (continuous) and gender. Education is divided into three different levels: primary level of education, secondary level and tertiary level of education. Marital status is a dichotomous indicator which indicates whether (or not) respondents are married and finally, the labour market status enables to distinguish between employed from unemployed, retired or inactive. Descriptive statistics of these covariates are given in Table A1 in the appendix.
- Context variables
In line with the empirical literature, we employ institutional variables describing the socio-economic context and the generosity of welfare state regimes. We have been limited by the number of macroeconomics variable because the small number of European countries considered in the
8 analysis lead to a dramatic lack of variance. For instance, civil liberties and political rights indicators
display the same maximal scores for most countries.2 Finally, the following five indicators are
considered in the analysis: 3
-The annual growth of the Gross Domestic Product (GDP) reflects changes in the volume of production for the 14 European countries in 2005. We retained the real annual growth of GDP to remove the variation in GDP caused inflation.
-The GINI coefficient of income inequalities is based on equivalent household disposable income after taxes and transfers for the 2005 year. It value ranges between 0 which indicates a perfect equality and 1 in the case of perfect inequality (when all income goes to the individual with the highest income).
-The Corruption Perception Index (CPI), computed by Transparency International, measures the perceived level of public sector corruption. The CPI ranges between 0 indicating a highly clean and not corrupted country and 1 meaning that the country is highly corrupted.
- The ethnic, linguistic and religious fractionalisation Indexes, derived from Alesina et al. (2003) measure various forms of social heterogeneity in each country. These indexes reflect the probability that two randomly selected individuals from a population belonged respectively to a different ethnic, linguistic or religious group.
-The total public expenditure as a percentage of GDP measures the total amount of public expenditures that is devoted to different social programs such as old age, incapacity, health, family, active labour market program, unemployment, housing and other social programs. It includes cash benefits and benefits in kind for 2005. We then considered separately several type of social program
(unemployment, old age, health and incapacity4) in order to explore a different effect of national
public spending by type of expenditures.
Descriptive statistics of these macroeconomic series are given in Table A3 in the appendix. Among the 14 European countries, Sweden and Denmark are the most income egalitarian countries while Italy and Poland appear to be the less egalitarian with GINI coefficients equal to 0.35 and 0.37 respectively. Figures concerning the corruption perception index indicate that Sweden and Denmark are the lowest perceived corrupted countries while Greece, Czech Republic and Poland appear to be the most perceived corrupted countries. The Czech Republic and Ireland display the highest rate of GDP growth in 2005 whereas their total public expenditure seems to be the lowest among the 14 European countries. Finally, the most ethnically and linguistically diverse countries are Belgium and Switzerland with an ethnic fractionalised index of 0.555 and 0.532 respectively and a linguistic fractionalised index of 0.541 and 0.544 respectively. Conversely, Sweden and Denmark are the less ethnically diverse countries while Greece and Ireland are the less heterogeneous in term of linguistic and religious disparity.
3.3. Social Capital of Older Migrants at a Glance
Table 1 displays some raw descriptive statistics of the sample. It is made of 6.7% of migrants, ranging from around 15% in the main “recipient” countries for immigration (Germany, Switzerland and France), to less than 5% in Mediterranean countries (Spain, Greece, Italy) and post-communist countries (Poland, the Czech Republic) that can be seen as “sending” countries. Due to potential sample selection, these descriptive statistics are not directly comparable with national statistics. According to OECD (2010) statistics, the share of immigrant population in our sample is underestimated in Austria, Sweden, Netherland, Spain, Italy, Denmark, Greece, Switzerland, Belgium,
2
http://www.freedomhouse.org/images/File/fiw/FIW_2011_Booklet.pdf 3
The annual growth of GDP, the GINI coefficient of income inequality and the Total public expenditure indicators are taken from the OECD database while the Corruption perception index and the ethnic fractionalisation index are taken from respectively from the transparency international (http://www.transparency.org/policy_research/surveys_indices/cpi) and from Alberto Alenisa own calculation (http://www.anderson.ucla.edu/faculty_pages/romain.wacziarg/papersum.html).
4
9 Czech Republic and Ireland while it is overestimated in Germany, France, Poland. The same evidence can be found regarding age at migration. In SHARE, migrants generally arrive rather young in the host country (22 years old on average) while the average age at migration according to Eurostat is 28 for women and 32 for men in 2008 (Eurostat, 2008). Notice that disparities in immigrant response rate across countries may explain the above differences. Nevertheless, adjusting for individual
characteristics in the statistical models usually corrects such a bias.5
– Insert Table 1 about Here –
Descriptive statistics (see Table A2 in the appendix) provide a cross-country overview of the composition of older Europeans’ social capital in its cultural and structural dimensions. On average, 45.8% have high levels of generalised trust (weighted), and 40.1% of the population aged 50 and over are involved in social activities (weighted). This last figure is higher than the ones recorded by the Eurobarometer because our measure includes more diverse items. By and large, it seems that the two dimensions of social capital are complementary since countries with high proportion of their older population involved in social activities, also have the highest rate of people trusting each other. Not surprisingly, there is a north-south gradient in social capital – where northern countries like Sweden, Netherland or Denmark have the highest level of social capital.
– Insert Figures 1.1 & 1.2 about Here –
Figures 1.1 and 1.2 suggest that this main scheme remains true between the migrant population and the natives. However, consistently with previous research on immigrant social capital (Breton, 2003;
De Palo et al., 2007), the migrant population seem to systematically under-invest in social capital6.
From this perspective, international migration is considered as disturbing for population because it implies an adaption into a new environment. Immigrant population should, for instance, adjust their cultural habits, their social bonds and their institutional knowledge and skills (Breton, 2003). As the descriptive statistics indicate, such transformations may reduce opportunities to participate in society and may be obstacle to social integration.
4. Method
4.1. Overview
The analysis of the determinants of social capital follows a two-step multilevel strategy. In the first step, individual determinants of social engagement and of interpersonal trust are analysed – with special attention to the influence of migration statuses (being a migrant and length of residence in the host country). In the second step, we intend to explain cross-country differences in the speed of integration, i.e. which institutional variables describe best the previous relationship between migration statuses and social capital. Since this last concept is approached here by two variables, we computed two-stage equations of social participation and trust. Considering that involvement in social activities and interpersonal trust are correlated which each other (Brehm & Rahn, 1997), the two stage equation strategy enables to estimate simultaneously both equations which gives not only more efficient measure of the coefficients but also gives more accurate standard-errors. More specifically, the first step of the analysis aims at studying the influence of migration on the probability to get involved in social activity and to trust in other people.
5
The use of individual calibrated weights already reduced such differences 6
Apart from Poland and Italy, but the low rates of migrants in these countries suggest that there may be some statistical imprecision about the previously mentioned rates.
10 4.2. Individual level models
The baseline econometric specification would first test the assumption that migrants’ levels of social capital remain lower than natives’ after the differences in the usual socio-economic characteristics are taken into account (Hypothesis H1.1). Specification of Model 1 allows testing for this assumption:
with k=1, 2. [1]
where y*1i and y*2i are latent variables representing respectively individual i’s social participation and
interpersonal trust. Both equations include Ni a dichotomous variable of individual i's migratory
status. Respondents’ age, gender, marital status, education, labour market status and self-assessed
health status and the constant are inserted in Xi. Finally, dij represents the J-1=13 country dummies
( j = 1, …, 14) and ε1i and ε2i are the error terms that are assumed to be normally distributed. Model
1 thus consists of a system of two Probit equations (also Bivariate Probit) – with the same
independent variables –, so that coefficients α1, β1, γ1 and α2, β2, γ2 can be simultaneously estimated
with Maximum Likelihood. Notice that the correlation coefficient of the error terms ε1 and ε2 will be
denoted ρ (rho) thereafter.
The next assumption to be tested is that, ceteris paribus, migrants differ from the native population by their length of residence in the host country (H1.2). A simple extension of Model 1 wherein age at
migration (Ai) is introduced would be indicated. Formally, Model 2:
with k=1, 2. [2]
Notice that alternative Model 2 specifications have been tested. For instance, we explored the possibility that the length of residence could actually conceal some generational effects. Distinction of the length of residence for people who migrated before and after 1970 was considered and no
generational effects was revealed.7
Finally, Model 3 would determine whether the effect of the length of residence on social capital varies by country (H2.1). To test this assumption, we have created interaction terms between coefficients associated to the 14 country dummies and the one associated with age at migration. The third model is simply estimated from the following expression:
with k=1, 2. [3]
Notice that the standard specification of equation [3] would supplement the interaction term Aij dj
with both of its components Aij and dj in order to isolate the peculiar effect of each term. Notice that
Ni plays the same role Aij, would play in model [3] since both variables have by construction the same
variance. However, the small sample size prevent us from such an approach since the high number of country dummies would capture most of the inter-country variance. As a stopgap solution, we propose to specify a country-clustered type of variance-covariance estimator that would produce robust standard-errors in the case of such a misspecification. This robust estimator allows for intragroup correlation, relaxing the usual requirement that the observations be independent. In other words, the observations are independent across countries but not necessarily within countries.
7 All models specification and statistical programs (.do) available upon request.
ki 13 1 j ij k k i i k * ki α N Xβ γ d ε y = + + + =
∑
ki 13 1 j ij k k i i k i k * ki α N μ A Xβ γ d ε y = + + + + =∑
(
)
i k ki 13 1 j ij j kj i k * ki α N μ d A Xβ ε y = + × + + =∑
11 4.3. Country level regressions
Estimations from Model 3 will be used to explain differences across countries in immigrant speed of social integration. In order to explain these differences, we will use the coefficients associated to the interaction terms as a new dependant variable that will be regressed on a set of country institutional variables. In this last step, we test for the impact of the economic and social context (measured by the growth of GDP and GINI coefficient of income inequality) and the impact of the resources devoted to welfare programs (measured by social expenditure as a percentage of GDP) on countries performance in “speed of integration” (H2.2.). Formally:
with k=1, 2. [4]
where μ1j and μ2j are the vectors of the coefficients previously estimated in Model 3. They represent
cross-country disparities in “speed of social integration” (i.e. the correlation between social capital variables and immigrants’ length of residence). Our concept of “speed of social integration” attempts to highlight differences between countries in the necessary length of stay to achieve social integration of immigrant through social participation and interpersonal trust. Model 4 analyses the
respective influence of each institutional variable (Zj) at a time to explain these differences. For each
country, five Zj specifications are retained: the 2005 growth in GDP, the 2005 value of the GINI
coefficient, the 2005 corruption perception index, the fractionalisation index (for language, ethnicity and religion respectively) and finally the 2005 social expenditure as a percentage of GDP. Notice that
equations for μ1j and μ2j in Model 4 are not estimated simultaneously. Since μ1j and μ2j are linear,
coefficients a1, b1 and a2, b2 in Model 4 are simply estimated using Ordinary Least Squares.
5. Results
5.1. Individual level model estimates concur with findings in previous studies
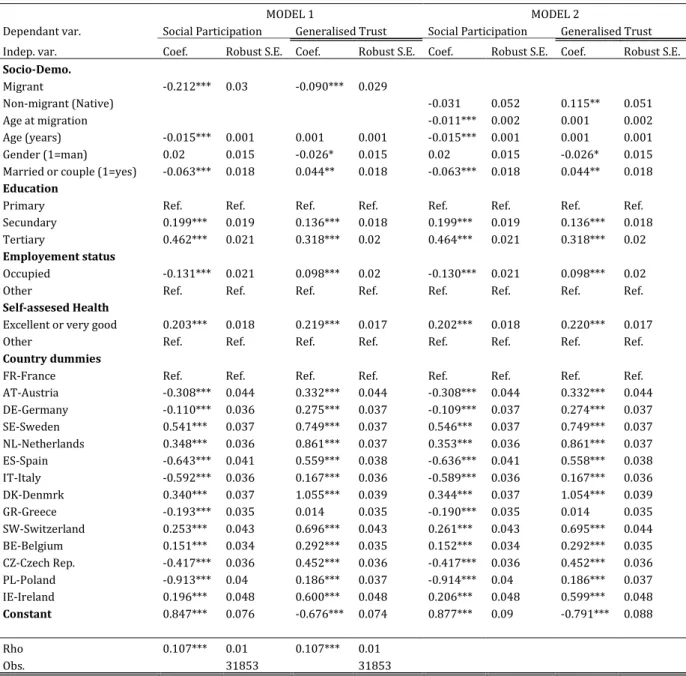
Table 2 displays the results for Models 1 to 3. Notice that the correlation coefficient (ρ) is significantly different from zero at 1% level, which confirms the need to estimate simultaneously both equations. Estimations of baseline Model 1 concur with previous empirical studies on the individual determinants of social participation and interpersonal trust. The coefficients are significant – apart from gender – and they display the expected coefficients. Notice that results from Model 2 and Model 3 are similar to Model 1 with regards to the effect of age, gender, educational level, marital status, market labour status and self assessed health status.
– Insert Table 2 about Here –
As expected in the case of the social participation equations, age is a decreasing factor while higher educational level is one of the most important drivers of social participation. Excellent/very good self-assessed health status also improves the likelihood to get involved in social activities. However, being married/living as a couple is a decreasing factor of social participation, just like being in employment. One reason could be the individual time constraints reduce the leisure time that social participation requires. Country dummies corroborate the existence of a north-south gradient in participation in social activities that already appeared in descriptive statistics.
In the case of the equations for generalised trust, age does not appear to have any significant influence on the probability to report high level of trust. Notice that there is a significant gender difference in favour of women with regards to generalised trust. A high level of education, being married, and being in employment, also increases the probability to report a high level of trust. Reporting excellent/very good self assessed health status is associated with a higher likelihood to
k j k k kj a b Z e μ = + +
12 trust other people. Finally, coefficients associated with country dummies indicate that living in France greatly decreases the probability to trust other people. Previous researches having established a similar result have argued that the shortage of trust in France may result from extensive corporatism and State control (Cahuc & Algan, 2007).
5.2. Differences in migrants’ social capital are associated with the length of residence
In line with previous studies (Aleksynska, 2011), Model 1 estimates (Table 2) suggest that, even when socio-economic characteristics have been accounted, migrants still have a lower level of social capital. The immigrant population in Europe seems to be less able, or less willing to take part in social activities than the native-born population – maybe because of a lack of information about the country institutions, a less sizeable social network or cultural barriers – and migrants do have lower levels of generalised trust, as the descriptive statistics corroborated above.
Model 2 provides further insights about the influence of the migratory status8. We suspect a
different influence of migration on social integration according to the length of residence in the host country. The equation for social participation confirms our intuition: people having migrated at older ages present a lower likelihood to get involved in social activities. As predicted by the assimilation process, the longer is the length of residence in the host country, the higher is the probability for immigrant to get involve in social activity. Notice that once age at migration is introduced into the analysis, the migratory status does not appear to have a significant influence on the probability to take part in a social activity, meaning that migration has an influence on social participation but only through the length of residence in the host country.
Looking at Model 2 equation for generalised trust, age at migration does not seem to be significantly associated with the probability to report higher levels of trust. Therefore, we do not confirm a different influence of migration on trust according to the immigrant length of residence in the host country. The migratory status remains significantly associated with interpersonal trust so that the native-born population presents a higher probability to trust other people, but this difference is not due to the length of residence and should therefore be investigated elsewhere. Nevertheless, in this later perspective, it may be that some country specific effects are competing so that the overall coefficient for the pool of European countries may be nil. It is the purpose of Model 3 to explore this issue.
– Insert Figures 2.1 & 2.2 about Here –
With the aim to analyse more specifically the effect of length of residence in each country, we inserted interaction terms between age at migration and country dummies in Model 3 to explore differences in immigrant social integration through European countries. Figure 2.1 and 2.2 display the associated coefficients of Table 2 (model 3) with the 95% confidence intervals. Estimates from the social participation and the generalised trust equations confirm – all other things being equal – that there are cross-countries differences in the speed of social integration: Scandinavian countries (Sweden and Denmark) have high rates of speed of social integration, while most Mediterranean countries (Spain and Greece) have the lowest rates.
8 We introduced the citizenship criterion in the second model to check whether it has a significant influence on social integration alongside age at migration. The result confirms our hypothesis since this migration-related indicator is not any more significant with social participation and generalised trust when age at migration is considered, maybe because both variables are highly correlated. Results are not reported here; but available upon request.
13 5. 3. “Speed of integration” is higher in “fair societies”
In the second step of our research, we aim to determine whether or not some institutional determinants explain cross country differences in speed of social integration. The coefficients of
crossed effects estimated in the Model 3 (μ1j and μ2j) are used as new dependant variables to be
regressed on cross-country macroeconomic series. Institutional variables are introduced one at a time in both social participation and trust equations to isolate the respective influence of these macroeconomic factors. Notice that these results are necessarily explanatory since the small number of countries in the analysis does not provide extensive statistical power.
– Insert Table 3 about Here –
Results displayed in Table 3, show that neither GDP per capita, nor the level of social expenditure (as % of GDP), nor any of the fractionalisation indexes seem to explain differences in speed of social integration across countries – whether through social participation or through generalised trust. With regard to the latter dimension, one may notice that the concept of interpersonal trust is largely disputed. Although no difference in the interpretation of the generalized trust construct is to be found between natives and immigrants (Dinensen, 2011), Laurent (2009) warns that it suffers from a lack of international reliability. Some researchers (Alesina & La Ferrara, 2000), have even guarded about interpretations that result from the analysis of interpersonal trust in an international comparison.
– Insert Figures 3.1 and 3.2 about Here –
Nevertheless, in the case of social participation, estimates for the GINI coefficient and the corruption index are both negative and significant. Figures 3.1 and 3.2 show that both models nicely fit the data, despite the scarce number of observations. The negative slope indicates a decreasing relationship between crossed effects and both macroeconomic indicators. Accordingly, immigrants in more egalitarian countries have a higher propensity to get involved in social activity when one immigrates at older ages. Put differently, results indicate that the necessary length of stay to achieve immigrant social integration through social participation would be lower in more egalitarian countries. Similarly, immigrants residing in more corrupted country have a lower propensity to get involved in social activity when one immigrates at older age. This latter result also suggests that immigrant social integration through social participation would be more likely to be achieved in countries where perceived corruption is lower.
In this respect, income inequality and state level perceived corruption appear to exert a deleterious effect on immigrants’ speed of social integration in the host country. One interpretation could be that unequal environments increase relative deprivation of immigrant, reduce their wish or their opportunity to take part in society. In line with Rawls (1971) theory of justice, in a fair society each person should benefit from equal basic rights and liberties so that each person has the same right, freedom and capacity to access services and resources (see also Sen, 2000). Societies characterised by low level of income inequalities or low level of perceived corruption may thus be considered as “fair society” in providing a suitable environment to foster immigrant social integration.
5.4. Robustness checks
With the aim to gain confidence from the results, different specifications for model [3] have been tested –though restricted to the social participation equation only. We modified the population of interest to check whether the influence of macroeconomic variables remains significant in considering different sub-populations: (i) men versus women, and (ii) citizen versus non-citizen.
14 – Insert Table 4 about Here –
Table 4 indicates that the influence of the GINI coefficient and the perceived corruption index remain significant in the social participation equation only in the sub-samples of women and citizens. Additional results for other macroeconomic variables concur with previous results since no effect of GDP, social expenditures, and any of the fractionalisation indexes are found to be significant. Notice that non-significant results in the case for men and non-citizens may be due to the lack of statistical power. Nevertheless, the opportunity to interpret more in the details the above results should be taken with great care; the interpretation below are just given as to illustrate of possible future research paths.
In the case of social participation, (i) women’s speed of integration is more influenced by a change in income inequality (coeff. = -0.244) than the total population of migrants (coeff. = -0.190); and (ii) citizen’s speed of integration is less influenced by a change in income inequality (coeff. = -0.166) than the total population of migrants (coeff. = -0.190). Put differently, for a given level of income inequality, the speed of social integration in a country will therefore be higher for migrant who benefit from the citizenship of the host country, suggesting that citizenship is a substitute for reduction in income inequality. The same reasoning applies to results for the perceived corruption index that remains significant with the expected sign in the case of women and citizen subsamples. A decrease in the level of the perceived corruption index would lead to higher speed of social integration for women (coeff. = -0.052) and citizen (coeff. = -0.046) than for the total population of migrants (coeff. = -0.040), meaning that state level of corruption exerts a more deleterious effect on women and citizen immigrant.
6. Conclusion
This paper provides new empirical evidence on the relationship between migration and social integration. It explores the hypothesis that migrants essentially differ from non-migrants with regard to the length of residence in the country. This time difference is argued to be a proxy of migrants’ social distance to natives. In order to capture the important time-depth dimension that is required here, the study makes use of data from the wave 2 of SHARE (2006-07) on individuals aged 50 or more in 14 European countries. Focus on older people helps investigate the influence of respondents’ migratory status and their age at migration on two aspects of social integration: participation social activities and high levels of generalised trust.
Although age at migration does not seem to have any significant influence on generalised trust, social participation increases with migrants’ length of stay in the host country, suggesting that migrant’s social behaviour becomes over time similar to that of natives. In other words, social integration of immigrant in Europe generally takes time to be effective. The analysis based on crossed effect between age at migration and country dummy reveals some differences in the “speed of social integration” across European countries that follow a North-South gradient. Scandinavian countries seem more able to incorporate rapidly migrants; while Mediterranean countries seem to perform much worse. Institutional determinants were further considered in the analysis in order to investigate these cross-country differences in the “speed of social integration”. It appears that the social integration of migrants is much faster in “fair” countries with lower levels of income inequality and lower levels of corruption.
From a public policy perspective, our results suggest that mainstreaming migrants’ social integration could be more difficult to achieve in countries with higher levels of income inequality and corruption. For a given level of migratory influx, countries’ ability to social absorption is more important as the
15 level of income inequality and corruption is low. May this result be confirmed in further research, it would suggest that some of the potential negative externalities of migration – due to some social distance between migrants and natives – are more likely to be downsized (i.e. compensated or internalised) as societies grow more equal and more free.
References
Akerlof G.A. (1997). Social Distance and Social Decisions. Econometrica, 65(5): 1005-1028.
Aleksynska M. (2011), “Civic participation of immigrants in Europe: assimilation, origin, and destination country effects”, European Journal of Political Economy, 27(3), pp. 566–585.
Alesina A., Devleeschauwer A., Easterly W., Kurlat S., Wacziarg R. (2003), “Fractionalization”, Journal of Economic Growth, 8, pp. 155-194.
Alesina A., La Ferrara E. (2000), “Participation in heterogeneous Communities”, The Quaterly Journal of Economics, 115(3), pp. 847-904.
Algan Y & Cahuc P. (2007). La société de défiance: Comment le modèle social français s’autodétruit. Éditions Rue d’Ulm/Presses de l’École normale supérieure, Paris (France). Collection du CEPREMAP.
Aslund O., Bohlmark A., Nordstrom Skans O. (2009), “Age at migration and social integration” , IZA discussion paper n°4263
Börsch-Supan A. & Jürges H. (2005) Eds. The Survey of Health, Aging, and Retirement in Europe-Methodology. Manheim Research Institute for the Economics of Ageing (Germany)
Bosswick W. & Heckmann F. (2006). Integration of migrants: Contribution of local and regional authorities. CLIP Network Report, European Foundation for the Improvement of Living and Working Conditions, Dublin, Ireland.
Breton R. (2003), “Social Capital and the Civic Participation of Immigrants and Members of Ethno-Cultural Groups”, Paper presented at the conference on: the opportunities and challenges of diversity: A role for social capital?, Montreal November 2003.
D’Hombres B., Rocco L., Suhrcke M., McKee M. (2010), “Does social capital determine health : Evidence from eight transition countries”, Health Economics, 19(1), pp. 56-77
De Palo D., Faini R., Venturini A. (2007), “The Social Assimilation of Immigrants”, SP discussion paper n°0101 – The World Bank.
Dinesen P.T. (2011), “A Note on the Measurement of Generalized Trust of Immigrants and Natives”, Social Indicators Research, 103(1), pp. 169-177.
Durlauf, Steven N. 1996. “A Theory of Persistent Income Inequality.” Journal of Economic Growth 1:75-93. Eurofound (2010). "Volunteering - A force for change". European Foundation for the Improvement of Living and
Working Conditions.
Eurofound (2011). Is volunteering for everyone? Eurofound resource pack fact sheet, Volunteering – a force for change. European Foundation for the Improvement of Living and Working Conditions, Dublin, Ireland. European Commission (2003), Migration and Social Integration of migrants, Valorisation of research on
migration and immigration funded under 4th and 5th European Framework Programmes of Research. EUR 20641.
European Commission (2005). A Common Agenda for Integration: Framework for the Integration of Third-Country Nationals in the European Union. COM(2005) 389.
European Commission (2009). Poverty and social exclusion, Special Eurobarometer 321, Brussels. European CommissionEurobarometer (2010). Standard Eurobarometer No 73, Spring 2010, Brussels. Eurosta 2008, http://epp.eurostat.ec.europa.eu/cache/ITY_OFFPUB/KS-SF-08-098/EN/KS-SF-08-098-EN.PDF Fidrmuc J., Gerxhani K. (2005), “Formation of social capital in Central and Eastern Europe : Understanding the
gap vis à vis developed countries”, CEPR Discussion Papers, n°5068 GHK (2010) Volunteering in the European Union. Final Report, Brussels.
Grootaert C. & Van Bastelaer T. (2002). The Role of Social Capital in Development. Cambridge: Cambridge University Press.
Hank K. & Erlinghagen M. (2010). Volunteering in “old” Europe. Patterns, potentials, limitations. Journal of Applied Gerontolgy, 29(1): 3-20.
Kazemipur A., (2004), “Social Capital of immigrants in Canada”, PCERII working paper series n°04-04
Kervin K.C., Kline P. (2002), “Relational costs and the production of social capital : evidence from carpooling”, NBER working paper, n° 9041
16 Knack S. (2002), “Social Capital and the quality of government: Evidence from the states”, American Journal of
Political Science, vol 46, n°4, pp. 772-785
Knack S., Zak P.J. (2001), “Building trust: public policy, interpersonal trust and economic development”, MPRA working paper, n°25055.
Kumlin S., Rosthein B. (2005), “Making and Breaking Social Capital: The impact of welfare State Institutions”, Comparatives political studies, vol 38, n°4, pp. 339-365
Lelkes O. (2010). Social participation and social isolation. Eurostat Methodologies and Working Papers, EU, Luxembourg: Publications Office of the European Union.
Muller N., Seligson M.A.(1994), “Civic culture and Democracy: the question of causal relationship”, The American Political Science Review, vol 88, n°3, pp. 635-652.
Naegele G. & Schnabel E. (2010). Measures for social inclusion of the elderly: The case of volunteering. Eurofound Working Paper. European Foundation for the Improvement of Living and Working Conditions, Dublin, Ireland.
OCDE (2011), La naturalisation: un passeport pour une meilleure intégration des immigrés ?, Éditions OCDE. http://dx.doi.org/10.1787/9789264099623-fr
OECD (2010), International Migration Outlook 2010, OECD code: 812010101P1
OJ - Official Journal of the European Union (2010). "COUNCIL DECISION of 27 November 2009 on the European Year of Voluntary Activities Promoting Active Citizenship (2011)", 22.1.2010: L17/43-49.
Oorschot .W.V, Arts W., 2005, “The social capital of European welfare states: the crowding out hypothesis revisited”, Journal of European Social policy, vol 15(1), pp. 05-26.
Oorshot W.V. (2003), “Different welfare states; different social commitments? Evidence from the 1999/2000 European Value Study”, Paper presented at 1st Annual Conference of ESPAnet, the network for European Social Policy Analysis, Copenhagen
Paxton P. (2002), « Social Capital and democracy : An interdependent relationship », American Sociological Review , vol 67, n°2, pp. 254-277
Rawls, J., (1971), Theory of justice, Harvard University Press, Cambridge, MA
Rosthein B., Stolle D. (2003), “Social capital, impartiality and the welfare state: an Institutional approach” in M. Hooghe and D. Stolle (eds), Generating Social Capital: civil society and institutions in comparative perspective”, pp. 191-209, New York: Palgrave/Macmillan
Rosthein B., Stolle D., “How Political Institution creates and destroys social capital: an institutional theory of generalized trust”, Paper prepared for the 98th meeting of the American Political Science Association in Boston, Ma. 2002
Rosthein B., Uslaner E.M. (1999), “All for all: Equality and social trust”, Center for European Studies, Working Paper Series, n°117.
Ruspasingha A., Goetz S., Freshwater D.(2006), “The production of social capital in US counties”, The journal of socio-economics, n°35, pp. 83-101
Salamon L.M., Sokolowski W. (2003), “Institutional roots of volunteering, toward a macro-structural theory of individual voluntary action”, in P. Dekker and L. Halman (eds), The values of volunteering: cross cultural perspectives, pp. 71-90. New York: Kluwer Publishers,
Sarah Vanessa Losego et Lutz Raphael « Pratiques de naturalisation », Annales. Histoire, Sciences Sociales 1/2006 (61e année), p. 135-162.
Scheepers P., Grotenhuis M.T., Gelissen J . (2002), “Welfare states and dimensions of social capital, Cross-national comparisons of social contacts in European countries”, European Societies, 4(2), pp. 185-207. Schnapper D., 2008, “Intégration nationale et intégration des migrants : un enjeu Européen”, Fondation Robert
Schuman, Question d’Europe n°90.
Sen A., 2000, « Social justice and the distribution of income », Chapter 1, Handbook of Income Distribution, Volume 1. Edited by A. B. Atkinson and E Bourguignon.
Sides J. (1999), “It takes two: The reciprocal relationship between social capital and democracy”, Departement of Political Science, University of California, Berkeley, Working Paper 99-11
Van der Vegt G.S. (2002). Effects of attitude dissimilarity and time on social integration: A longitudinal panel study. Journal of Occupational and Organizational Psychology, 75(4): 439–452.
Whiteley P.F. (2001). “Economic Growth and Social Capital”, Political Studies, 48(3):443-466.
Woolcock M. (1998), “Social capital and Economic development: toward a theoretical Synthesis and Policy Framework”, Theory & Society, 27:151-208.
17
TABLES
Table 1: Description of the Sample
Country N. Obs. Share of migrants Age at migration Raw Weighetd OECD data Average Median
Austria 1 270 0.075 0.072 0.150 18.3 19 Germany 2 405 0.164 0.163 0.128 21.7 18 Sweden 2 568 0.089 0.095 0.134 24.4 23 Netherlands 2 465 0.053 0.058 0.107 25.0 23 Spain 2 038 0.026 0.028 0.135 36.4 44 Italy 2 853 0.012 0.011 0.039 23.7 25 France 2 580 0.145 0.132 0.113 20.5 21 Denmark 2 409 0.033 0.034 0.069 23.3 24 Greece 2 901 0.022 0.020 0.103 21.9 24 Switzerland 1 381 0.157 0.154 0.249 24.5 23 Belgium 2 961 0.071 0.075 0.130 20.8 21 Czechia 2 630 0.044 0.043 0.062 15.8 16 Poland 2 340 0.026 0.023 0.020 9.0 6 Ireland 1 051 0.069 0.069 0.157 31.1 31 Total 31 852 0.067 0.081 0.114 22.1 21
Source: SHARE wave2 (release 2.3.0) and OECD (2010).
Note: Figures presenting national statistics are taken from OECD (2010); data cover the year 2007 for most countries, while data for Poland are only available for 2001, and 2002 for Italy and Greece.
18
Table 2: Individual Determinants of Social Capital
MODEL 1 MODEL 2
Dependant var. Social Participation Generalised Trust Social Participation Generalised Trust Indep. var. Coef. Robust S.E. Coef. Robust S.E. Coef. Robust S.E. Coef. Robust S.E.
Socio-Demo. Migrant -0.212*** 0.03 -0.090*** 0.029 Non-migrant (Native) -0.031 0.052 0.115** 0.051 Age at migration -0.011*** 0.002 0.001 0.002 Age (years) -0.015*** 0.001 0.001 0.001 -0.015*** 0.001 0.001 0.001 Gender (1=man) 0.02 0.015 -0.026* 0.015 0.02 0.015 -0.026* 0.015 Married or couple (1=yes) -0.063*** 0.018 0.044** 0.018 -0.063*** 0.018 0.044** 0.018
Education
Primary Ref. Ref. Ref. Ref. Ref. Ref. Ref. Ref. Secundary 0.199*** 0.019 0.136*** 0.018 0.199*** 0.019 0.136*** 0.018 Tertiary 0.462*** 0.021 0.318*** 0.02 0.464*** 0.021 0.318*** 0.02
Employement status
Occupied -0.131*** 0.021 0.098*** 0.02 -0.130*** 0.021 0.098*** 0.02 Other Ref. Ref. Ref. Ref. Ref. Ref. Ref. Ref.
Self-assesed Health
Excellent or very good 0.203*** 0.018 0.219*** 0.017 0.202*** 0.018 0.220*** 0.017 Other Ref. Ref. Ref. Ref. Ref. Ref. Ref. Ref.
Country dummies
FR-France Ref. Ref. Ref. Ref. Ref. Ref. Ref. Ref. AT-Austria -0.308*** 0.044 0.332*** 0.044 -0.308*** 0.044 0.332*** 0.044 DE-Germany -0.110*** 0.036 0.275*** 0.037 -0.109*** 0.037 0.274*** 0.037 SE-Sweden 0.541*** 0.037 0.749*** 0.037 0.546*** 0.037 0.749*** 0.037 NL-Netherlands 0.348*** 0.036 0.861*** 0.037 0.353*** 0.036 0.861*** 0.037 ES-Spain -0.643*** 0.041 0.559*** 0.038 -0.636*** 0.041 0.558*** 0.038 IT-Italy -0.592*** 0.036 0.167*** 0.036 -0.589*** 0.036 0.167*** 0.036 DK-Denmrk 0.340*** 0.037 1.055*** 0.039 0.344*** 0.037 1.054*** 0.039 GR-Greece -0.193*** 0.035 0.014 0.035 -0.190*** 0.035 0.014 0.035 SW-Switzerland 0.253*** 0.043 0.696*** 0.043 0.261*** 0.043 0.695*** 0.044 BE-Belgium 0.151*** 0.034 0.292*** 0.035 0.152*** 0.034 0.292*** 0.035 CZ-Czech Rep. -0.417*** 0.036 0.452*** 0.036 -0.417*** 0.036 0.452*** 0.036 PL-Poland -0.913*** 0.04 0.186*** 0.037 -0.914*** 0.04 0.186*** 0.037 IE-Ireland 0.196*** 0.048 0.600*** 0.048 0.206*** 0.048 0.599*** 0.048 Constant 0.847*** 0.076 -0.676*** 0.074 0.877*** 0.09 -0.791*** 0.088 Rho 0.107*** 0.01 0.107*** 0.01 Obs. 31853 31853
19
Table 2 (cont'd): Individual Determinants of Social Capital
MODEL 3
Dependant var. Social Participation Generalised Trust
Indep. var. Coef. Robust S.E. Coef. Robust S.E.
Socio-Demo.
Age (years) -0.008** 0.004 0.004** 0.002
Gender (1=man) -0.002 0.046 -0.037 0.023
Married or couple (1=yes) -0.055 0.039 0.056* 0.031
Education
Primary Ref. Ref. Ref. Ref.
Secundary 0.237*** 0.086 0.148** 0.066
Tertiary 0.592*** 0.085 0.375*** 0.069
Employement status
Occupied 0.003 0.076 0.168*** 0.055
Other Ref. Ref. Ref. Ref.
Self-assesed Health
Excellent or very good 0.351*** 0.063 0.296*** 0.063
Other Ref. Ref. Ref. Ref.
Migration
Non-migrant (Native) -0.007 0.104 0.269*** 0.104
Interaction terms
Age at migration X FR-France Ref. Ref. Ref. Ref. Age at migration X AT-Austria -0.015*** 0.002 0.004 0.004 Age at migration X DE-Germany -0.011*** 0.002 0.004 0.003 Age at migration X SE-Sweden 0.014*** 0.002 0.016*** 0.004 Age at migration X NL-Netherlands -0.003* 0.002 0.017*** 0.003 Age at migration X ES-Spain -0.024*** 0.002 -0.002 0.003 Age at migration X IT-Italy -0.010*** 0.002 0.013*** 0.003 Age at migration X DK-Denmrk 0.001 0.002 0.013*** 0.004 Age at migration X GR-Greece -0.027*** 0.002 -0.002 0.004 Age at migration X SW-Switzerland -0.001 0.002 0.009** 0.004 Age at migration X BE-Belgium -0.002 0.002 0.003 0.004 Age at migration X CZ-Czech Rep. -0.014*** 0.003 0.020*** 0.005 Age at migration X PL-Poland -0.025*** 0.005 0.032*** 0.007 Age at migration X IE-Ireland -0.002 0.002 0.011*** 0.003
Constant 0.183 0.255 -0.791*** 0.17
Rho 0.160*** 0.03
Obs. 31852