Impact of Dosing Intervals on Activity' of Gentamicin and Ticarcillin Against
Pseudomonas aeruginosa
in Granulocytopenic Mice
A. U. Gerber, W. A. Craig, H.-P. Brugger, C. Feller, A. P. Vastola, andJ. Brandel
From the Department of Medicine, William S. Middleton Memorial V.A. Hospital and University of Wisconsin, Madison, Wisconsin; and the Department of Medicine and Institute of Medical Microbiology, University of Bern, Bern, Switzerland
The influence of dosing intervals on the activity of gentamicin and ticarcillin against
Pseudomonas aeruginosa was studied in vivo. Granulocytopenic mice infected with P.aeruginosain the thigh muscle were treated with l-hr or 3-hr injections of gentamicin, ticarcillin, or gentamicin-ticarcillin. Plasma pharmacokinetics of the drugs were corre-lated with antibacterial activity. Gentamicin injected every 1 hr tended to be less active than gentamicin injected at longer intervals. In contrast, ticarcillin given every 1 hr was significantly more efficacious than equivalent total doses injected every 3 hr. The dos-ing schedule of gentamicin-ticarcillin was again important for ticarcillin but did not ap-preciably affect the antibacterial activity of gentamicin. Thus, antimicrobial chemo-therapy ofP. aeruginosainfections in the granulocytopenic host might be improved by administering ticarcillin rather than gentamicin as a constant infusion.
The optimal antibiotic treatment of gram-negative bacterial infections in granulocytopenic patients remains an unsolved clinical problem, particularly for infections due to Pseudomonas aeruginosa, al-though progress has been made by combining antipseudomonal drugs and by using doses ap-proaching toxic levels. Additional progress could possibly be made by finding optimal dosing schedules for these drugs. This aspect of anti-microbial chemotherapy has hardly been investi-gated. In some recent clinical trials aminoglyco-side antibiotics were administered as constant infusions [1-3]. Although it was concluded that such infusions might be more effective than inter-mittent dosing, the results supporting this conclu-sion were not significant. In vitro, no superiority could be demonstrated for constant infusions vs,
intermittent doses of gentamicin against P.
aeru-Received for publication September 7, 1982, and in revised form December 28, 1982.
Parts of this study were presented at the 54th Annual Meet-ing of the Central Society for Clinical Research, held in Chica-go, Illinois, on November 5-7, 1981, and at the Second Inter-national Symposium of Infections in the Immunocompromised Host, held in Stirling, Scotland, on June 20-24, 1982.
This work was supported by funds from the Swiss and Ber-nese League Against Cancer, the Veterans Administration, Beecham AG, and Essex AG.
Please address requests for reprints to Dr. A. U. Gerber at his present address: University Clinic of Internal Medicine, In-selspital, 3010 Bern, Switzerland.
910
ginosa [4]. An early experimental approach to the importance of dosing schedules in an experi-mental model in vivo [5] has never been further explored nor has it been expanded to the immuno-compromised host.
In the present study an attempt was made to elucidate the impact of dosing intervals on the ac-tivity of gentamicin and ticarcillin against P. aeru-ginosa in granulocytopenic mice. For each drug alone and in combination the antibacterial effect of identical total amounts of drug given by two different dosing schedules was quantitated and compared: a 3-hr schedule, which during dosage intervals allowed plasma drug levels to fall below the MIC for the target organism, and a l-hr regi-men, which did not.
Materials and Methods
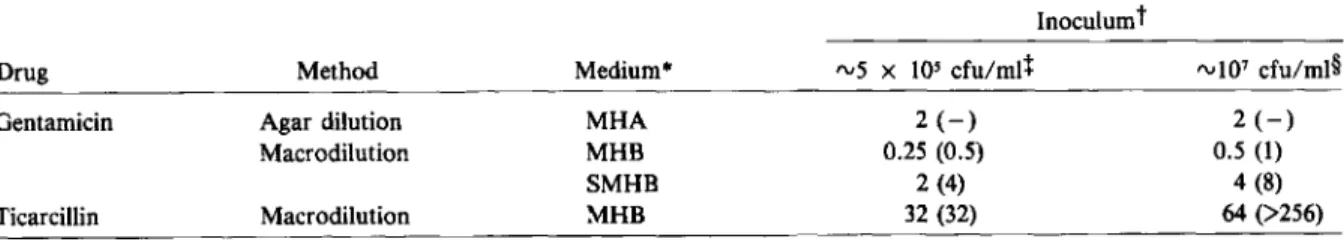
Organisms. P. aeruginosastrain ATCC 27853 (American Type Culture Collection, Rockville, Md.) was the main study organism. A previously well-studied clinical isolate (14974) [4, 6, 7] and two recent clinical isolates (A 10 and E 29/2), all from the Institute of Medical Microbiology (Bern, Switzerland), were included in confirmatory ex-periments. All organisms studied were susceptible to gentamicin and ticarcillin by the method of Bauer et al. [8]. MICs and MBCs for the main study organism as determined with various meth-ods and media are shown in table 1.
Dosing Interval and Antimicrobial Effect 911
Table 1. MICs (J,lg/ml) and MBCs (J,lg/ml) of gentamicin and ticarcillin forPseudomonas aeruginosastrain ATCC
27853, as determined using various techniques, media, and bacterial inocula.
Inoculum!
Drug Method Medium" "'5 x 10⁵ cfu/mtl rv107cfu/ml§
Gentamicin Agar dilution MHA 2(-) 2(-)
Macrodilution MHB 0.25 (0.5) 0.5(1)
SMHB 2 (4) 4 (8)
Ticarcillin Macrodilution MHB 32 (32) 64 (>256)
• MHA =Mueller-Hinton agar; MHB =Mueller-Hinton broth; SMHB ::: MHB supplemented with50 mg of Ca" and 20 mg of Mg't/liter. Corresponding media were used to dilute the drug as well as the inoculum.
t MIC (MBC, defined as~3 - log reduction of cfu by 24 hr).
+
By agar dilution method 5 x 10³cfu per spot.§ By agar dilution method 5 x 10⁵cfu per spot.
Media. Hinton broth and Mueller-Hinton agar (BBL Microbiology Systems, Cockeys-ville, Md.) used for preliminary in vitro studies were supplemented with Ca" and Mg" according to the procedure of Stratton and Reller [9]. MICs and MBCs were determined in Mueller-Hinton broth and supplemented Mueller-Hinton broth according to standard methods [l0].
Drugs. Gentamicin and ticarcillin used for in vitro MIC determinations were powders obtained from Schering Corp. (Kenilworth, N.J.) and Beecham Laboratories (Bristol, Tenn.), respec-tively. Drugs used for in vivo studies were com-mercial products: cyclophosphamide (Mead John-son Pharmaceuticals, Evansville, Ind.), genta-micin (Schering), and ticarcillin (Beecham).
Mice. Female ICR mice weighing 26-30 g each were obtained from Harlan Sprague Dawley (Madison, Wis.) and Tierzucht der Universitat Tierspital (Zurich).
Production and confirmation of granulocyto-penia. Granulocytopenia was produced by two ip injections of cyclophosphamide, 150 and 100 tJg/g at four days and one day, respectively, before the mice were infected with P. aeruginosa. Leuko-penia was confirmed in six to 10 animals in each experiment on day 4 or 5 after the first injection of cyclophosphamide. Blood (20 J.L1) was drawn from the retroorbital sinus into Unopettes'" capil-lary pipettes (BBL), and leukocytes were counted with a Coulter counter (Coulter Electronics, Hia-leah, Fla.). In addition, blood smears were checked for the presence of granulocytes in some but not all experiments.
Drug kinetics. Concentrations of antibiotics were determined in three to six animals per
sam-pling point. With the animal under slight ether anesthesia, blood was drawn from the retroorbital sinus into heparinized micro-hematocrit tubes (Clay Adams, Parsippany, N.Y.). Plasma drug levels were determined in a biologic assay [11] using Bacillus subtilis strain ATCC 6633 (Difco Laboratories, Detroit) as the indicator organism. Bacterial inocula and injection of mice. Broth cultures of the study organisms were grown to an OD of 0.3 (measured at 580 nm), washed in ice-cold 0.9070 NaCI, and adjusted to an OD of 0.3 in 0.9070 NaCl. Of this suspension, 0.1 ml (corre-sponding to rvl07 cfu) was injected into the thigh of a slightly ether-anesthetized granulocytopenic mouse on day 4 of the experiment (that is, four days after the first injection of cyclophospha-mide).
Quantitation of bacterial growth and killing. At various intervals after injection of the bacterial inoculum, three mice of each group were killed for study. The infected thigh was removed, immedi-ately homogenized in 4 ml of iced saline (8.5 g of NaCl/liter) supplemented with 50 mg of Ca'"/ liter, 20 mg of Mg'"/liter, and 0.1 ml of fJ-Iacta-mase (Whatman Biochemicals, Maidstone, Kent, England) with a Polytron'" tissue homogenizer (Kinematica, Lucerne, Switzerland), and plated in duplicate for cfu determinations.
Treatment of mice. Granulocytopenic mice were allotted to treatment groups, being treated essentially with either a l-hr or a 3-hr regimen. Experiments were devised such that identical cu-mulative doses of the study drug(s) resulted by the time the animals were killed for study. Animals were injected sc with 0.2 ml of appropriate dilu-tions of the drugs. Control mice were injected with
0.9010 NaCI. The range of doses studied was 10 ug/g per 1 hr to 1 mg/g per 3 hr and 0.833 J.tg/g per 1 hr to 22.5 J.tg/g per 3 hr for ticarcillin and gentamicin, respectively. In combination experi-ments, the two study drugs were injected simul-taneously at two different sites.
Evaluation of results and statistics. The direct comparison of results (the effect of identical cum-ulative doses of drug administered by different schedules) was based on experiments performed with the same bacterial inoculum on the same day injected into randomly selected granulocytopenic mice.
Calculations of the t Y2 values of gentamicin and ticarcillin were based on the assumption that the drug had been absorbed from the site of injection by 15 min after the injection. Analysis of regres-sion and analysis of covariance [12] were used to evaluate bacterial growtn curves and dose-response curves for the two study drugs. Wilcoxon's tank sum test for paired samples [12] was used for an-alyzing results compiled from various and re-peated experiments comparing the effect of differ-ent dosing schedules.
Results
Granulocytopenia in mice. Mice were severely granulocytopenic (absolute granulocyte count, <50/mm3
) by day 4 and remained so through day
5 after the first injection of cyclophosphamide.
Virtually no granulocytes were found on smears made from blood as well as from Pseudomonas-infected thighs of such mice.
Ticarcillin treatment. The plasma kinetics of ticarcillin were similar in infected and noninfected mice. Plasma levels after sc injection of various doses of ticarcillin are shown in figure 1, left. As-suming complete absorption of the drug by 15 min after sc injection of 1 mg/g, the t Y2 of ticarcillin was 15.6 min.
Figure 2 shows the kinetics of two dosing regi-mens of ticarcillin as well as the corresponding an-tipseudomonal effect in the same animals. Gran-ulocytopenic mice were injected in the thigh mus-cle withP.aeruginosastrain ATCC 27853. At 2 hr later, ticarcillin treatment was started with 30 J.tg/g every 3 hr in one group and with 10 J.tg/g every 1 hr in another group. Peak plasma levels after 30 J.tg/g came close to the MIC for the study organ-isms (16-32 ug/ml) but remained clearly below the MBC, as determined with an inoculum of 10' cfu/ml in vitro (>256 J.tg/ml). Doses every 1 hr of 10 J.tg/g resulted in plasma drug levels that re-mained below the MIC for the study organisms throughout the experiment. No significant accum-ulation of ticarcillin was observed. Neither of the two dosing regimens was bactericidal. Yet, bacte-rial growth was suppressed in animals treated every 1 hr for at least 12 hr. In contrast, doses every 3 hr of 30 J.tg/g were significantly less active, allowing for growth of the study organisms
0-0 90pg/g lJ<--t>45~g/g .... 22.5pg/g ... 7.5ug/g .... 2.5~g/g .... ....
J
_
0.5 128 64 32 § 0.25 0.125 0-01000~g/g ilr-tb.300pg/9. ... 75pg/g .... 30~g/g . . . lO~g/g 512 256 1024 I I! , 15 30 60 120Time afters.c. injection of ticarcillin ( min )
15
! I
60 120
Time afters.c. injection of gentamicin ( minI
Figure 1. Plasma kinetics of(left)ticarcillin and(right)gentamicin in mice after single sc injections of various doses. Each point represents the mean ± SDof duplicate determinations from three to(left) six or(right)four mice. Limit of detectability = (- - -);Pseudomonas aeruginosastrain NCTC 104941 used as indicator organism = (*).
Dosing Interval and Antimicrobial Effect 913 10 2000 450 1200 At 6 hr of treatment
I
At 12 hr of treatmentI
301) 900 2400 4000 CUlIlulative dose of ticarcillin injected (~g/g) -1-2
- 1
1
~o,g
Figure 3. Effect of variouscumulative dosesof
ticarcil-lin, injected at 1- or 3-hr intervals, in granulocytopenic mice infected withPseudomonas aeruginosa. Data are geometric mean ± SDvalues(n = 3) of log cfu(f) -log cfu (fo), wherefo is the time when treatment was started and t is the time after starting the treatment. Valuesfor dose-response curvesat 6 hr of treatment (for l-hr and 3-hr dosing, respectively) werer= -0.914 and -0.886, intercept = 1.57 and 2.7, and slope= -1.01 and - 1.06; at 12 hr of treatment, r
= -
0.897 and -0.965, intercept=
2.03 and 5.3, and slope=
-0.88 and - 1.67. Data from figure 1 = (*).2
sponse curves (xfor y = 0). At 6 hr of treatment the bactericidal threshold doses of the l-hr and the 3-hr schedule were 72 and 724 ug/g per 6 hr, re-spectively (with 0.95 confidence limits 21 ~ 72
~ 199 and 211~724~ 2,993 J.ig/g per 6 hr for l-hr and 3-hr dosing schedules, respectively). Corre-sponding bactericidal threshold doses at 12 hr of treatment were 51 ~ 207 ~ 703 and 776 ~ 1,473
~2,945 ug/g per 12 hr, respectively. Thus, l-hr in-jections were estimated to be about seven to 10 times more effective than 3-hr injections yielding identical cumulative doses of ticarcillin. No mode of dosing was more effective after 12 hr of therapy than after 6 hr. Moreover, a trend toward bacte-rial breakthrough growth was noted even in mice receiving high-dose treatment.
Confirmatory studies included three clinical
iso-,
12 Hoursf
30~g/gq3hr l 10~g/gq1hr I 6o
I I I I I I I ~ ~\
'\ 1\ \ \ etc. \ \ \\ r \ ' - \ , \ -, /\ i "I" ,
I
o
1 2 3 4 5 6 12 Hours 6 1 . . . - '_-..L...._----'-_-.L-_--l-_----'_----'_---' -2 c:: o .~10 s: ~ c:: 8 5 co !j; co c::: 0 ....' _----'---'----L.---I..--'----'---'-_--'-_---"_----' -2 0-0Control ( salineI ... 30\lglg q3 hr . . . 10~g/gq1hrdespite the intermittent higher blood levels of ticarcillin obtained.
Additional experiments in granulocytopenic mice were performed using doses of up to 1 mg of ticarcillin/g. Again, the activity of a 1-hr vs. a 3-hr dosage regimen was studied. The antibacterial ef-fect of ticarcillin proved (1)to be dose related, (2) to depend on the dosage interval, and (3) to fade in prolonged treatment. For both dosing regimens a significant correlation between the log of dose and the pharmacologic response was obtained (figure 3). In addition, a highly significant differ-ence in antipseudomonal efficacy was demon-strated between 1-hr and 3-hr dosing schedules of ticarcillin(P
<
0.01 by Wilcoxon's rank sum test). A bactericidal threshold dose, defined as the mini-mal cumulative dose of drug above which a reduc-tion in numbers of living bacteria from infected thighs was observed, was calculated fromdose-re-Figure 2. Kinetics of sub-MIC levels of ticarcillin and
the corresponding effect on Pseudomonas aeruginosa
strain ATCC 27853 in the same granulocytopenic mice.
Top,growth kinetics ofP. aeruginosain vivo. Each point represents the geometric mean ± SDnumber of cfu per thigh in three mice. The differences among the three growth curvesare significant(P<0.01).Bottom,plasma kinetics after repeated 3-hr and l-hr sc injections of ticar-cillin (30 and 10ug/g, respectively). Each point stands for the mean ± SDplasma level in three mice. Limit of detectability (1 I-tg/ml) = (- - -).
I
At 3 hr of treatmentI
1: 1: ~~..~ :::l..' :::l.. It> It> N ,..: 2.5 7.5 22.5 45 90 ~ 2 e en ... c en 0 E -1 -2 -3 10 30 90Cumulative dose of gentamicin injected (~g/g)
Figure 4. Effect of various cumulative doses of gen-tamicin, injected at 1-, 3-, 6-, or 12-hr intervals, in granulocytopenic mice infected with Pseudomonas aeruginosa. The MIC of gentamicin for the study organism was 2 J.lg/ml. E ,g-2
o
~-m::!3JI-o-'-!r--...- = - - - i -1 a:;-2 :> ~ ~-3L - - _ I I l I i I l i l l i i = I . - - - I _ - - - . . J , _ - - - I _...- - " '_ _---a:;o=_~ ~-t
resulting drug level had fallen below the MIC). Thereafter, regrowth of the surviving organisms occurred. This regrowth was relatively slow when compared with the growth rate of control organ-isms in saline-treated mice (data not shown). It is interesting that bacterial killing was observed only during the first 3 and 6 hr of treatment, even in those groups of mice that had been injected with gentamicin every 1 hr or 3 hr. Later on, no signifi-cant additional killing of the study organism oc-curred, although drug injections were continued. The antipseudomonal activity of identical cum-ulative doses of gentamicin at 3 and 6 hr of treat-ment (figure 4) was compared. A trend toward superiority of 3-hr over l-hr injections of gentami-cin was noted. This trend was corroborated in ad-ditional experiments using various inocula of
P. aeruginosastrain ATCC 27853 and treatment
with gentamicin at doses of 5, 7.5, and 15 JAg/g per 3 hr (data not shown). A small superiority of 3-hr lates of P. aeruginosa. Two of these strains
(strains E 29/2 and A 10) were highly virulent in mice and grew faster than strain ATCC 27853 in vitro and in vivo. They were susceptible to ticarcil-lin at an MIC of 32 ug/ml. In contrast, the third clinical isolate (strain 14974, from a child with cystic fibrosis) grew markedly slower in vitro and in granulocytopenic mice and was susceptible to ticarcillin at an MIC of 2 JAg/m!. In all confirma-tory experiments using these three strains, l-hr doses of ticarcillin were significantly more effica-cious than 3-hr doses. In fact, a 3-hr treatment regimen of ticarcillin using 90 JAg/g per 3 hr did not have a bactericidal effect on strain 14974, even though peak drug levels exceeded the MBC for this organism by at least 32-fold.
Gentamicin treatment. Plasma levels after
various doses of gentamicin are shown in figure 1, right. Assuming complete absorption of the drug by 15 min after sc injection of 90 JAg/g, a tY2 of 19 min was found. This tY2 tended to be even shorter after injections of lower doses of gentamicin. Ac-cumulation of the drug was occasionally observed in extremely sick mice by 12 hr of treatment. It is interesting that cfu counts per thigh in such mice did not differ from those in mice in which the drug had not accumulated.
Granulocytopenic mice infected withP.
aerugi-nosa were comparatively treated with various doses and dosage schedules of gentamicin. Figure 4 depicts results compiled with P. aeruginosa
strain ATCC 27853. At doses of gentamicin up to 2.5 JAg/g per 1 hr and 7.5 JAg/g per 3 hr, respec-tively, the efficacy of a l-hr and a 3-hr dosage schedule was comparable. Both regimens resulted in bacterial breakthrough growth, even when peak plasma levels, at least intermittently, exceeded the MIC for the study organism. Higher doses of gen-tamicin (90 JAg/g per 12 hr) were comparatively studied in four different groups of mice injected every 1 hr, every 3 hr, every 6 hr, or only once per 12-hr period of treatment. A similar partial bac-tericidal effect was obtained in all four groups of mice at 12 hr of treatment. By this time, the total amount of injected drug was equal in the four dos-age regimens studied (that is, cumulative doses of ticarcillin were identical). In contrast, the time course of the bactericidal effect was not the same in the four regimens. The 6-hr and the 12-hr treat-ment regimens were most efficacious at 3 hr after the first injection of gentamicin (by which time the
Dosing Interval and Antimicrobial Effect 915 At 3 hrof treatment
I
I
At 12 hr of treatmentI
T150+ G4 T450+ G15 +1 -1 -2 -3 E-1 ~ Discussion O~---...,...---=---t]-2
~-3 ~_~_~_"-_-1.-__
~ T75+ G2 T225+ G7.5 ~+1 SI
At 6 hroftreatmentI
t
0 -1 T300+G8 T 900+G30 Cumulative dose of ticarcillin ( Tland gentamicin ( Glinjected (~glglFigure 5. Effect of various cumulative doses of
ticarcil-lin (T) plus gentamicin (0) in granulocytopenic mice
in-fected with Pseudomonas aeruginosa. Left:T (75 IAg/g
every 3 hr) + 0 (0.67 ug/g every 1 hr); T (75 ug/g every
3 hr) + 0 (2 IAg/g every 3 hr); T (25 IAg/g every 1 hr)
+ 0 (0.67 IAg/g every 1 hr); or T (25 IAg/g every 1 hr)
+ 0 (2 IAg/g every 3 hr). Right:Three and 3.75 times
higher doses of T and 0, respectively.
for a sustained bactericidal effect of ticarcillin in particular. In confirmatory experiments using two clinical isolates(P. aeruginosa14974 and E 29/2), the dosing schedule again turned out to be of par-ticular importance for ticarcillin, whereas its im-pact on the activity of gentamicin was not statis-tically significant in ticarcillin-gentamicin com-binations.
Using an experimental thigh infection model in granulocytopenic mice, we demonstrated the im-pact of doses and dosing schedules on the time course of the pharmacologic response to two anti-pseudomonal drugs differing basically in their mechanism of action.
In comparison to humans, unusually high doses of ticarcillin and gentamicin were needed to obtain
-;;-2 ,§ ~ --3
1
~+1 01 E 0 over 1-hr treatment schedules was observed, whichproved to be reproducible and consistent when results were compiled from seven experiments (P
<
0.01 by Wilcoxon's rank sum test for paired samples). However, as can be seen from figure 4, this superiority was limited to sampling points at 3 and 6 hr of treatment. By 12 hr, when the phenomenon of breakthrough growth became substantial, no such difference could be demon-strated.All essential results obtained withP.aeruginosa
strain ATCC 27853 were confirmed in similar ex-periments using clinical isolates 14974 and E 29/2 as the target organism.
Combined treatment with ticarcillin and genta-micin. In preliminary experiments, in vivo syner-gy had been demonstrated for the two study drugs in combination. Therefore, relatively low and in-termediate doses of the drugs were studied in com-bination experiments. Dosing regimens using l-and 3-hr intervals were compared.
The four possible combinations were simulta-neously investigated. (1) Granulocytopenic mice were treated by the schedule by which each drug had been demonstrated to be least active when given alone, that is, ticarcillin every 3 hr and gen-tamicin every 1 hr, (2) a second group got both drugs every 3 hr, and (3) a third group got both drugs every 1 hr. (4) A fourth group was treated with ticarcillin every 1 hr plus gentamicin every 3 hr, that is, the schedule by which each drug, when given alone, had proved to be most potent.
The results (figure 5) were as expected. Signifi-cantly most effective was the combination of l-hr injections of ticarcillin with 3-hr injections of gen-tamicin. Combining 3-hr doses of ticarcillin with 1-hr doses of gentamicin proved to be the least ac-tive regimen studied. An analysis of all combina-tion experiments demonstrated the significant (P
<
0.01) superiority of 1-hr vs. 3-hr regimens of ticarcillin. This superiority did not depend on whether the concomitantly administered gentami-cin was injected every 1 hr or every 3 hr. In con-trast, gentamicin in combination with any ticarcil-lin schedule studied tended to be more active in 3-hr than in 1-hr regimens (P<
0.05 and P> 0.05 for the lower and higher doses of gentamicin studied, respectively). Breakthrough growth was common predominantly when low doses and less favorable schedules were used. High-dose treat-ment and optimal dosing intervals were essentialan antibacterial effect in mice. This finding could be explained, at least in part, by the very short t Y2 of these drugs in mice. Therefore, our studies in-cluded dosing such that peak plasma levels and/or total area-under-the-concentration-vs.-time curves rather than injected amounts of drug were com-parable to those seen in patients receiving maximal doses of gentamicin or ticarcillin. Interesting dif-ferences in efficacy were found between such dos-ing of the two drugs. Gentamicin (2.5IJg/g every 1 hr or 7.5IJg/g every 3 hr) had only a small and transient effect, whereupon breakthrough growth of the study organisms occurred. This phenome-non has been the subject of previous investigations using the same study organisms [6, 7]. Ticarcillin, on the other hand, even at relatively low doses «75 IJg/g every 1 hr) was significantly more ef-ficacious, with the condition that the interval be-tween drug injections was 1 but not 3 hr. When properly spaced, even sub-MIC peak levels of ticarcillin were quite effective, although only bac-teriostatic. Thus, in contrast to gentamicin, the effect of ticarcillin was mainly due to the constant presence of the drug, rather than to very high peak levels. These differences in activity between ticar-cillin and gentamicin cannot easily be explained by the difference in t Y2 of the two study drugs. Other factors are likely to be involved.
The presence or absence of a postantibiotic ef-fect could well be of importance in regard to the results of our present study. In vitro exposure of P. aeruginosato gentamicin has been shown to be followed by a period of persistent suppression of bacterial regrowth lasting up to 2 hr after removal of the drug [4, 13]. In contrast, no postantibiotic effect could be demonstrated with ticarcillin [13]. Thus, in vitro as well as in vivo, P. aeruginosa seems to recover immediately as soon as the ticar-cillin level has fallen to subactive concentrations, whereas the postantibiotic effect of gentamicin would help to cover the dosing interval of this drug. Yet, this interpretation would not explain our results obtained in experiments combining the two study drugs. In those experiments l-hr injec-tions of ticarcillin were significantly more active than 3-hr doses, although theoretically the postan-tibiotic effect of gentamicin should have covered the interval between the 3-hr injections of ticarcil-lin. This finding clearly demonstrates that addi-tional important factors for optimal administra-tion of antibiotics have to be taken into account.
In this regard, the time lag between drug exposure and onset of bacterial killing might be of para-mount importance. After exposure of P.
aerugi-nosa
to gentamicin, this time lag is short and de-pendent on drug concentration in vitro as well as in vivo [4, 7]. In contrast, in the case of penicillins this time lag before the onset of bacterial killing seems to be considerably longer [14, 15](A.V.G. and C.F., unpublished observation). Thus, very short concentration peaks (due to very rapid elim-ination of the drug) could minimize the in vivo activity of ticarcillin.It is clear that much additional experimental work is needed, both in vitro and in vivo, to un-derstand how the shape of the concentration-vs.-time curve of an antibiotic affects its antimicrobial activity. Moreover, the answer to this question is certainly dependent not only on the antibiotic, its pharmacokinetics, and its mechanism of action, but equally so on the site of infection and the tar-get organism. Our investigations are no more than a first tentative approach to a complex problem. Nevertheless, speculatively extrapolating the re-sults of our findings to the clinical situation, one would postulate that, at least in the presence of leukopenia, ticarcillin rather than an aminoglyco-side should be administered as a continuous infu-sion. It is ironic that this postulate is the exact op-posite of what several authors of clinical studies have advocated in recent years [1-3].
References
1. Feld, R., Valdivieso, M., Bodey, G. P., Rodriguez, V. A comparative trial of sisomicin therapy by intermittent versus continuous infusion. Am. J. Med. Sci. 274:179-188, 1977.
2. Feld, R., Tuffnell, P. G., Curtis,J. E., Messner, H. A., Hasselback, R. Empiric therapy for infections in granu-locytopenic cancer patients: continuous infusion of ami-kacin plus cephalothin. Arch. Intern. Med. 139:310-314, 1979.
3. Keating, M.J., Bodey, G. P., Valdivieso, M., Rodriguez, V. A randomized comparative trial of three aminoglyco-sides - comparison of continuous infusions of gentami-cin, amikacin and sisomicin combined with carbenicillin in the treatment of infections in neutropenic patients with malignancies. Medicine (Baltimore) 58:159-170, 1979.
4. Gerber, A. D., Wiprachtiger, P., Stettler-Spichiger, D., Lebek, G. Constant infusions vs. intermittent doses of gentamicin against Pseudomonas aeruginosa in vitro.J. Infect. Dis. 145:554-560, 1982.
Dosing Interval and Antimicrobial Effect
carbenicillin on pseudomonas infection. In J. D. Wil-liams and A. M. Geddes [ed.], Chemotherapy. Proceed-ings of the 9th International Congress of Chemother-apy. Vol. 2. Plenum Press, New York, 1976, p. 289-293. 6. Gerber, A.V.,Craig, W. A. Aminoglycoside-selected sub-populations of Pseudomonas aeruginosa: characteriza-tion and virulence in normal and leukopenic mice. J. Lab. Clin. Med. 100:671-681, 1982.
7. Gerber, A.V., Vastola, A. P., Brandel,J., Craig, W. A. Selection of aminoglycoside-resistant variants of
Pseu-domonas aeruginosain an in vivo model. J. Infect. Dis.
146:691-697, 1982.
8. Bauer, A. W., Kirby, W. M. M., Sherris, J. C., Turck, M. Antibiotic susceptibility testing by a standardized single disk method. Am. J. Clin. Pathol. 45:493-496, 1966. 9. Stratton, C. W., Reller, L. B. Serum dilution test for
bac-tericidal activity.I.Selection of a physiologic diluent. J. Infect. Dis. 136:187-195, 1977.
10. Gavan, T. L., Barry, A. L. Microdilution test procedures.
InE.H. Lennette, A. Balows, W. J. Hausler, Jr., and J.P. Truant [ed.]. Manual of clinical microbiology. 3rd ed. American Society for Microbiology, Washington, D.C., 1980, p. 459-462.
11. Sabath, L. D., Anhalt, J. P. Assay of antimicrobics. In
917
E. H. Lennette, A. Balows, W. J. Hausler, Jr., and J.P. Truant [ed.]. Manual of clinical microbiology. 3rd ed. American Society for Microbiology, Washington, D.C., 1980, p. 485-490.
12. Snedecor, G. W., Cochran, W. G. Statistical methods. 6th ed. Iowa State University Press, Ames, 1967, p. 128-130, 432-438.
13. Bundtzen, R. W., Gerber, A. V., Cohn, D. L., Craig, W. A. Postantibiotic suppression of bacterial growth. Rev. Infect. Dis. 3:28-37, 1981.
14. Gerber, A. V., Bundtzen, R. W., Craig, W. A. Effect of dosing regimens on the activity of antimicrobial agents in an in vivo model.InP. Periti and C. G. Grassi [ed.]. Current chemotherapy and immunotherapy. Proceed-ings of the 12th International Congress of Chemother-apy. Vol. 1. American Society for Microbiology, Wash-ington, D.C., 1982, p. 124-126.
15. Goto, S. Evaluation of the activity of ticarcillin against experimental Pseudomonas aeruginosa infection in comparison with carbenicillin and sulbenicillin. In F. O'Grady, Y. Veda, D. Hoffler, and H. C. Neu [ed.]. Ticarcillin (BRL 2288). Excerpta Medica, Amsterdam, 1978, p. 3-14.