Cahier 2003-20
DUDLEY, Leonard
WITT, Ulrich
Yesterday’s Games: Contingency Learning and
the Growth of Public Spending, 1890-1938
Département de sciences économiques
Université de Montréal
Faculté des arts et des sciences
C.P. 6128, succursale Centre-Ville
Montréal (Québec) H3C 3J7
Canada
http://www.sceco.umontreal.ca
SCECO-information@UMontreal.CA
Téléphone : (514) 343-6539
Télécopieur : (514) 343-7221
ISSN 0709-9231
YESTERDAY’S GAMES:
CONTINGENCY LEARNING AND THE GROWTH OF
PUBLIC SPENDING, 1890-1938
Leonard Dudley*
Université de Montréal
leonard.dudley@umontreal.ca
and Ulrich Witt
Max Planck Institute for Research into Economic Systems, Jena
witt@mpiew-jena.mpg.de
October 16, 2003
Abstract
Neither democracy nor globalization can explain the doubling of the peacetime
public share in many Western countries between World Wars I and II. Here we
examine two other explanations that are consistent with the timing of the observed
changes, namely, (1) a shift in the demand for public goods and (2) the effect of war
on the willingness to share. We first model each of these approaches as a
contingency-learning phenomenon within Schelling’s Multi-Person Dilemma. We then derive
verifiable propositions from each hypothesis. National time series of public spending
as a share of GNP reveal no unit root but a break in trend, a result shown to favor
explanation (2) over (1).
JEL Code: H5
Keywords: Wagner's Law, war, government expenditures, democracy, globalization
___________________________________
*Leonard Dudley, Economics Department, Université de Montréal, Montréal QC Canada H3C 3J7, leonard.dudley@umontreal.ca, telephone 514-343-6717, fax 514-343-5813. An earlier version of this paper was presented at the meeting of the American Economic Association, Washington, D.C., January 3-5, 2003. The authors thank Jon Hamilton for helpful suggestions.
Two of the most remarkable pieces of social legislation of the twentieth century were the Unemployment Insurance Act of 1920 in Great Britain and the Social Security Act of 1935 in the United States. Each act, among other provisions, extended compulsory unemployment insurance, financed principally by a tax on payrolls, to all wage earners.1 Under the impact of these programs and similar legislation elsewhere, the size of public spending relative to GNP doubled in many industrialized countries during the inter-war years. As Figure 1 indicates, prior to the First World War, the public share had been relatively constant at about ten percent of GNP in the U.S., Canada, the U.K., Germany and Denmark. Then after the war, instead of falling back to its earlier level as it had after previous conflicts, government expenditure gradually accelerated, reaching record peacetime levels in the late 1930s. To date, the shift appears to have been durable: none of these countries has ever returned to its pre-World War I public-spending share.
[Insert Figure 1 about here.]
The timing of the legislation mentioned above is, however, inconsistent with two of the principal explanations that have been proposed for this rise in the public share, namely democracy and globalization. It has frequently been argued that the extension of the right to vote led to a rise in the demand for transfer payments. Meltzer and Richard (1981) suggested that because extensions of the franchise lower the income of the median voter relative to mean income, they tend to generate a demand for larger transfer payments. Accordingly, the granting of universal suffrage in the nineteenth and early twentieth centuries in most Western countries would appear to be the key to explaining the rise in the public share.2 But if we compare the dates of these changes with those of the first pieces of social legislation to have a major impact on public spending, the explanation does not seem quite this simple. In the United States, universal manhood suffrage was guaranteed by the fifteenth amendment of 1870. Yet it took another 65 years before Congress passed the Social
1
Under the earlier Unemployment Insurance Act of 1911 in Great Britain, unemployment compensation was limited to some two million workers in the engineering and construction sectors. The 1920 Act covered all 12 million wage earners.
2
Several recent studies have found empirical support for this hypothesis. Lindert (1994) found that the extension of the franchise was a significant factor in explaining the fraction of national income spent by governments on social transfers. Krusell and Rios-Rull (1999) calibrated a dynamic version of the Meltzer-Richard model for the United States under rational expectations and were able to explain the observed levels of taxation and transfer payments. In a study of 76 countries over the period 1960-1990, Mueller and Stratmann (2002) found that high levels of democratic participation are associated with more equal distributions of income.
Security Act. In the United Kingdom, the right to vote was extended to all men only in 1918, barely two years before the extension of unemployment insurance to all wage earners.3 Thus, while democracy may have been a necessary condition for the approval of social legislation, there would seem to be some other factor that was required in order to trigger a generalized demand for transfer payments.4
Some have argued that this additional influence was the movement toward globalization that began when shipping costs and protective barriers fell in the last half of the nineteenth century. Social legislation may be interpreted as insurance for workers against their greater exposure to external shocks when the economy becomes more open to foreign trade. Rodrik (1998, 1000) found that for the 1990-1992 period, the share of exports plus imports in GDP explained 44 percent of the variance in government spending as a share of GDP in 23 OECD countries. Yet while present-day disparities in the degree of openness of economies may be correlated with differences in the size their public sectors, changes in the degree of openness prior to World War II show little relation to variations in the size of public sectors.5 All five of the countries in Figure 1 became more open between 1870 and 1913, but the relative size of their public sectors remained stationary over that period. Then, although the degree of openness declined between 1913 and 1927, and decreased even further in the 1930s, all five experienced a substantial increase in the size of their public sectors during the 1920s and 1930s.6
3
To cite another example, France had universal manhood suffrage by 1852, but did not have compulsory unemployment insurance until 1967, over a century later. France did, however, introduce two major social programs in the interwar period, namely, medical and pension insurance.
4 It might be argued that it was women’s suffrage rather than men’s suffrage that is the more
appropriate measure of democracy if one is trying to explain public spending. Using American state and local data, Lott and Kenny (1999) found that granting the right to vote to women was followed by immediate increases in public expenditures. While it is true that in the United States the state and local share grew by a half between 1920, date of the sixteenth amendment guaranteeing women’s suffrage, and 1930 (from 5.2 percent to 9.1 percent), this change was almost entirely offset by a fall in the federal government share. Overall, the public share rose only moderately, from 11.5 percent in 1920 to 12.9 percent in 1930. We shall return to the impact of women’s suffrage in Section III below.
5
Huberman and Lewchuk (2002) found that openness helped explain an index of labor-market regulations and social insurance before 1913. However, these developments seem not to have had much impact on public spending, as Figure 1 indicates.
6
There are two other approaches to explaining the rise in the public share that are compatible with the time series presented in Figure 1. One possibility is that there was a shift in the demand for public goods. In the late nineteenth century, the German economist Adolf Wagner (1901) suggested that when incomes rise, citizens expect their governments to take on new responsibilities.7 Mueller (2003, 509) offered an explanation for what has become known as "Wagner's Law." As a society’s population migrates from the country to the city, negative externalities such as pollution rise, while at the same time the need for public goods such as parks increases. Government spending must therefore rise more rapidly than income. Note that if this “shift-in-demand” hypothesis is correct, the rise in the public share is potentially reversible. All that is required is a change in income or urban density in the other direction to restore the earlier situation of low public spending.8
The remaining approach that might explain the data of Figure 1 emphasizes the effect of warfare on individuals' generosity toward unrelated members of their own society -- reciprocal altruism, as defined by Trivers (1985). In their study of public finances in the UK, Peacock and Wiseman (1961) pointed out that the British government's peacetime expenditures as a fraction of GNP have tended to rise after major wars. They explained this pattern by an increase in social cohesion created by wartime experience. Intense wartime cooperation within national groups that was carried over into peacetime might therefore be the key to explaining the striking similarity in the public-share trajectories of the U.S., Canada, the U.K. and Germany shown in Figure 1. The First World War may have triggered an increase in people's willingness to share.
In the one econometric study that attempted to assess the importance of both Wagner's Law and war on social spending prior to World War II, Lindert (1994; 17, 23) found little support for either explanation. However, his data were at ten-year intervals, over the period from 1880 to 1930, for a panel of 21 countries. He thus missed the important increase in public spending over the 1930s.
7 It is by no means clear that Wagner himself was referring to a rise in the state’s share of income
(Bird, 1971). However, under what has since become known as “Wagner’s Law,” public goods are thought to be luxury goods, increasing their expenditure share when per-capita income levels rise.
8
Kau and Rubin (1981) suggested an analogous approach that might be termed “shift-in-supply” whereby changes in the cost of collecting taxes determine the level of public expenditure. However, changes in the tax base resulting from the introduction of the personal income tax following the thirteenth amendment of 1913 are unable to account for the inter-war rise in government spending as a share of GNP. The federal government of the United States had levied a progressive tax on personal income from 1862 during the Civil War but had abolished it in 1871 because of taxpayer opposition (Webber and Wildavsky, 1986, 418).
Moreover, his specification is inappropriate if one wishes to capture the dynamic impact of shocks whose timing varies across countries. Finally, the reduced forms he used are not derived from individual behavior and thus tell us little about people's motivations.
Developments in game theory, in the psychology of learning and in time-series econometrics suggest the need to reexamine both Wagner's Law and the effects of war as possible explanations for the rise in the public share. We make three departures from previous studies of this question. First, we base our study on a theoretical model of strategic interaction that allows multiple equilibria. During the inter-war decades of the twentieth century, we suggest, the citizens of Western democracies managed to resolve what Schelling (1978) has called the uniform Multi-person Prisoner’s Dilemma (MPD). Schelling showed that the provision of public goods could be assured if viable coalitions could be formed among potential beneficiaries from such goods. To explain why the outcomes of the dilemma could change so dramatically compared with earlier wars, we follow Heckathorn (1996) in suggesting that technological innovations may change the nature of social interaction by altering the ranking of payoffs in such a game.
Second, we apply the psychological theory of contingency learning to explain why Schelling’s coalitions can be held together despite the incentive to free ride. In doing so, we use a version of the melioration-learning process proposed by Brenner and Witt (2003). Rather than base their decisions on forecasts of marginal utility, this approach suggests, individuals tend to choose the option that has yielded the highest average payoff in the past. This learning theory is appropriate for decisions that are both complex and must be made frequently, and where each choice has only a slight impact on the decision-maker. Accordingly, we argue, melioration learning may be used to explain the day-to-day modification of political opinions.
Finally, we test the implications of the theoretical model using time-series for individual countries with a specification by Perron (1989, 1997) that allows one to distinguish between persistent shocks and a break in trend. We demonstrate that each of the alternative hypotheses has different implications for the movement over time of total public spending as a share of GNP.
Accordingly, we are able to avoid the difficulties of attempting to separate government consumption from spending on transfer payments.9
Our suggestion that wars may have an impact on social cohesion is related to other recent literature. To explain why people contribute voluntarily to charity, Sugden (1984) proposed a principle of reciprocity, under which people have an aversion to free-riding. However, there seem to be definite limits to such charitable feelings. Austen-Smith (2000) noted that countries with simple-majority electoral systems tend to have less equal post-tax income distributions than those with proportional representation. Alesina, Baqir and Easterly (1999) argued that unwillingness to share across ethnic boundaries explains why the public sector is smaller in some political units than in others. The authors showed that in the United States, ethnically diverse municipalities tend to spend a smaller share of tax receipts on public goods than more homogeneous municipalities do. Alesina, Glaeser and Sacerdote (2001) extended this concept to transfer payments at the national level, comparing the United States with European countries. They argued that because ethnic minorities tend to be over-represented among the poor in the US, the American political system has been unable to generate the generous social programs and progressive tax systems that are to be found in Europe. The theoretical approach we propose here offers a possible explanation for these results. Shared sacrifices may be seen as breaking down the barriers between ethnic groups; where such common sacrifices have not taken place, the willingness to share is weaker.
In Section I below, we set out the facts to be explored and inquire whether a cognitive or an adaptive approach to decision-making is more appropriate. In Section II, we introduce melioration learning into a general coordination game in order to derive verifiable propositions concerning the two principal explanations for the rise in the public share, namely, a shift in the demand for public goods and an increase in the willingness to share. Finally, in Section III, we test these propositions by estimating breaking-trend functions for long time series of the share of public spending in five countries.
9One problem in making such a separation is that reliable estimates of public consumption on a
national-accounts basis are not available for most countries prior to the 1920s. Another more fundamental difficulty is that with the possible exception of pure public goods such as defense, as Aranson and Ordeshook (1981) pointed out, most types of public spending have a redistributive component. Although voters at the time were presumably able to assess the distributional effects of proposed changes in public spending, we today may have difficulty in doing so.
I. Changes in Public Spending and the Decisions behind Them
In this section, we look more closely at observed changes in public-spending patterns and the decision process behind them. We first consider the facts to be explained and the extent to which they support the “shift-in-demand” or the “willingness-to-share” approaches. We then turn to two procedures that might be followed to develop testable hypotheses. The traditional procedure assumes a cognitive process of calculation of expected costs and benefits. An alternative procedure supposes an adaptive process of learning from recent experience.
(a) Shift in Demand or Increased Willingness to share?
Let us begin our study by looking at changes in the size and composition of government spending for a sample of five Western countries. Then we will compare these changes with data on possible causal factors, namely, per-capita income growth and the impact of war.
(i) Public Spending and New Social Programs
As we have already seen in Figure 1, the time path of peacetime public spending changed considerably after the First World War. Although the public share initially fell in the countries of our sample relative to the levels of the wartime period, it remained higher than the levels previously observed. Moreover, this share subsequently tended to rise, reaching record peacetime levels in most countries during the Great Depression of the 1930s. A striking feature of these changes is the manner in which they were correlated across countries. The time series shown in Figure 1 have an average correlation of 0.77 over the period from 1890 to 1938. If the war years are removed, the average correlation coefficient jumps to 0.87.
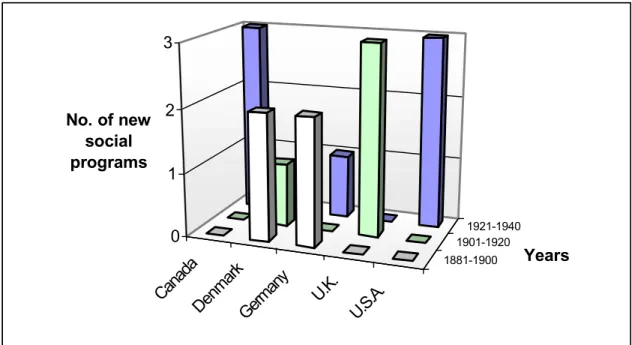
Not only did government expenditures rise with respect to income over the period studied, but also the composition of public spending changed. In 1880, the amount devoted to poor relief and hospitalization in the five countries studied here was less than one percent of GNP (Lindert, 1994, 10). Then in the 1880s and 1890s, Germany and Denmark led the rest of the world in the introduction of new social programs. Under Bismarck, Germany legislated industrial accident insurance in 1884 and pension insurance in 1889. Denmark followed with pensions in 1891, accident insurance in 1898 and subsidized voluntary unemployment insurance in 1907. The UK brought in
three major pieces of social legislation in the years prior to the First World War—industrial accident insurance in 1906, national pensions in 1908 and limited compulsory unemployment insurance in 1911. Britain extended unemployment insurance to all wage earners in 1920. In 1927, Germany too set up compulsory unemployment insurance (Flora and Alber, 1981, 59). By 1930, it was devoting almost five percent of its national income to government transfers (Lindert, 1994, 1930), with Denmark and the U.K. not far behind. Figure 2 provides an indication of the timing of these three types of social programs.10
[Insert Figure 2 about here.]
It was not until the late 1920s that the two North American countries in our sample began to introduce similar social programs. Canada brought in old-age support in 1927 for those able to satisfy a means test. Both Canada and the U.S. legislated accident insurance in 1930. Then, under the New Deal, the U.S. set up programs for Old Age Assistance and unemployment insurance in 1935. Finally, Canada too introduced unemployment insurance in 1940 (Kuderle and Marmor, 1981).
(ii) Economic Growth
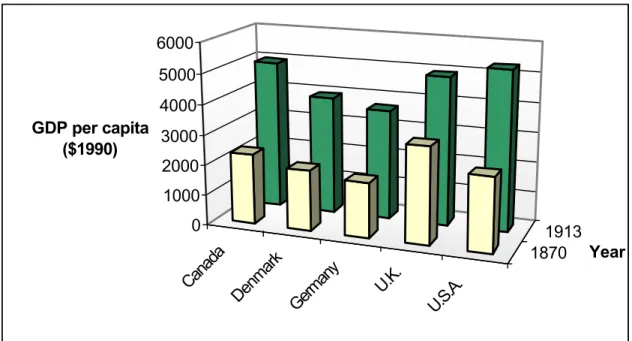
As mentioned in the introduction, one of the explanations offered for the rise in the public share was that urbanization and rising levels of per-capita income pushed Western societies from a conventional equilibrium with low spending on public goods to an alternative convention with high public spending. Figure 3 indicates that the half century prior to the First World War saw a doubling of real income levels in the countries being studied. However, as we have just seen, the two countries with the highest per-capita incomes in 1913 and the most rapid growth rates over the preceding decades – Canada and the U.S. – were the slowest to introduce social legislation.
[Insert Figure 3 about here.]
(iii) World War I and New Information Technologies
An alternative approach to explaining the rise in the public share is that Western societies underwent a major transformation owing to the effects of World War I on people's willingness to
10
share with their fellow citizens. Without a doubt, the First World War was a traumatic experience for most of the belligerent societies. Battlefield deaths amounted to three percent of the population in Germany and almost two percent in Britain. Canada lost almost one percent of its population, with the losses borne disproportionately by the English-speaking majority. The war also cost 115,000 Americans their lives, enough to affect communities across the country for a generation. Even Denmark, although not a participant in World War I, was obliged to make sacrifices: it introduced rationing after 1917, when Germany's policy of unrestricted submarine warfare cut off its trade with overseas markets.
The countries being studied had also suffered greatly during previous major conflicts such as the Napoleonic Wars and the American Civil War. A crucial difference between these earlier wars and World War I was that detailed information on the sacrifices was now made available vividly within twenty-four hours in a form that was readily accessible to virtually the entire adult population. From the 1890s, the halftone process for facsimile reproduction allowed photographs to be printed in magazines and newspapers. At the same time, there was a sharp fall in the cost of distributing information rapidly as a result of improvements in the printing industry – paper from wood pulp, the electric motor, the linotype machine.
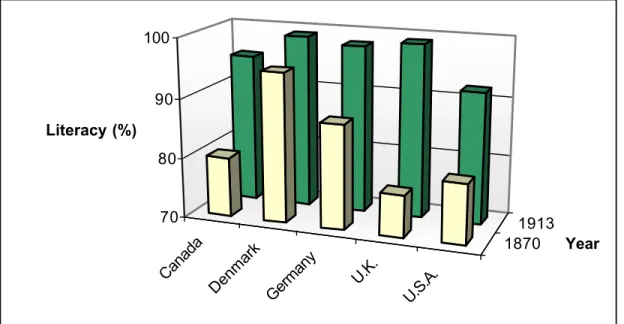
Yet printed information was only useful to those able to read. The introduction of universal compulsory free education was therefore a necessary complement to these innovations. Figure 4 shows that during the decades that preceded the First World War, literacy was extended to all but a small fraction of the populations of the countries being studied. It is interesting to note that the countries with the highest literacy rates in 1870 – Denmark and Germany -- were the first to introduce major social programs. Note too that the U.S. and Canada, mainly because of their large black and French-speaking populations, respectively, were both slow to reach universal literacy. They were also the slowest to introduce social legislation. The U.K. was in an intermediate position. As the stationary levels of the public share before the First World War in Figure 1 show, however, rising literacy alone seems to have been insufficient to generate a substantial jump in the demand for government spending. To understand why not, we must examine voting behavior.
(b) The Rational-Choice Model of Voting
How might we model the decisions of the voters who approved a doubling of the peacetime public share during the inter-war period? The principal theoretical tool that has been used to analyze voter behavior, the model of rational choice, breaks such a decision into two steps. First, the voter decides whether or not to vote; second, in a two-party race, she votes for the candidate whose program promises her the greater utility. Leaving the second step aside for the moment, let us look more closely at the decision to vote. Riker and Ordeshook (1968) proposed a specification in which the expected reward from voting is determined by three considerations. One is the voter’s net benefit if the candidate she favors wins, a second is the probability of casting the deciding vote, and a third is the cost of voting. Since the probability of being decisive is extremely small in a large population and since the cost of voting is small, one would not expect either the direct costs or benefits to play much of a role. Indeed, empirically, Riker and Ordeshook found that the only variable that had a large quantitative impact on the probability of voting in American presidential elections was the call of civic duty – a consideration not explained by rational-choice theory. Subsequent studies by Ashenfelter and Kelley (1975) for American presidential elections and more recently by Blais, Young and Napp (2000) for Canadian provincial voting confirm the overwhelming importance of the moral obligation to vote in motivating people to go to the polls.
If people vote primarily because of their duty as citizens, the cognitive calculation of future costs and benefits does not play a major role in the first of the two decisions postulated by the rational-choice model, the decision whether to vote. But does it then make sense to assume that the second decision, the choice of candidate, is dictated by such a rational calculation? Let us consider an alternative, non-cognitive procedure for modeling voter behavior.
(c) Errors in the Cognitive Process
In a recent review of the evidence on rationality provided by behavioral experiments, McFadden (1999) distinguished between those anomalies caused by errors in perception and those caused by errors in the cognitive process for decision making. Since the use of a simple rule – voting because it is one’s duty – to solve a problem as complex as voting would appear to fall into the latter category, we will examine one of the best-supported explanations for such processing errors. First, however, let us set the voter’s problem into a more general framework.
(i) Schelling’s Multi-Person Dilemma
There is an alternative approach to that proposed in the model of the rational voter. Public decision-making by majority voting is a special case of a situation that Schelling (1978, 217-221) described as a Uniform Multi-Person Prisoner’s Dilemma. Consider a situation in which n players must decide whether or not to contribute identical amounts to financing a public good from which all will benefit. For example, a number of shipowners must decide whether or not to finance a lighthouse that will benefit all. The dilemma can be resolved, Schelling argued, if two conditons are satisfied. First, the participation of k individuals each paying $x would suffice to cover the cost of the lighthouse. Second, there must exist at least k individuals who would each prefer the lighthouse to having $x. Under these conditions, a viable coalition of size k could be formed, each of whose members would benefit from cooperating. It would not matter to each coalition member that there are n-k individuals outside the coalition who benefit from the lighthouse without paying.
An important issue that Schelling does not address is how such a coalition may be organized when k is very large and the number of individuals who would benefit from the cooperative solution is greater than k. Each potential contributor may justify waiting until a viable coalition is formed without him. In these circumstances, Gradstein (1992) has argued, the waiting period for private provision of a public good is likely to be infinite.
(ii) The Melioration-Learning Hypothesis
If Gradstein is correct, why are there so many cases (for example, the technology that controls the internet) of voluntary provision of public goods? A moment’s reflection will confirm that many of the decisions we take in our daily lives satisfy three conditions. First, they are made repeatedly; second, each decision is relatively unimportant; third, the satisfaction derived from a given choice depends on the frequency with which the same option had been chosen in the recent past. Under such circumstances, Herrnstein and Prelec (1991) have shown, the calculation of expected future benefits is extremely complex, since today’s choice will affect the utility derived from a chain of uncertain future events. Even for a choice as banal as whether to have pizza or a sandwich for lunch today, the calculation of a consumption pattern that maximizes utility can defy the capacity of all but a small minority of individuals.
Under the conditions just described, instead of making the computations assumed by rational-choice theory, people may update their probability of cooperating by a process of contingency learning; that is, learning in which associations are strengthened by the degree to which stimuli provide new information about responses (Peterson, 1999, 209). As Herrnstein (1991) reported, several decades of experiments show that rather than maximize an expected flow of
marginal utility in the future, people (and animals) tend to choose the option which has yielded the
higher average return over a recent time interval in the past. The resulting decision pattern is known as matching, since the average returns to different choices tend to be equalized. If subjects are unable to take account of the impact of current choices on marginal rates of return, matching often leads to results that are sub-optimal. Brenner (1999) has explained how such a procedure may be incorporated into a coordination game in a population of randomly interacting individuals. Using this approach, Brenner and Witt (2003) demonstrated in a littering game with negative externalities that the outcome can be disastrously different from that predicted by models of rational behavior.
(iii) The Polling Game
Voting on a political question by secret ballot is a rather infrequent activity. However, the actual vote by which public officials are rewarded or punished for their actions is merely the ultimate sanction of a process of collective opinion formation. Between elections, politicians tend to react promptly to public sentiment as expressed in conversations with and letters from their constituents, in newspaper editorials, and more recently, in public opinion polls.
Consider one such debate. Imagine that one political party is proposing to use taxation to finance additional public goods such as roads and schools while the other would maintain the status quo. As in Schelling’s (1978) Multi-Person Dilemma, the individual, in expressing her opinion on this issue, plays simultaneously with all other players. She will likely reformulate her opinion frequently as she receives new information. Moreover, since the citizen-voter realizes that her voice has a low probability of being decisive, whether in public polls or in actual elections, she has little incentive to invest much cognitive effort in the decision-making process. Finally, a player’s gains depend on the behavior of the other players. If the latter are honest in paying taxes and in administering public programs, the payoffs to the voter in question will be higher than if tax evasion is widespread and officials are corrupt. Consequently, as in the Herrenstein and Prelec (1991) choice of pizza or a sandwich, it may be difficult to calculate the future benefits of each possible choice.
Forming one’s opinion with regard to a political question therefore satisfies the three requirements for melioration learning. A simple rule is as follows: if other members of society have recently been observed to cooperate in paying taxes and administering public funds, then government activity has been a rewarding experience; therefore, approve the expansion of the public sector. Otherwise, such interaction has been a non-rewarding experience; therefore, reject the proposition.
Thus, by inserting the Herrnstein-Prelec (1991) melioration-learning hypothesis into Schelling’s (1978) Multi-Person Dilemma, we obtain a possible explanation for how people form their political opinions. In the next section, we shall inquire whether such a model can explain the stylized facts of a rapid rise in public spending and a change in composition favoring transfer payments in the decades prior to the Second World War.
II. On Changing Games while Playing
Let us examine more formally the possible explanations for the inter-war increase in the public share in a number of Western countries. We shall attempt to model both the “shift-in-demand” and the “willingness-to-share” approaches as special cases within the framework just discussed, namely, Schelling’s (1978) Multi-Person Dilemma. The new feature we add is that under melioration learning, the players’ past choices may alter the fundamental structure of this game while they are playing it.
(a) The Normal-form Game
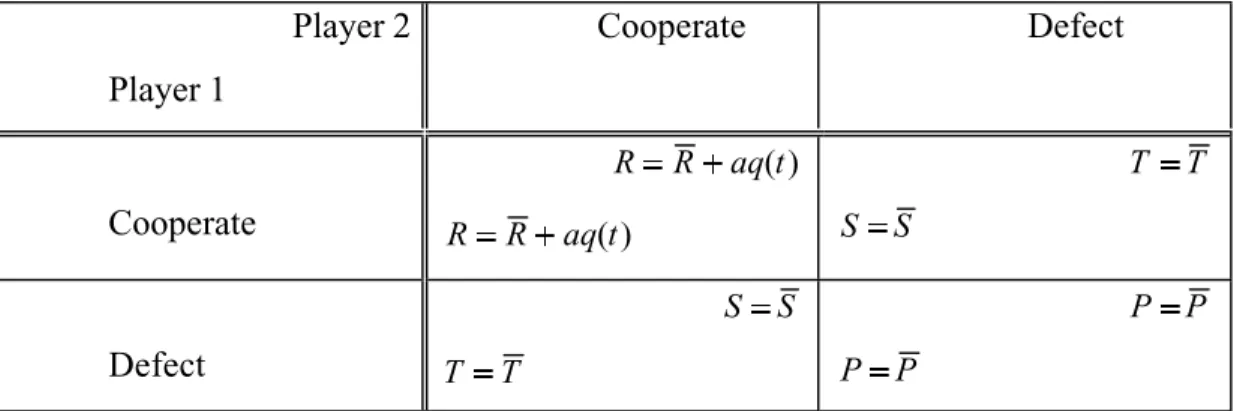
We have argued that expressing a political opinion in a large group may be viewed as an n-player coordination game played simultaneously by each n-player with every other n-player. Suppose that elected governments respond to day-to-day changes in public opinion, with periodic formal voting serving as a mechanism for rewarding their success in doing so. For simplicity, let us examine the responses to an opinion survey of two representative players, each with two possible strategies.11 Each player considers the other to represent an important group within the society. Cooperation means expressing one’s willingness to pay additional taxes for such a program, while defection means accepting the program only if one is excluded from its financing. Let R, T, S and P represent the Reward, Temptation, Sucker and Punishment payoffs respectively; R , T , S and P correspond to the respective base values of these payoffs. We will assume that the ranking of these base levels corresponds to the Prisoner’s Dilemma; that is, T R P S . To simplify the notation, let the payoff structure be identical for each player.
Consider first the “shift-in-demand” approach, which takes the form of a proposition to increase spending on public goods beyond an existing minimum level. Assume that the payoff to the individual from more public goods depends on the demand for such goods. Let a, where a 0, measure the demand for additional public goods. Assume further that that unanimity in approving the project is necessary but not sufficient for its success. Examples are conscription for military defense against an external attack or a road to a port to be financed by a combination of taxes and corvée labor. Failure to elicit initial support from a key group in the population would assure military
11
defeat or prevent completion of the road. However, given this initial unanimous support, the degree of success may depend on the willingness of third parties to cooperate during the subsequent execution of the program. Cowardice on the battlefield or slacking during the road construction would reduce the payoffs to the initial decision to cooperate. Define q(t) as the average percent of cooperation observed among third parties in the rounds before time t. Then the expected payoff to the individual from joint acceptance of a program of additional public goods may be assumed to take the form R R aq(t). Because of the assumption that unanimity is required for success, the Temptation and Sucker payoffs remain at their base levels. The resulting game is displayed in panel (a) of Table 1.
Consider next the alternative explanation of the rise in the public share, the “willingness-to-share” approach. Let cooperation now mean expressing one's willingness to finance transfer payments for those who meet certain criteria of need once the veil of ignorance has been lifted. Defection means refusal to approve contributions to such a program. Unlike the public goods discussed above, unanimity is not required for success. For example, the program could be financed by a progressive tax with exemptions for certain groups. Let the positive parameter b, assumed constant over time, measure the demand for such a program, a demand motivated by altruism or insurance considerations.
The major constraint to adding a redistributive component to public spending is dishonesty; that is, the danger that officials and potential recipients might take advantage of other player’s generosity. Therefore, allow the cost of the program to depend on the quality of information available about the acts of administrators and beneficiaries, as measured by the parameter . If
,
0 then information quality is low, contributions are squandered on administrative costs and payments to those who are not needy. Thus the payoffs to the game are the basic levels of the Prisoner's Dilemma. If 1 however, then information quality is high and an efficient system of, transfer payments is feasible. The term bq(t) is added to the Reward, Temptation and Sucker payoffs. The nominal forms this version of the public-expenditure dilemma is shown in panel (b) of Table 1.
Returning to the "shift-in-demand" hypothesis, we see that with demand for public goods high (a>0), a sufficient increase in q could raise R above T, thereby converting the game from Prisoner’s Dilemma to Assurance.12 If each player can be assured that a sufficient number of others will cooperate, then it is in her interest to cooperate. Alternatively, under the "willingness-to-share" hypothesis, with high quality of information ( =1), a sufficient increase in q could lift S above P, transforming the game from Prisoner’s Dilemma to Chicken. In this case, confidence in the honesty of public officials and other taxpayers would lead citizens to conclude that their welfare would rise if they supported a system of public transfers.
Let the moving-average component of the payoffs change in the following way:
m i c ip t i t q 0 ) ( ) 1 ( , i 0, (2.1)
where pc(t) is the percentage who cooperate at time t.
(b) Learning to Cooperate
Under the formulation of the melioration-learning hypothesis proposed by Brenner and Witt (2003), the probability that an agent cooperates changes according to the following equation:
) ( ) ( ) ( 1 ) ( ) ( ) 1 (t p t p t p t c t pc c c c c d , (2.2)
where c(t)is the average payoff to cooperation in the recent past, d(t)is the average payoff to defection and 0 is the rate at which people learn from experience.
Let the number of times the agent has cooperated in the recent past be represented by kc(t). On these occasions, assume that the other player cooperated kcc(t)times and defectedkcd(t) times. The average payoff when the agent cooperated is then calculated as follows:
12
Heckathorn (1996) showed that technology could alter the nature of the coordination game in this way.
S t k t k R t k t k t c cd c cc c ) ( ) ( ) ( ) ( ) ( , (2.3)
where R and S are the reward and Sucker payoffs respectively, as defined in Table 1. Similarly, if on the kd(t) occasions that the agent defected in the past, the other player cooperated kdc(t) times and defected kdd(t) times, the average payoff to defection is calculated as:
P t k t k T t k t k t d dd d dc d ) ( ) ( ) ( ) ( ) ( , (2.4)
where T and P are the Temptation and Punishment payoffs respectively.
Now kcc /kc q kdc/kd and kcd /kc 1 q kdd/kd, where the time notation has been dropped for simplicity. Substituting from (2.3) and (2.4), we may then define the individual’s net benefit from cooperation, , as
). )( 1 ( ) (R T q S P q d c (2.5)
It remains now to show how individuals will react to a change in the demand for public goods or, alternatively, to a change in the extent to which the actions of public officials can be verified.
(c) Two Testable Propositions
In search of testable propositions, let us reexamine the two approaches to modeling public spending that were presented in the introduction.
(i) The Shift-in-Demand Proposition
The “shift-in-demand” approach may be represented by a change in the public-good-demand parameter, a, from zero to a positive value, with the information-quality parameter, , equal to zero. Substituting from Table 1 into equation (2.5), we obtain:
). )( 1 ( ) (R aq T q S P q (2.6)
The values of q for which 0 are the roots of the equation,
0
)
(
)
(
)
(
2q
R
T
P
S
P
S
aq
.Let Z (R T) (P S). Then these roots are:
a S P a Z Z q 2 ) ( 4 2 . (2.7)
Since P S, one of the roots to (2.7) will be positive and the other negative.
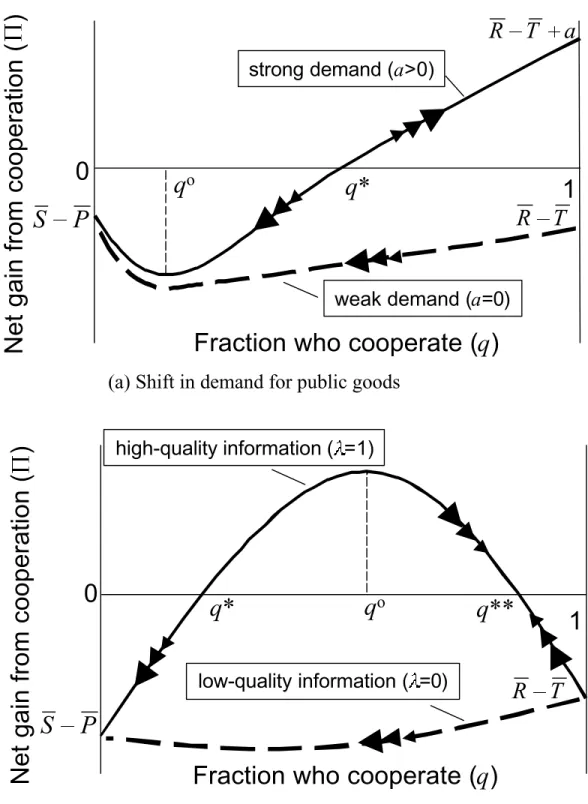
The effect of a change in the share who cooperate, q, on the net gains to the individual from cooperation, , is indicated by the sign of d / dq. When the demand for public goods is low (a=0), from (2.6), this derivative is always negative. The broken curve in Figure 5(a) shows this situation. If the public-good demand is high (a>0), the derivative is positive, provided that q q* Z/2a. The solid curve displays the resulting relationship. With regard to dynamics, inspection of (2.2) shows that for values of q greater than q*, the propensity to cooperate, pc, increases at a rate proportional to the height of the curve. For q less than q*,
pc declines at a rate proportional to this height. Since q is simply a weighted moving average
of pc, we see that large shocks to q tend to have persistent effects, shifting the society back
and forth between low and high levels of cooperation. The result is the following proposition:
Proposition 1. If the demand for additional public goods is strong (a>0), then a large shock to the propensity to cooperate, q, will tend to persist.
(ii) The Willingness-to-Share Proposition
Now consider the alternative explanation for an increase in the relative size of the public sector, namely, a reduction in the cost of administering transfer payments. Let , the parameter measuring the quality of information about the acts of public officials, change from zero to one, while a, the public-goods-demand parameter, remains at zero. Substituting from Table 1 into equation (2.5), we obtain, ). )( 1 ( ) (R T q S bq P q (2.8)
The values of q for which 0 are the roots of the equation,
0
)
(
)
(
)
(
2S
P
S
P
T
R
b
q
bq
.These roots are:
b S P b Z b Z b q 2 ) ( 4 ) ( ) ( 2 . (2.9)
Since P S, if the roots exist, they will both be positive.
If information is of low quality ( =0), the roots are not real and the system always returns to the no-cooperation equilibrium after a shock. The broken line in Figure 5(b) illustrates this situation. However, if information is of high quality ( =1), the solid line displays the resulting relationship between the net gain from cooperation, , and the average fraction of players who cooperate, q. We may represent the roots of (2.9) by q* and q**, where q*<q**. The sign of d /dq
is positive provided that q*<q<q**. Inspection of (2.2) shows that for values of q within this range, the propensity to cooperate, pc, increases at a rate proportional to the height of the curve. For q
outside this range, pc declines at a rate proportional to this height. As a result, from (2.1), we see that
an initial large shock to q will subsequently be dampened, with the society approaching equilibrium at q*. Any subsequent shock that maintains pc at a level above q* for m periods will be followed by
We have, therefore, a second proposition.
Proposition 2. If the acts of public officials and beneficiaries of transfer payments may be verified ( =1), then a large shock to the propensity to cooperate, q, will trigger a gradual transition to a new equilibrium.
In short, the theoretical model offers a means of differentiating between the two principal explanations for the rise in the relative size of the public sector in Western democracies in the inter-war decades of the twentieth century. The effects of a “shift in demand” resulting from higher incomes and urbanization (a rise in a) can be identified by the persistence of large shocks to the psopensity to cooperate, q. The effects of an increased “willingness to share” permitted by improved information technology (an increase in ) can be identified by a break in trend of q, followed by a gradual approach to a stable equilibrium. In both cases, however, there is a “critical-mass” effect: if the arbitrary shock is not sufficiently large or not maintained long enough, the temporarily induced cooperation (q), will rapidly die out (see Witt, 2001).
III. An Empirical Test with Time-Series Data
The preceding section proposed two theoretical explanations for changes in people's willingness to pool their expenditures with strangers, one based on their demand for public goods and the other on the information available about the honesty of public officials. In this section, we shall attempt to determine which approach provides a better explanation of available data.
(a) Model Specification
How might we measure the average willingness to cooperate in a society; that is, the variable
q of the preceding section? Let y represent the ratio of government spending to GNP. In a
democracy, since the public share is the result of cumulative past decisions to share resources, it may be considered to be an increasing function of the average degree of cooperation observed in the past. In a society in which no one ever cooperated with strangers, the state would have a minimal size consistent with the defense of its borders and the protection of property. However, in a society in which everyone was willing to cooperate with strangers, the state would play a major role, channeling a large share of total income into collective expenditures. Let us therefore assume that the public share, y, is a linear function of the propensity to cooperate, q (for example y = 0.1 + q/2). Then we may test Propositions 1 and 2 by examining the time-series properties of the public share.
Perron (1989, 1997) proposed a procedure for identifying the presence of a unit root when a change in the slope of a function was also possible. The following regression must be estimated by ordinary least squares:
k i t i t i t t t t t DU t DT DTB y c y e y 1 1 , (3.1)
where Tb is the period of the break in the trend, DU is a dummy variable which takes on the value
1 for t Tb, DT = t for t Tb, and DTB = 1 for t Tb 1. The time of the break, Tb, may be
determined endogenously by selection of the value that minimizes the t-statistic for testing 1 (Perron, 1997, 358).
One possibility mentioned in the preceding sections was that a shift in the demand for public goods displaced the economy from a low to a high public-spending equilibrium. This “shift-in-demand” hypothesis expressed in Proposition 1 may be tested with equation (3.1). If one wishes to identify the effect of such variables as rising income, as suggested by Wagner (1901), or urbanization, as proposed by Mueller (2003), then one should test for persistent shocks over the sampling period. It is therefore appropriate to search for a unit root by testing the hypothesis that
1.
The other explanation for an increase in the public share was that because of improved information and education, World War I generated a rise in the “willingness to share” not observed after previous wars, thereby allowing a conversion of the public sector into a provider of transfer payments. In this case, following Proposition 2, we must search for a change in the slope of the public-share trajectory from zero to a positive value. We should therefore test the hypotheses 0 and 0 .
During the interval studied, government-spending programs were perturbed by the outbreak of the First World War. To take account of the war’s impact, we extended the number of periods of the dummy variable, DTB. For four of our five countries, this variable was assigned the value one-half for 1914 and one for the remaining war years. Because the USA was not affected by the war until 1917, however, we shortened the war period to the years 1917 and 1918 for this country.13
(b) Data
To measure changes in the share of public expenditures in national income over time, we need three sets of data in current prices for each country to be studied. First, we require GNP; second, we need total central government expenditures; finally, we require state and local government expenditures. In the case of Denmark, Germany and the UK, time series for all three types of data are available. Complete Denmark estimates from 1872 may be found in Nordstrand (1975, Table A.1).14 German estimates for all years after 1872 except 1914-1924 may be found in
13
An alternative procedure is to add a dummy variable for the war period to equation (3.1). We found that when this war dummy was added, the coefficient of the break dummy, DTB, was not significant, while the other coefficients were very similar to those reported in Table 2.
14
Andic and Veverka (1964, 244-245).15 Public expenditures for 1914-1918 are from Feldman (1993; 40, 83) and for 1919-1924 from Webb (1986, 779).16 As for the UK, the estimates of G/Y for 1890, 1895, 1900, 1905, 1910, 1913, 1915, 1917, 1918, and 1920-1938 come directly from Peacock and Wiseman (1967).17
For Canada, GNP and public consumption estimates for 1872 to 1925 are available in Urquhart (1993, Tables 1.1 and 1.3). The corresponding data for 1926-1938 are to be found in Statistics Canada, Canadian Statistical Review, Historical Summary, 1970, August 1972, Table 1.6. Federal transfer payments on a fiscal-year basis are from Leacy (1983; Series H-20, H-24, H-25 and H-29).18 We converted them to a calendar-year basis. Provincial transfer payments are available only for 1933, 1937 and 1939. The intervening years were estimated by interpolation. Estimates for 1872-1926 were calculated by application of an exponential growth rate to an arbitrary 1870 level of 80 per cent of federal transfers.
In the case of the United States, annual GNP estimates are available from 1889 in U.S., Bureau of the Census (1997, Series F98). Federal government expenditures are available from the same source (Series Y 457) on a fiscal-year basis which we converted to calendar-year. Finally, state and local government expenditures were available on a fiscal-year basis for selected years from 1902 to 1938 (Series Y 682). We estimated the intervening years by geometric interpolation and converted the series to a calendar-year basis. For the period from 1889 to 1901, we extrapolated assuming that the share of GNP was the same as in 1902.
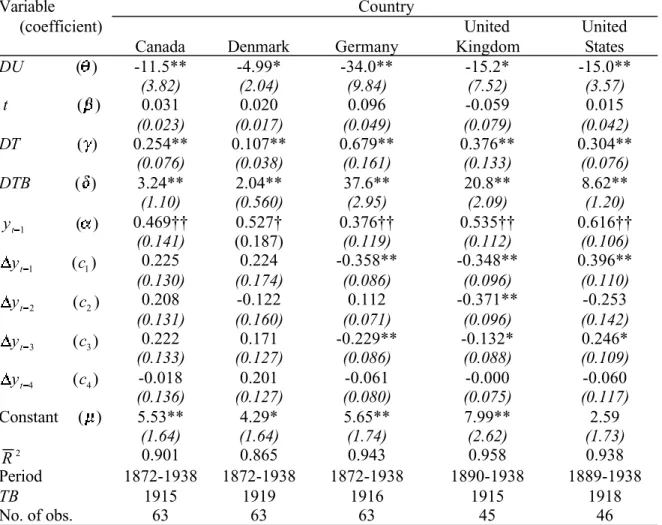
(c) Results
What, then, do the data say about the reasons for the unprecedented increase in peacetime public spending during the inter-war years of the twentieth century? The results for the five countries in our data set are presented in Table 2. Consider first the tests for a “shift in demand.” The presence
15
We calculated GNP for the missing years by applying the growth rates of industrial production from Mitchell (1998, 421) to real 1913 GNP.
16
Lindert (1994, footnote 13) has argued that the Andic-Veverka (A-V) public-spending data exaggerate the importance of German social spending since they include benefits from employer-sponsored funds. We have therefore removed the category “Transfers” in A-V, Table A.9, which the authors obtained from the returns of private funds (see their pp. 232-233).
of persistent shocks that reflect the theses of Wagner (1901) and Mueller (2003) may be verified by a test of the hypothesis that 1. This unit-root hypothesis is rejected at the 0.05 percent level for Denmark and at the 0.01 level for the four other countries. Shocks therefore appear to have dampened rather quickly and cannot explain a long-term rise in the public share.
[Insert Table 2 about here.]
Turn now to the “willingness-to-share” approach. The first hypothesis of this approach, that 0 , cannot be rejected at the 0.01 level for any of the five countries in our data set. Therefore, the public-share series was relatively stationary prior to the First World War. The second hypothesis, that 0 , cannot be rejected at the 0.01 level for any of the five countries examined. In all the countries examined, therefore, the public share series was characterized by a rising trend during the inter-war years. These results suggest that the hypothesis of a greater “willingness to share” of society following the First World War may be valid for many Western countries.
We may also estimate the date of the break in the slope. In the case of the three countries who were belligerents from the beginning of the war, the break occurred relatively early – in 1915 for Canada and the UK and in 1916 for Germany. For the late entrant, the USA, the break did not come until 1918. Finally, in the case of the non-belligerent, Denmark, the change in trend occurred only after the war’s end. These estimates of the date of the change in trend are helpful if one wishes to test the hypothesis that women’s suffrage caused the rise in public spending. Denmark allowed women to vote in 1915, Canada (for federal elections) in 1917 and Germany in 1918. In the United Kingdom, women of 30 or over were allowed to vote in 1918, those 21 or over in 1928. Finally, the nineteenth amendment became law in the United States in 1920, although women had been allowed to vote in state elections in many states before that date. In all countries but Denmark, the approval of female suffrage came after the estimated break in the public-spending trend.
It may be concluded, then, that these statistical results favor one of the alternative explanations for the rise in the public share over the other. The absence of a unit root in the five individual-country time series is inconsistent with the hypothesis of an upward shift in the demand for public goods. However, the evidence of a break in trend during or just after the First World War is compatible with the hypothesis of a gradual restructuring of the state to transfer income.
18 The authors thank Stanley Winer for help in obtaining these data.
Conclusion
What can we learn about public-spending decisions from the examples of the British Unemployment Insurance Act of 1920 and the American Social Security Act of 1935? More generally, why did the government shares of total spending rise to unprecedented levels along similar trajectories in a number of Western economies between 1920 and 1938? The widely separated dates for the introduction of universal manhood suffrage and the evidence of a rise in protection during the inter-war period indicate that neither democracy nor globalization can explain this development. Here we reexamined two other explanations, namely, that there was either a shift in the demand for public goods or a war-induced willingness to share with one's fellow citizens. By introducing a learning process that allows the payoffs to change endogenously into Schelling’s (1978) Multi-Person Dilemma, we provided a theoretical explanation for a movement between multiple equilibria. We then tested the resulting propositions with time-series data for the U.S., Canada, the U.K., Germany and Denmark.
The traditional approach to the rise in government spending focuses on shifts in the demand for public goods owing to changes in per-capita income or urbanization. We showed that a critical-mass effect appears once voters discover that their fellow citizens are willing to cooperate in the financing of additional public goods. Consequently, a large shock to public spending will tend to persist, shifting the society between equilibria with either a high or a low public share. However, the empirical evidence failed to support this approach: the hypothesis of a unit root was rejected.
An alternative approach suggests that in each nation, the collective sacrifices demanded during World War I led to a greater willingness to share income when peace returned. A necessary condition (that was not satisfied after previous major wars) is that information technologies allow people to verify the behavior of public officials and the beneficiaries of transfer payments. As a result, a crisis that caused levels of cooperation to rise above a critical-mass threshold could bring about a gradual transformation of the state into an efficient provider of transfer payments. Empirically, this approach was supported by evidence of a significant break in the trend of the public share in the five countries studied between 1914 and 1918. In Western societies that were approaching universal literacy, the crisis of the First World War seems to have triggered cumulative learning effects that changed the coordination game of voter-taxpayers while they were playing it.
References
Alesina, Alberto, Rez Baqir and William Easterly, "Public Goods and Ethnic Divisions," Quarterly
Journal of Economics, 114 (1999), pp. 1243-1284.
Alesina, Alberto, and Edward Glaeser and Bruce Sacerdote, "Why Doesn't the US Have a European-Style Welfare System," NBER Working Paper 8524, 2001.
Andic, S., and J. Veverka, "The Growth of Government Expenditure in Germany since the Unification," Finanzarchiv, 23 (1964), pp. 169-278.
Aranson, Peter H., and Peter C. Ordeshook, "Regulation, Redistribution and Public Choice," Public
Choice, 37:1 (1981), pp. 69-100.
Ashenfelter, O., and S. Kelley, Jr., "Determinants of Participation in Presidential Elections," Journal
of Law and Economics, 18 (1975), pp. 695-733.
Austen-Smith, David, "Redistributing Income under Proportional Representation," Journal of
Political Economy, 108:6 (2000), pp. 1235-1269.
Becker, Gary S., "A Theory of Competition among Pressure Groups for Political Influence,"
Quarterly Journal of Economics, 98 (1983), pp. 371-400.
Bird, Richard, "`Wagner's Law` of Expanding State Activity," Public Finance, 26:1 (1971), pp. 1-26.
Blais, André, Robert Young and Miriam Lapp, "The Calculus of Voting: An Empirical Test,"
European Journal of Political Research, 37 (2000), pp. 181-201.
Brenner, Thomas, Modelling Learning in Economics (Edward Elgar: Cheltenham, UK, 1999). Brenner, Thomas, and Ulrich Witt, "Melioration Learning in Games with Constant and
Frequency-Dependent Payoffs," Journal of Economic Behavior and Organization, 50 (2003), 429-448. Feldman, Gerald D., The Great Disorder: Politics, Economics and Society in the German Inflation,
1914-1924 (Oxford University Press: Oxford, 1993).
Flora, Peter, and Jens Alber, "Modernization , Democratization, and the Development of Welfare States in Western Europe,” in Peter Flora and Arnold J. Heidenheimer, eds., The
Development of Welfare States in Europe and America (New Brunswick, NJ: Transaction
Books, 1981), pp. 37-80.
Gradstein, Mark, "Time Dynamics and Incomplete Information in the Private Provision of Public Goods," Journal of Political Economy, 100:3 (1992), pp. 581-597.
Heckathorn, Douglas, "Dynamics and Dilemmas of Collective Action," American Sociological
Review, 61:2 (1996), pp. 250-277.
Herrnstein, Richard J., and Drazen Prelec, "Melioration: A Theory of Distributed Choice," Journal
of Economic Perspectives, 5:3 (1991), pp. 137-156.
Herrnstein, Richard J., "Experiments on Stable Suboptimality in Individual Behavior," American
Economic Review, Papers and Proceedings, 81:2 (1991), pp. 360-364.
Huberman, Michael, and Wayne Lewchuk, "European Economic Integration and the Labour Compact, 1850-1913," Cirano Scientific Series 2002s-34, Montreal, 2002.
Kau, James B., and Paul H. Rubin, "The Size of Government," Public Choice, 37 (1981), pp. 261-274.
Krusell, Per, and José-Victor Rios-Rull, "On the Size of U.S. Government: Political Economy in the Neoclassical Growth Model," American Economic Review, 89 (1999), pp. 1156-1181. Kuderle, Robert T., and Theodore R. Marmor, "The Development of Welfare States in North America," in Peter Flora and Arnold J. Heidenheimer, eds., The Development of Welfare
States in Europe and America (New Brunswick, NJ: Transaction Books, 1981), pp. 81-121.
Leacy, F. H., editor, Historical Statistics of Canada (Statistics Canada: Ottawa, 1983).
1-38.
Lott, John R. Jr., and Lawrence W. Kenny, "Did Women's Suffrage Change the Size and Scope of Government?," Journal of Political Economy, 107:6:1 (1999), pp. 1163-1198.
Maddison, Angus, The World Economy: A Millennial Perspective (Paris: OECD, 2001).
Meltzer, Allan H. et Scott F. Richard, "A Rational Theory of the Size of Government", Journal of
Political Economy, 89 (1981), pp. 914-27.
McFadden, Daniel, "Rationality for Economists?," Journal of Risk and Uncertainty, 19:1-3 (1999), pp. 73-105.
Mitchell, Brian R., International Historical Statistics : Europe, 1750-1993 (Macmillan, Stockton Press: Basingstoke, Hants, New York, 1998).
Mueller, Dennis C., Public Choice III (Cambridge: Cambridge University Press, 2003).
Mueller, Dennis, and Thomas Stratmann, "The Effects of Democratic Participation," Working Paper, University of Vienna, 2002.
Norstrand, Rolf, De offentlige udgifters vaerat i Danmark (University of Copenhagen Economics Institute: Copenhagen, 1975).
Peacock, Alan T., and Jack Wiseman, The Growth of Public Expenditure in the United Kingdom,
second edition (Princeton, NJ: Princeton University Press, 1967).
Perron, Pierre, "The Great Crash, The Oil Price Shock, and the Unit Root Hypothesis,"
Econometrica, 57:6 (1989), pp. 1361-1401.
Perron, Pierre, "Further Evidence from Breaking Trend Functions in Macroeconomic Variables,"
Journal of Econometrics, 80 (1997), pp. 355-385.
Peterson, Christopher, "Personal Control and Well-Being," in Daniel Kahneman, Ed Diener and Norbert Schwarz, eds., Well-Being: The Foundations of Hedonic Psychology (New York: Russell Sage Foundation, 1999), pp. 288-301.
Riker, William H., and Peter C. Ordeshook, "A Theory of the Calculus of Voting," American
Political Science Review, 62 (1968), pp. 25-42.
Rodrik, Dani, "Why Do More Open Economies Have Bigger Governments?" Journal of Political
Economy, 106 (1998), pp. 997-1032.
Schelling, Thomas C., Micromotives and Macrobehavior (New York: Norton, 1978). Seton-Watson, Hugh, The Russian Empire, 1801-1917 (Oxford: Clarendon Press, 1967).
Sugden, Robert, "Reciprocity: The Supply of Public Goods Through Voluntary Contributions,"
Economic Journal, 94 (1984), pp. 772-787.
Trivers, Robert, Social Evolution (Menlo Park, CA: Benjamin/Cummings, 1985).
Urquhart, M. C., Gross National Product, Canada, 1870-1926: The Derivation of the Estimates (McGill-Queen's University Press: Kingston & Montreal, 1993).
U.S., Bureau of the Census, Historical Statistics of the United States on CD-ROM (Cambridge: Cambridge University Press, 1997).
Wagner, Adolf, Finanzwissenschaft (Leipzig: C. F. Winter, 1901).
Webb, Steven B., "Fiscal News and Inflationary Expectations in Germany After World War I,"
Journal of Economic History, 46:3 (1986), pp. 769-794.
Webber, Carolyn, and Aaron Wildavsky, A History of Taxation and Expenditure in the Western
World, Simon and Schuster, New York, 1986.
Witt, Ulrich, "Between Appeasement and Belligerent Moralism: The Evolution of Moral Conduct in International Politics," Public Choice, 106 (2001), pp. 365-388.
Player 2 Player 1 Cooperate Defect Cooperate ) (t aq R R ) (t aq R R T T S S Defect S S T T P P P P
(a) Shift in the demand for public goods (a>0, =0)
Player 2 Player 1 Cooperate Defect Cooperate ) (t bq R R ) (t bq R R ) (t bq T T ) (t bq S S Defect ) (t bq S S ) (t bq T T P P P P
(b) Increased willingness to share (a=0, =1)
Table 2. Estimates of breaking trend functions for public expenditures as a share of GNP, five countries, 1872-1938
Country Variable
(coefficient)
Canada Denmark Germany
United Kingdom United States DU ( ) -11.5** (3.82) -4.99* (2.04) -34.0** (9.84) -15.2* (7.52) -15.0** (3.57) t ( ) 0.031 (0.023) 0.020 (0.017) 0.096 (0.049) -0.059 (0.079) 0.015 (0.042) DT ( ) 0.254** (0.076) 0.107** (0.038) 0.679** (0.161) 0.376** (0.133) 0.304** (0.076) DTB ( ) 3.24** (1.10) 2.04** (0.560) 37.6** (2.95) 20.8** (2.09) 8.62** (1.20) 1 t y ( ) 0.469†† (0.141) 0.527† (0.187) 0.376†† (0.119) 0.535†† (0.112) 0.616†† (0.106) 1 t y (c1) 0.225 (0.130) 0.224 (0.174) -0.358** (0.086) -0.348** (0.096) 0.396** (0.110) 2 t y (c2) 0.208 (0.131) -0.122 (0.160) 0.112 (0.071) -0.371** (0.096) -0.253 (0.142) 3 t y (c3) 0.222 (0.133) 0.171 (0.127) -0.229** (0.086) -0.132* (0.088) 0.246* (0.109) 4 t y (c4) -0.018 (0.136) 0.201 (0.127) -0.061 (0.080) -0.000 (0.075) -0.060 (0.117) Constant ( ) 5.53** (1.64) 4.29* (1.64) 5.65** (1.74) 7.99** (2.62) 2.59 (1.73) 2 R 0.901 0.865 0.943 0.958 0.938 Period 1872-1938 1872-1938 1872-1938 1890-1938 1889-1938 TB 1915 1919 1916 1915 1918 No. of obs. 63 63 63 45 46 standard errors in parentheses.
* coefficient significantly different from zero at 0.05 level; two-tailed test. ** coefficient significantly different from zero at 0.01 level; two-tailed test. † coefficient significantly different from one at 0.05 level; two-tailed test. †† coefficient significantly different from one at 0.01 level; two-tailed test.
0 10 20 30 40 50 60 70 1890 1900 1910 1920 1930 1940
Germany USA UK Canada Denmark
Source: see text, section III(b).
Canada
DenmarkGermany U.K. U.S.A.
1881-1900 1901-1920 1921-1940 0 1 2 3 No. of new social programs Years
Source: Flora and Alber (1981, 59), Kudrle and Marmor (1981, 83).
Canada
Denmark Germany U.K. U.S.A.
1870 1913 0 1000 2000 3000 4000 5000 6000 GDP per capita ($1990) Year Source: Maddison (2001, 264).
Canada
Denmark Germany U.K. U.S.A.
1870 1913 70 80 90 100 Literacy (%) Year Source: Graff (1991; 314, 285, 376).