OATAO is an open access repository that collects the work of Toulouse
researchers and makes it freely available over the web where possible
This is an author’s version published in:
http://oatao.univ-toulouse.fr/18252
Any correspondence concerning this service should be sent
To cite this version:
Lucciardi, Jean-Alain and Pouillat, Charly and Thomas, Nathalie and Boucheret,
Marie-Laure and Mesnager, Gilles FTN Signaling In the Saturation Regime: Spectral
Efficiency Improvement. In: ICC 2017, 21 - 25 May 2017 (Paris, France).
FTN Signaling In The Saturation Regime : Spectral
Efficiency Improvement
Jean-Alain Lucciardi
∗, Charly Poulliat
†, Nathalie Thomas
†, Marie-Laure Boucheret
†and Gilles Mesnager
∗ ∗ Embedded Systems, IRT Saint-Exupery, Toulouse, FranceEmail: [email protected]
†University of Toulouse, INPT-ENSEEIHT/IRIT, Toulouse, France Email: [email protected]
Abstract—Faster-than-Nyquist (FTN) signaling is investigated in future satellite communication standardization for an im-proved spectral efficiency considering the increasingly con-strained resource. Previous studies showed that FTN lower modu-lation orders compressed in time-domain could reach the spectral efficiency of uncompressed higher modulation orders. The FTN gain in terms of transmission rate is obtained at the price of a turbo-equalization at the receiver, increasing the complexity. The increased capacity in DVB-S2X’s transmissions is due to innovations increasing the fluctuation of the complex envelop of the transmitted signal. Since the satellite’s payload introduces higher non-linear distortions with increased fluctuations, the growing receiver’s complexity is unavoidable. However, in this non linear regime, the complexity of the FTN receiver is not this detrimental compared with those of a classical Nyquist receiver. For a similar spectral efficiency, its lower Peak to Average Power Ratio (PAPR), making the non-linearities treatment easier, makes this innovation suitable for future satellite communications, especially when the payload is operated in the saturation regime. In this paper, we show that compression offers a gain between 10% and 20% in terms of spectral efficiency when compared to Nyquist signaling, both equalized thanks to the MAP symbol detection based on the Volterra series model of non-linearities.
I. INTRODUCTION
In order to increase the spectral efficiency of the trans-mission, FTN signaling consists in increasing the symbol rate. The Nyquist criterion is not met anymore and inter symbol interference (ISI) is introduced. Non-linear channel is considered, linear Minimum Mean Square Error (MMSE) or non-linear Maximum A Posteriori (MAP) detection are applied at the receiver, increasing its complexity. Mazo first investigated FTN signaling for binary symbol and cardinal sine pulse shaping [1]. He defined a compression factor limit, also called Mazo limit, above which the ISI does not decrease the minimum euclidean distance and so, the theoretical Bit Error Rate (BER) achievable for the transmission. The following studies investigated FTN with root raised cosine (RRC) filters and defined a similar compression limit depending on the roll-off factor [2]. This specific case roll-offers an increased spectral efficiency, compared to usual Nyquist transmission, for a constant bandwidth.
In the literature, Maximum Likelihood (ML) or MAP re-ceivers are implemented, dealing with the introduced non linear ISI and allowing for data recovery, based on both For-ney’s [4] or Ungerboeck’s [5] approach. MAP based detectors are usually introduced to enable Turbo-equalization/detection
that is necessary to take advantage from FTN promises [6]. However, the benefit is reached at the price of an increased complexity at the receiver due to the iterative demapping.
The distortion due to the payload can be well approximated by Volterra series as depicted by Benedetto in [7]. Different pa-pers investigated the non-linear channel iterative equalization using Volterra kernels as Colavolpe’s [8] and reference therein. Linear and non-linear detection can be applied [9], offering trade-offs between performance and complexity. A previous study showed that FTN signaling with lower modulation orders compared to DVB-S2X’ waveforms (with the same asymptotic spectral efficiency) offers a reduced PAPR [3], pointing out the interest for time-packing paired with Volterra series model based equalization as introduced in [13].
In this paper, we investigate the interest of a reduced PAPR FTN signaling paired with an equalization based on the Volterra model when a transmission through a non-linear satellite channel is considered. In future satellite communica-tions, wideband amplification will be considered, introducing memory effects resulting in a highly selective channel. The satellite’s payload includes an input multiplexer (IMUX) filter, a high power amplifier (HPA) and an output multiplexer (OMUX) filter which results in strong non-linear ISI introduc-tion when the HPA operates near the saturaintroduc-tion point. This ISI requires equalization whatever the transmission is faster than Nyquist or at the Nyquist rate. We demonstrate that FTN can improve the capacity of usual DVB-S2X transmission in different ranges of SNR in the saturation regime with no increase of complexity if Volterra series model based detection is used. MAP detection is investigated, offering a trade-off between performance and complexity, resulting in different selection rules for detection, function of the spectral efficiency and the targeted Input Back-Off (IBO).
The paper is organized as follows. Section II briefly re-views the end-to-end FTN signaling system in linear context. Section III introduces the payload components, the usual Volterra’s series non-linearity model and its extended version when faster-than-Nyquist signaling is considered. We describe here a heuristic rule for Volterra kernels selection to be used during the MAP symbol detection. In section IV, we deeply investigate the benefits of FTN transmission versus Nyquist in the saturation regime. It will be shown that FTN signaling can be applied enabling a better spectral efficiency
with no complexity increase. A new method is proposed for transponder operation considering FTN as a new degree of freedom allowing a transmission rate maximization of the communications.
II. FASTER-THAN-NYQUIT SYSTEM AND NOTATIONS Before faster-than-Nyquist signaling, the binary data u ∈ FK2 is encoded into a codeword c ∈ FN2 using an error-correcting code of rate R = K/N , where F2is the binary field. In this paper, we consider low-density parity-check (LDPC) codes from the DVB-S2X standard. After data interleaving, the interleaved binary coded message is mapped into complex symbols ak, k = 1 · · · Ns thanks to M -ary phase shift keying (PSK) modulations (resp. M − ary amplitude-phase shift key-ing (APSK) modulations) with a Gray mappkey-ing (resp quasi-Gray mapping). Then, the symbols akare sent with accelerated symbol rate Rs=T1
s =
1
αT using a root raised cosine (RRC) pulse shaping filter h(t) which is T -orthogonal. In this case, the Nyquist criterion is no longer verified. α ∈ [0, 1] denotes the compression factor of the FTN transmission. The emitted signal is then given by
x(t) =X k
akh(t − kαT ) (1) In the linear regime, the signal is only affected by an additive white Gaussian noise (AWGN) w(t) with Power Spectral Density (PSD) Sw(f ) = N0. Even if the Nyquist criterion is not fulfilled, in order to maximize the signal-to-noise ratio (SNR) at the receiver, the signal is filtered with the matched filter hr(t) = h∗(−t), where (.)∗ denotes the complex conjugate. The received signal is then defined by
xr(t) = hr∗ x(t) + w0(t) (2) where ∗ denotes the convolution operator and w0(t) = hr∗ w(t) is the colored noise at the receiver.
In the remainder of this paper, g(t) = h ∗ hr(t) denotes the global filter. After sampling at rate Rs, the equivalent discrete channel response is given by gk = g(kαT ). The length of gk depends on the RRC filters’length. The noise is correlated, resulting in nc[k], a colored noise with auto-correlation Rnc[k] = N0gk. Finally, the discrete received signal can be expressed as
xk= X
j
ak−jgj+ nc[k] (3) We apply a trellis-based iterative maximum a posteriori (MAP) symbol detection [11] paired with an iterative LDPC decoding [12], enabling turbo-detection. The BCJR algorithm’s branch metric from state m0 to m, with Forney’s model [4] is
γt(m0, m) ∝ |xk− +L X
l=0
ak−lgl|2+ 2N0lnP (ak) (4) Where P (ak) is the symbol probability and L the truncated channel length. Apart from the channel truncation, this de-tector is not optimal for this scheme since the targeted high compression factor makes the whitening filter unfeasible. The
truncation of the equivalent discrete channel is required to avoid a prohibitive complexity for the MAP symbol imple-mentation. It is often noticed that the required channel length for correct estimation increases when the compression factor α or the RRC’s roll-off β decrease.
III. IMPACT OF THE SATELLITE PAYLOAD WHEN OPERATED NEAR SATURATION: VOLTERRA’S MODEL AND ASSOCIATED
MAPDETECTION
In order to increase the power efficiency in satellite com-munications, on-board amplification is operated closer and closer to the saturation regime. Then, growing non-linear interferences affect the transmission, hardly degrading the link capacity. FTN low modulation orders have reduced envelop fluctuations compared to asymptotic iso- spectral efficiency Nyquist higher modulation orders (for example, when con-sidering 8-PSK compared to a 16-APSK) [3]. For a fixed IBO, the FTN’s non-linear distortions are lower than those of Nyquist.
Finally, the remaining question is as follows: Is FTN, with its inherent ISI defined in Section II, still more interesting in terms of MAP detection than the Nyquist scheme when non-linear equalization of non-non-linear distortions is considered? In this section, we first review the satellite’s payload (IMUX-HPA-OMUX). Secondly, we briefly present the Volterra series based model often used for non-linearity MAP detection in the Nyquist context. Finally, the model is extended to the FTN transmissions, comparing the number of kernels necessary for accurate ISI estimation.
A. The wideband satellite’s payload
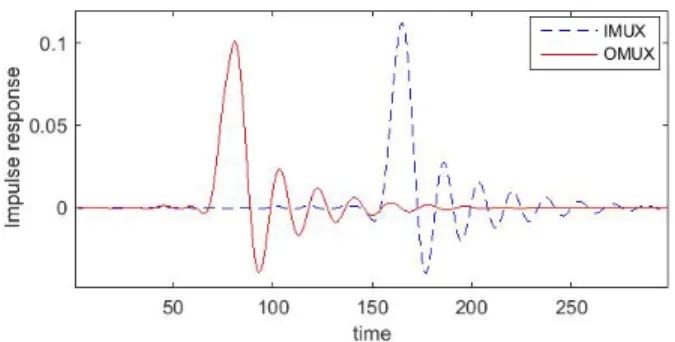
The payload decrisbed here is transparent and can be seen as a repeater. To tackle intermodulation distortion between the different carriers while allowing for a more efficient amplification, the total bandwidth of the transmission is split into several sub-bands by a set of band-pass filters, the input multiplexer (IMUX). After filtering, the different sub-signals are amplified through different transponders with high power amplifiers (HPA), introducing non-linear distortions when op-erated near the saturation regime. Finally, the amplified sub-carriers from a group of transponders are recombined in the output multiplexer (OMUX) filter. The combined signal is then sent on the downlink.
Since we only consider a single-carrier transmission here, IMUX and OMUX can be studied as filters sideways the HPA. Figure 1 illustrates some possible IMUX and OMUX impulse responses.
The amplifier is commonly a traveling wave tube amplifier (TWTA) or a solidstate power amplifier (SSPA). The AM/AM characteristic of the HPA considered in this work is given in Figure 2. The two cursors highlight the 1dB compression point. Above this IBO, the amplification is not considered linear anymore. The non-linearity robustness will be studied in the range of IBO=[−9dB to 0dB]
Fig. 1. IMUX / OMUX impulse responses
Fig. 2. HPA output back-off (OBO) function of the input back-off (IBO)
B. Volterra Series for non-linearity modelization
In this paragraph, we briefly review the well-known Volterra model considering a Nyquist transmission. Benedetto et. al proposed a Volterra’s series based decomposition of the non-linear amplification [7]. The bandpass nature of transmission implies that only odd terms are considered:
|y| =X k
γ2k+1|x|2k+1, (5) where x and y are respectively the signals at the HPA input and output and γ2k+1are the Volterra decomposition’s coefficients. Then, the non-linear channel can be modelled with both linear and non-linear terms. According to [9], considering a Volterra model truncated to a 3rd order, the received signal, ˜xk, for a Nyquist transmission can be written as
˜ xk = X l ak−lKl+ X m X n X p ak−mak−na∗k−pKm,n,p, (6)
where Kl and Km,n,p represent respectively the 1st and 3rd order Volterra kernels. This model is used for the trellis based MAP detection described in Section II. The usual trellis is computed with the truncated linear channel part Pl=LP
l=−LNak−lKl of length L = LN + LP + 1, where LN
and LP are the anti-causal and causal 1st order kernels. The non-linear part, with truncated length L, is added in the trellis definition. Considering the new channel model from (6) the new branch metric is given by:
γt(m0, m) ∝ |xk− ˜xk|2+ 2N0lnP (ak) (7) where xk is the noisy sampled received signal at the receiver. For L 1st order Kernels, the Volterra serie has L3 3rd order kernels.
C. FTN versus Nyquist non-linearity modeling, kernels be-haviour
Volterra kernels for FTN signaling can be computed in the same manner as for Nyquist scheme. The FTN inherent ISI is taken into account in the 1storder kernels and impacts directly the 3rd order kernels distribution. Figure 3 and 4 compare the 1st order and 3rd order Volterra kernels resulting from FTN (α=0,7) and Nyquist signaling for IBO=2dB/6dB.
Fig. 3. Normalized 1stOrder kernels Nyquist and FTN (α=0.7) β=0.1 -IBO=2dB/6dB
First, it can be noted that for both FTN and Nyquist signaling, the set of 1st order Volterra kernels has the same number of significant taps (Figure 3). Consequently, the overall MAP decoding complexity is similar for both cases. Second, it can be observed that the channel is not symmetric. This is due to the non-symmetric impulse responses of the IMUX/OMUX filters. In the remainder of this paper, when channel truncation is considered, we will take into account only one non-causal term and the remaining memory will be allocated to causal kernels. Note also that the 1stkernels of both signaling do not depend on the IBO. In Figure 4, we only kept kernels with a module higher than 5% of K0. As can be seen in Figure 4, the distribution of 3rd order Volterra kernels does not depend on the IBO, but their amplitude does, contrary to the 1st order kernels. Indeed, when operating the payload at a decreased IBO, the contibution of 3rd order kernels is increased, re-flecting an increased non-linear distortion. The number of 3rd order kernels to take into account (|Km,n,p| > 0.01. |K0| ) is increased when decreasing the IBO.
In the following, the impact of different parameters on the linear and non-linear ISI estimation when considering the Volterra series model is being discussed.
Fig. 4. Normalized 3rdOrder kernels Nyquist and FTN (α=0.7) β=0.1 -IBO=6dB (a) and IBO=2dB (b)
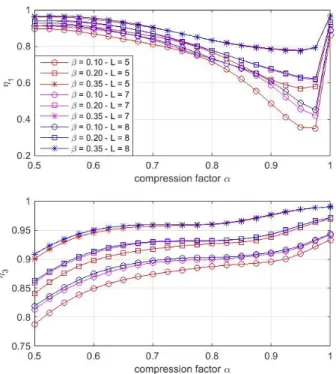
First, let η1 and η3 denote the ratios of the truncated 1st and 3rd order kernels. Then η
1 and η3 can be expressed as: η1= Pl=L−1 l=−1 |Kl| 2 P l,l6=0|Kl| 2 , l 6= 0 (8) η3= Pm,n,p=L−1 m,n,p=−1 |Kmnp| 2 P m,n,p,(m,n,p)|Kmnp| 2 (9)
The evolution of these ratios as a function of the channel length L, the compression factor α and the roll-off β has been investigated. Simulation results are reported in Figure 5. Many preliminary conclusions can be drawn:
• The higher the RRC filters’ roll-off, the better the ISI 1st and 3rd order estimation for a given memory. This result is obvious since a filter with a tighter rejection band has a lower robustness against ISI introduction.
The impact of compression factor α is more intricate, 1st order and 3rd orders have different behaviours:
• The highest value of η1 is reached for α=1, when the Nyquist criterion is fulfilled. For low compression factor, the 1st order ISI estimation is highly impacted since the centered kernels around K0are not sufficiently significant compared to distant kernels. When the compression factor is increased, the ISI power tends to be centered and the estimation performance is increased for our truncated model.
• The 3rdorder ISI estimation is better for Nyquist signal-ing than FTN signalsignal-ing. The ratio η3decreases smoothly when the compression is increased (i.e. α decreases), this behavior is understandable since the kernels far from K000 are more and more significant.
D. Impact ofα and β on the MAP detection based on Volterra series for Nyquist and FTN transmissions
The aim of this section is to identify the FTN parameters selection that offers the best MAP detection performance,
Fig. 5. η1(1) and η3 (2) function of the compression factor α for different
roll-offs β and channel length L
taking into account the amplifier operating point. We first focus on a quaternary PSK (QPSK) compressed signals and the rules will be extended to 8-PSK since the complex envelop is the same for these two modulations. In order to evaluate the asymptotic performance for different FTN configurations, the achievable spectral efficiency is evaluated based on EXIT (extrinsic information transfer) charts analysis and computa-tions [18]. To this end, the achievable coding rate is first evaluated using the area theorem (area under the obained EXIT curve). Even if the area theorem is only proved for the binary erasure channel, it can provide a good approximation for other type of channels. The area under EXIT curves gives the highest achievable coding rate suitable for the iterative detection. Then, the achievable spectral efficiency is deduced as a function of the SNR [19].
The achievable spectral efficiency is computed for several FTN configurations, i.e. with different [M, α, β], where M is the modulation order. The SNR is defined as the ratio of the power spectral density (PSD) of the emitted signal for a fixed bandwidth B = (1 + α)T and the noise PSD N0 in B.
Figure 6 represents the achievable spectral efficiencies of one FTN configuration, [M = 4, α = 0.70, β = 0.1], with different IBO. The kernels behavior depicted previously is ver-ified. Decreasing the IBO increases the channel selectivity and therefore the 3rd order kernels magnitude, which decreases the MAP detection efficicency. When compared to the linear channel, the maximal achievable spectral efficiency for IBO = 4dB is decreased of 0.4 bit/s/Hz. The loss is significant and other transmission parameters may offer higher capacity.
Fig. 6. Achievable Spectral Efficiency - Impact of IBO reduction on FTN ModCods - L = 7
amplifier at a fixed IBO, is the highest capacity reached by the configuration [M, α, β] with the highest theoretical spectral efficiency ? The answer is no, as illustrated in Figure 7. Considering that an increased compression increases the modulus of the complex envelop, the non-linear distortion is increased and the associated MAP detection efficiency is degraded. The detector behavior is the same for a lower roll-off, which implies an increased complex envelop. For example, the parameters [M = 4, α = 0.60, β = 0.1] offer a higher achievable spectral efficiency than the configuration [M = 4, α = 0.70, β = 0.1] in the linear context. But in the saturation regime with the non-linear distortion, the trend is different, as depicted in Figure 7.
Fig. 7. Achievable Spectral Efficiency of different FTN ModCods - Linear and IBO = 4.5dB - L = 7
It can be concluded from this section that different IBO require different optimal configurations to acheive the highest channel spectral efficiency. Considering FTN signaling allows for an optimization of the payload, namely when used in the saturation regime. The following section gives different insights concerning the benefits of compression when Volterra based MAP detection of the non-linear channel is performed at the receiver.
IV. FTN VSNYQUISTSIGNALING IN SATURATION REGIME In this section, a new method based on the asymptotic achievable spectral efficiency to select FTN modulation and
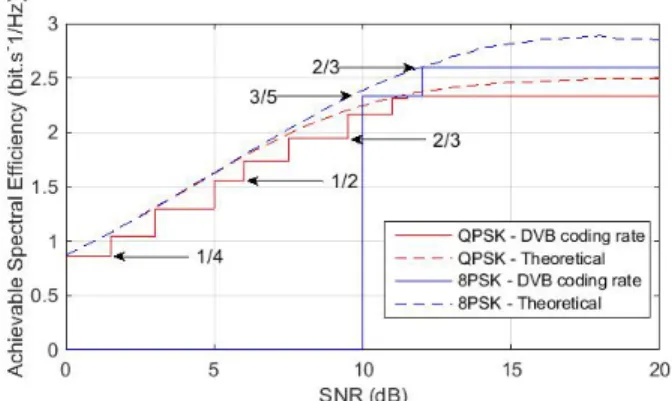
coding scheme parameters taking into account the operating point of the payload is proposed. To this end, the optimal signaling parameters [M, α, β] are first defined for different IBO. Once the best scheme for each IBO has been selected, a comparison is suggested taking into account the impact of the associated output back-off (OBO) in the required signal-to-noise ratio (SNR). Finally, we show several gains obtained thanks to FTN for different SNR ranges. For fair comparison between FTN and usual signaling, an additionnal constraint on coding rates from DVB-S2X ModCods is considered (QPSK : 1/4, 1/3, 2/5, 1/2, 3/5, 2/3, 3/4, 5/6, 8/9, 9/10 and 8PSK : 3/5, 2/3, 3/4, 5/6, 8/9, 9/10). The achievable rates are not continuous smooth curves anymore but stairstep curves as illustrated in Figure 8.
Fig. 8. Achievable Spectral Efficiency of FTN configuration including DVB-S2X coding rates - IBO = 4.5dB
A. [M, α, β] optimization for a fixed IBO
As a starting point, for different IBO, the achievable spectral efficiency is estimated for each parameters [M, α, β]. When merging the different results, the optimization requires to switch on different configurations [M, α, β] as a function of the SNR. For each IBO, we define the optimized achievable rate (OAR) highlighted in Figure 9 and Figure 10. Note that only relevant FTN configurations are reported in the figures to avoid clutter.
First, it can be noted that the most efficient FTN configura-tion depends on the SNR and the IBO of the transmission. For example, the OAR of IBO=3.5dB in the range of SNR 9dB-11.5dB is reached for [M = 4, α = 0.7, β = 0.2] whereas in the same range of SNR, the OAR of IBO=4.5dB is obtained thanks to the changeover between [M = 4, α = 0.7, β = 0.1] and [M = 8, α = 0.8, β = 0.1]. When the input back-off is increased, the OAR is reached by FTN configurations with higher PAPR. In Figure 9 and 10, we observe that an achievable rate of 1.2 bit.s−1/Hz is reached with a gap of 1.5dB between IBO 3.5dB and 4.5dB. The higher the IBO, the lower the required SNR on the downlink (for a given achievable rate).
The OAR defined in this part gives to the satellite operator the best FTN configuration when the payload’s IBO is forced by the environment. Now, naturally, we can ask: what can be
Fig. 9. Achievable Spectral Efficiency of different FTN ModCods with DVB coding rates - IBO = 3.5dB - L = 7 (QPSK)
Fig. 10. Achievable Spectral Efficiency of different FTN ModCods with DVB coding rates - IBO = 4.5dB - L = 7 (QPSK) and L = 5 (8PSK)
done when the IBO can be selected? This is the issue we deal with in the next part.
B. Optimal parameters for the payload operation with FTN MAP Volterra based detection
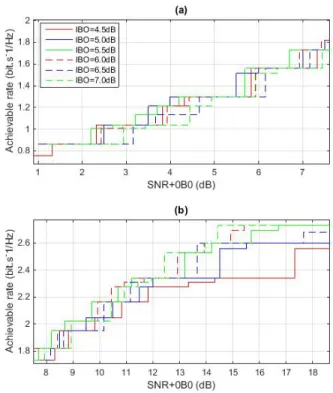
The OAR of FTN signaling is computed for IBO=3.5dB to 9dB with a step of 0.5dB. When analyzing the raw data, the higher the IBO, the better the performance. This conclusion is not fair since the OBO of the different schemes is not taken into account. We suggest to feed back the OBO on the SNR of the downlink on the achievable spectral efficiency curves. This way, we include the trade-off between non-linear distortion decrease and global SNR decrease the satellite operator has to deal with. Figure 11 gives the OAR offered by the different most relevant IBO with FTN signaling. The trend for the transmission optimization is to operate the satellite with lower input back-off when having low SNR on the downlink. In contrast, a higher SNR allows a higher IBO, offering higher achievable spectral efficiencies for the user.
C. Results
As the achievable rate performed by FTN schemes was depicted when considering Volterra based MAP detection in Figure 11, the same was done for Nyquist signaling. The use of higher modulation orders such as 16-APSK is not investigated. The MAP detection is indeed trellis based and its required truncation for complexity feasibility leads to poor performance. Figure 12 shows the benefits of allowing FTN signaling when operating the payload in the saturation regime, highlighting gains all over the SNR range studied.
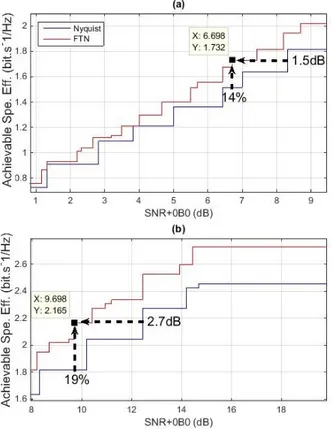
Fig. 11. Achievable Spectral Efficiency of optimized FTN schemes for different IBO for low SNR (a) and high SNR (b)
All along the studied range of SNR, FTN signaling allows a new degree of freedom and offers significant gains when compared to Nyquist signaling, both equalized with a MAP Volterra based detection. The gain in terms of spectral ef-ficiency is illustrated by the vertical gaps between the two curves. The average gain from 0 to 20dB is 10.5% with no complexity increase. In the same way, the horizontal gaps draw attention on the noise robustness gains. Many operating points of the FTN curve reflect significant gains. The cursors on Figure 12 highlight two operating points translating in the same time vertical and horizontal gains. The first one (Figure 12 (a)) is obtained thanks to the configuration [M = 4, α = 0.7, β = 0.1] with a coding rate 2/3 and IBO=5.5dB. The second one (Figure 12 (b)) is obtained through the configuration [M = 4, α = 0.7, β = 0.1] with a coding rate 5/6 and IBO=5.5dB. The Bit Error Rate curves (Figure 13 and Figure 14) show the benefits in terms of noise robustness of the two operating points.
V. CONCLUSION
In this paper, the gains offered by FTN signaling in the saturation regime when the receiver implements Volterra based MAP detection was investigated. Increasing signaling rate at the emitter, between 10% and 20% increase of spectral efficiency can be obtained with no complexity increase at the receiver. In light of obtained results, faster than Nyquist signaling appears as a strong candidate for the future standards considering wideband satellite transmission in the saturation
regime. In further studies, FTN signaling with MAP Volterra detection will be paired with pre-distorsion at the transmitter, allowing a balanced complexity increase between the emitter and the receiver.
Fig. 12. Achievable Spectral Efficiency of optimized FTN and Nyquist signaling for low SNR (a) and high SNR (b)
Fig. 13. Bit Error Rate Vs SNR+OBO of FTN signaling (a) and Nyquist signaling (b) - No iteration / 1st iteration / 3rd iteration and 5th iteration
REFERENCES
[1] J.E. Mazo, ”Faster than Nyquist Signaling”Bell Syst. Tech. J., vol. 54, pp, 1451-1462, Oct. 1975.
[2] A. D. Liveris, C. N. Georghiades, ”Exploiting Faster-Than-Nyquist Sig-naling”IEEE Transactions on Communications, Vol. 51, No. 9, Sept. 2003 [3] J.A. Lucciardi, N. Thomas, M.L. Boucheret, C. Poulliat, G. Mesnager ”Trade-Off Between Spectral Efficiency Increase and PAPR Reduction When Using FTN Signaling: Impact Of Non Linearities”IEEE Interna-tional Conference on Communications (ICC), 2016
Fig. 14. Bit Error Rate Vs SNR+OBO of FTN signaling (a) and Nyquist signaling (b) - No iteration / 1st iteration / 3rd iteration and 5th iteration
[4] G. David Forney, ”Maximum-Likelihood Sequence Estimation of Digital Sequences in the Presence of Intersymbol Interference ”, IEEE Transac-tions on Information Theory, vol. IT-18, No. 3, May 1972
[5] G. Ungerboeck, ”Adaptive Maximum-Likelihood Receiver for Carrier-Modulated Data-Transmission Systems”, IEEE Transactions on Commu-nications, vol. COM-22, No. 5, May 1974
[6] F. Rusek and J. B. Anderson, ”Constrained capacities for faster than Nyquist signaling”, IEEE Trans. Inf. Theory, vol. 55, no. 2, pp. 764-775, Feb. 2009.
[7] S. Benedetto, E. Biglieri, and R. Daffara, Modeling and performance evaluation of nonlinear satellite links-a volterra series approach, IEEE Transactions on Aerospace and Electronic Systems, vol. AES-15, no. 4, pp. 494 507, july 1979
[8] . G. Colavolpe, A. Piemontese, ”Novel SISO Detection Algorithms for Nonlinear Satellite Channels”, IEEE Wireless Cmmunications Letters, Feb. 2012.
[9] B. Benammar, N. Thomas, M.L. Boucheret, C. Poulliat, M. Dervin ”A comparison of iterative receivers for the non linear satellite chan-nel”IEEE 16th International Workshop on Signal Processing Advances in Wireless Communications (SPAWC), 2015
[10] N. Pham, J. B. Anderson, F. Rusek and J. M. Freixe , ”Exploring Faster-than-Nyquist for Satellite Direct Broadcasting”, 31st AIAA International Communications Satellite Systems Conference, 2013
[11] L. R. Bahl, J. Cocke, F. Jelinek, and J. Raviv , ”Optimal Decoding of Linear Codes for Minimizing Symbol Error Rate”, IEEE Transactions on Information Theory, March 1974
[12] W. Ryan and S. Lin, ”Channel Codes : Classical and Modern”, September 2009, Cambridge University Press
[13] A. Ugolini, A. Modenini, G. Colavolpe, ”Advanced Techniques for Spectrally Efficient DVB-S2X Systems ”, 7th Advanced Satellite Mul-timedia Systems Conference and the 13th Signal Processing for Space Communications Workshop (ASMS/SPSC), 2014
[14] C. Le, M. Schellmann, M. Fuhrwerk and J. Peissig , ”On the Practical Benefits of Faster-than-Nyquist Signaling”, Advanced Technologies for Communications (ATC), 2014
[15] Adel A. M. Saleh, ”Frequency-Independent and Frequency-Dependent Nonlinear Models of TWT Amplifiers”, IEEE Transactions on Communi-cations, vol. com-29, No. 11, Nov. 1981
[16] G. Colavolpe and A. Barbieri, ”On MAP Symbol Detection for ISI Chan-nels Using the Ungerboeck Observation Model”, IEEE Communications Letters, Vol. 9, No. 8, Aug. 2005
[17] F. Rusek, M. Loncar and A. Prlja, ”A Comparison of Ungerboeck and Forney Models for Reduced-Complexity ISI Equalization”, IEEE Global Telecommunications Conference, 2007
[18] Stephan Ten Brink, ”Convergence Behavior of Iteratively Decoded Parallel Concatenated Codes”, IEEE Transactions On Communications, vol. 49, No. 10, October 2001
[19] Alexei Ashikhmin, Gerhard Kramer and Stephan ten Brink, ”Extrinsic Information Transfer Functions: Model and Erasure Channel Properties” IEEE Transactions On Information Theory, vol. 50, No. 11, November 2004