To link to this article : DOI : 10.1016/j.polymdegradstab.2015.11.015
URL :
http://dx.doi.org/10.1016/j.polymdegradstab.2015.11.015
O
pen
A
rchive
T
OULOUSE
A
rchive
O
uverte (
OATAO
)
OATAO is an open access repository that collects the work of Toulouse researchers and
makes it freely available over the web where possible.
This is an author-deposited version published in :
http://oatao.univ-toulouse.fr/
Eprints ID : 15715
To cite this version :
Rivière, Lisa and Causse, Nicolas and Lonjon,
Antoine and Dantras, Eric and Lacabanne, Colette Specific heat
capacity and thermal conductivity of PEEK/Ag nanoparticles
composites determined by Modulated-Temperature Differential
Scanning Calorimetry. (2016) Polymer Degradation and Stability,
vol. 127. pp. 98-104. ISSN 0141-3910
Any correspondence concerning this service should be sent to the repository
administrator:
[email protected]
Specific heat capacity and thermal conductivity of PEEK/Ag
nanoparticles composites determined by Modulated-Temperature
Differential Scanning Calorimetry
Lisa Rivi!
ere, Nicolas Causs"
e
1, Antoine Lonjon, "
Eric Dantras
*, Colette Lacabanne
Physique des Polym!eres, Institut Carnot CIRIMAT, UMR 5085 CNRS, Universit"e Paul Sabatier, 118 route de Narbonne, 31062 Toulouse Cedex 09, France
Keywords:
Thermal conductivity Specific heat capacity Composite PEEK Silver
Electrical percolation
a b s t r a c t
The thermal conductivity accurate measurement of polymer based composites is a challenge: it would allow us to understand the mechanisms of thermal transport in such materials. Silver nanoparticles were introduced in Polyetheretherketone matrix and their influence on thermal properties was studied. Thermal conductivity and specific heat capacity of composites were determined by Modulated-Temperature Differential Scanning Calorimetry and analysed as a function of particles volume content and temperature. The specific heat capacity of the composites decreases with increasing silver particles content below the electrical percolation threshold. Above the electrical percolation threshold the specific heat capacity decreases more slowly and converge toward the specific heat capacity of compressed silver nanoparticles. The evolution of the thermal conductivity with filler content exhibits a non-linear profile. Experimental data are coherent with the Maxwell model suggesting continuity of the polymer matrix and a contribution of the silver particles to the effective thermal conductivity greater than volume effect. The temperature dependence of the composites thermal conductivity is characteristic of amorphous phase, while a transition from vitreous-like to crystalline-like behaviour of the specific heat capacity is observed with the introduction of metallic particles.
1. Introduction
The development of polymer based composites has heightened the need for the multi-scale understanding of their properties. The increasing use of these materials for weight saving purpose, has led to the optimisation of filler content in order to enhance thermal and electrical properties while maintaining good mechanical proper-ties. Mechanical and electrical properties have been extensively studied whereas thermal properties like thermal conductivity and specific heat capacity are less investigated.
The electrical conductivity mechanisms and their dependence on particle content in polymer based composites is well under-stood. We observe a sharp transition from insulating to conductive material through a percolation phenomenon as the filler content
increases. Above the percolation threshold, the electrical conduc-tivity can be modelled by a power law that accounts for the parti-cles aspect ratio and system dimensionality[1e3].
In this context, it appears interesting to compare thermal properties with electrical conductivity in order to identify possible characteristic behaviour of these properties as a function of filler content. The challenge relies on the identification of the mecha-nisms involved, and their contribution to the composite thermal properties. Filler chemical nature, filler content, aspect ratio, polymer physical structure, polymer/particles interactions and in-terfaces are parameters to be taken into account.
It has been shown that the introduction of conductive filler in the polymer matrix improves thermal conductivity [4,5]. In particular, carbon nanotubes[6,7]have been extensively studied for their high thermal conductivity, in various polymer matrices like polymethylmethacrylate [8], polyethylene [9] or polyvinyl-chloride [10]. Few studies have been devoted to polymer/metal composites for thermal properties improvement[4,11,12]. Never-theless, high level of electrical conductivity can be reached for low filler content with the use of high aspect ratio metallic particles in thermoplastic polymers[13e15].
* Corresponding author.
E-mail addresses: [email protected] (N. Causs"e),
[email protected]("E. Dantras).
1 Present address: CIRIMAT e ENSIACET, 4 all"ees "Emile Monso-BP44362, 31030
Toulouse Cedex 4, France.
Some models have been proposed to describe thermal con-ductivity dependence on filler content[16e18]for various particles shapes, including percolation theory[8,19e21], but experimental studies show some discrepancies between measured data and predictions[22e24]. In addition, the variability of measurement techniques and experimental conditions prevents a real consensus. The composite specific heat capacity can be expressed as the con-stituents specific heat capacities weighted average. Some studies confirm experimentally this model [25,26] and others report a change of behaviour for electrically conductive composites[27,28]. The correlation between the formation of an electrically conductive pathway and the specific heat capacity variation with filler content has not been demonstrated.
Silver nanoparticles were introduced in Polyetheretherketone matrix and their influence on thermal properties was studied. Thermal conductivity and specific heat capacity of composites were determined by Modulated-Temperature Differential Scanning Calorimetry. The thermal conductivity and specific heat capacity dependences on particle volume fraction have been studied and compared with the electrical conductivity evolution in the elec-trical percolation threshold region.
2. Materials and methods
2.1. Rough materials
Polyetheretherketone (PEEK) is a high-performance thermo-plastic of the polyaryletherketones (PAEK) family. It is a semi-crystalline linear polymer with aromatic structure that exhibits high thermal stability, chemical resistance and mechanical prop-erties. Its high glass transition temperature (Tg ¼ 140 "C) and
melting point (Tm¼ 340"C) make this polymer suitable for
aero-nautical applications[29,30]. Its crystallinity is about 35%. The PEEK matrix selected for this study was the Vestakeep 2000PF from Evonik. This commercially available grade is in powder shape of 50
mm particle size.
Silver nanoparticles (AgNP) from Sigma Aldrich with particle size <100 nm and 99.5% purity, were used in this study to elaborate the PEEK/AgNP composites.
PEEK/AgNP composites were elaborated by melt blending. Silver nanoparticles were first dispersed in ethanol by means of ultrasonic stirring then added to PEEK powder and stirred again. The ethanol was removed from the mixture with a rotary vacuum evaporator and the powdered composite was hot pressed at 380"C for 15 min.
The obtained bulk material was then repeatedly cut in tiny pellets and pressed again (three to four times) until homogenization. Samples of compressed silver nanoparticles were elaborated with a hydraulic press under 0.4 GPa.
2.2. Volumic mass and Ag content determination
Volumic mass of composites
r
comp was determined using apycnometer and distilled water as filling liquid. The method[31] relies on the measurement of sample mass and volume, by means of successive weighting of empty pycnometer m1, sample in
pyc-nometer m2, sample in pycnometer filled with water m3, and
pyc-nometer filled with water m4. The composites volumic mass
expression is given by Eq(1).
rcomp¼ rwater# ðm2% m1Þ
ðm4% m1Þ % ðm3% m2Þ (1)
The quantity (m2%m1) corresponds to the sample mass and
(m4%m1)%(m3%m2)to the mass of water displaced by the sample.
The sample volume is equal to the mass of displaced water divided
by the water volumic mass
r
water. The apparent volumic mass of thecompressed AgNP sample was found at 8.3 g cm%3which
corre-spond to about 80% of the silver bulk density (10.50 g cm%3at 25"C
[32]). Volume fraction of silver nanoparticle, x, was deduced from Eq(2)with
r
PEEK¼ 1.32 g cm%3andr
Ag¼ 10.50 g cm%3, volumicmasses of PEEK and bulk silver respectively.
rcompo¼ ð1 % xÞrPEEKþ xrAg (2)
11 composites were elaborated with particles content varying from 1.3 vol% (9.5 wt%) to 27.3 vol% (74.9 wt%).
2.3. Electrical conductivity
A Novocontrol broadband dielectric spectrometer (with SI 1260 gain/phase analyzer) has been used to determine DC conductivity of insulating composites (Z > 10
U
). Dielectric experiments were carried out at 20"C in the frequency range 10%2Hze106 Hz. Indisordered materials, the real part
s
0(u) of the measured electricalconductivity is frequency dependant:
s0ðuÞ ¼ sDCþ Aus (3)
At 10%2Hz, the frequency dependant term Auscan be neglected
so the reported conductivity is considered equivalent to the DC conductivity.
s0!10%2Hz"zsDC (4)
The resistivity of conductive composites (Z < 10
U) was
measured with a Keithley 2420 source meter using the four wire configuration. The resistivity of compressed silver nanoparticles was also measured with this protocol.The samples were disks with a thickness of 500
mm and a
diameter of 20 mm, placed between two gold plated electrodes with a 10 mm diameter. The samples were previously coated with a thin layer of silver ink to reduce contact resistivity. Data are aver-aged electrical conductivity of three to five measurements for each samples.2.4. Modulated temperature differential scanning calorimetry
Modulated temperature differential scanning calorimetry (MT-DSC) relies on the analysis of the modulated heat flow response of a sample submitted to a modulated temperature program. This technique was introduced by Reading in the early 1990s[33], and enables to separate the in-phase and out-of-phase responses from the total modulated heat flow. The MT-DSC 2920 from TA Instru-ment has been used to measure specific heat capacity and thermal conductivity of PEEK/AgNP composites. Specific heat capacity Cp
measurement is possible in quasi-isothermal conditions from the in-phase heat flow. In the absence of any thermal event[34], it can be expressed as:
Cp¼ K:AAHF
T
(5)
With ATthe temperature modulation amplitude, AHFthe heat
flow amplitude, and K the calibration constant that takes into ac-count the thermal responses of the reference, pans and furnace [35].
We measured specific heat capacity of PEEK/AgNP composites from the five last of 20 min isotherms at 17"C, 32"C and 47"C.
Samples were flat disks encapsulated in aluminium pan of the same diameter. The modulation parameters were chosen to ensure uni-form and stationary heat transfer across the sample[36]. A 100 s
modulation period and 1"C modulation amplitude were used for
samples with a diameter of 6 mm, a thickness inferior to 500
mm
and masses between 10 mg and 30 mg. An empty sealed aluminium pan with mass matching that of sample pan was used as reference material. A sapphire disk of 26.4 mg was used as calibrant. Cali-bration runs were carried out at 27"C before and after eachmea-surement to determine the calibration constant K. With the same protocol, we also measured the specific heat capacity of com-pressed silver nanoparticles and bulk silver at 20"C, 30"C, 40"C,
50"C and 60"C. The presented results are averaged C
pof three to
five measurements for each sample.
The MT-DSC thermal conductivity can be obtained by the determination of a thick sample apparent heat capacity, in inten-tionally unfavourable experimental conditions. When applying a temperature modulation to a thick, non-encapsulated sample, we cannot consider that the whole sample follows the maximum variation, as it is supposed for a thin encapsulated sample. There is a temperature gradient through the sample which is the expression of finite thermal conductivity of the sample [37]. The apparent thermal conductivity
l
0is given by Eq(6).l0¼ 8eC
2
Cpmd2T
(6)
With C the apparent heat capacity of the thick sample, e its thickness, d its diameter and m its mass. Cpis the specific heat
ca-pacity of the sample and T the modulation period[38].
This value has to be corrected from heat losses through the thick sample lateral surface with the use of a Polystyrene calibrant of exactly the same size. The corrected thermal conductivity is then given by Eq(7)and Eq(8). l¼1 2 # l0% 2D þ ffiffiffiffiffiffiffiffiffiffiffiffiffiffiffiffiffiffiffiffiffiffiffiffiffiffiffiffi ! l2 0% 4Dl0 " r & (7) With D ¼qffiffiffiffiffiffiffiffiffiffiffiffiffiffiffiffiffil0;PSlPS% lPS (8)
where
l
0,PSis the measured thermal conductivity of the Polystyrene calibrant andl
PSthe thermal conductivity of the Polystyrene from the literature[39].Thermal conductivity of PEEK/AgNP composites at 17"C, 32"C
and 47"C were determined using the same modulation parameters
as for specific heat capacity measurements. The apparent heat ca-pacity, C, measurements were performed on right circular cylin-ders. The thicknesses varied from 2.9 mm to 3.8 mm and the diameter was 6.0 mm. The samples were placed into the furnace on aluminium disks (GoodFellow) with a 50
mm thickness and a
6.0 mm diameter. One of the disks was also used on the reference position. Each thermal conductivity measurement was corrected with a Polystyrene calibrant and the presented results are averages of three to five measurements. The thermal conductivity of Poly-styrene calibrant was measured in the same conditions than composites.3. Results and discussions
3.1. Electrical charge transport in composites
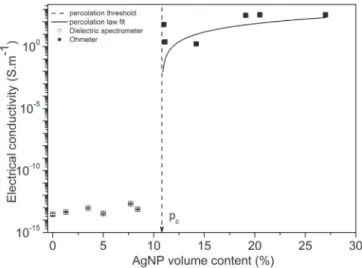
DC electrical conductivity of the composites as a function of AgNP volume content is displayed inFig. 1. We observe a sharp transition from insulating to conductive material due to percolation phenomenon.
Below a critical filler volume fraction pc, called the percolation
threshold, the metallic particles are isolated in a continuous insu-lating polymer matrix. The matrix contribution to the electrical conductivity of the composite is predominant and there is no contribution of the metallic particles. The measured electrical conductivity of PEEK is
s
PEEK¼ 2.9$10%14S m%1which is consistentwith literature that gives a volume resistivity
r
PEEK~1014U
m%1[40].
In this study, the experimental percolation threshold pc is
around 10.8 vol%. For non-overlapping spherical particles dispersed in a continuous matrix, the theoretical percolation threshold is predicted between 14% and 16% [3]. The experimental value is lower than the theoretical prediction and can be attributed to the formation of silver nanoparticles aggregates, called grapes[41], of higher apparent aspect ratio. It then can form conductive paths for a lower volume content. We can still consider a homogeneous dispersion of these aggregates. This reflects however, the difficulty to obtain an optimized dispersion of particles for filler volume content above 10%.
Above the percolation threshold, the electrical conductivity follows a power law.
s¼ s0ðp % p
cÞt (9)
In Eq(9),
s
0is the conductivity of the particles network, p the volume fraction of particles, pctheir volume fraction at theperco-lation threshold, and t the critical exponent which describes the system dimensionality. The parameters
s
0and t strongly depend on percolation pathway morphology. For 3D networks, t has to lie between 1.60 and 2.00. The best fit of our experimental data givest ¼ 1.98.
s
0 represents the electrical conductivity of the silver nanoparticles network. In our cases
0¼ 6.7$104S m%1, this value is in good agreement with the measured electrical conductivity of compressed silver nanoparticless
AgNP¼ 7.5$104S m%1and seems toaccurately represent the silver particles network conductivity above the percolation threshold. The maximum electrical conduc-tivity reached for composites beyond the percolation threshold is around
s
max¼ 3.6$102S m%1, this value is two decades lower thanthe electrical conductivity of compressed silver nanoparticles. This indicates that the connectivity of the system has not changed, i.e., particle aggregates are not in direct contact even for highly filled composites.
Fig. 1.Evolution of electrical conductivity with AgNP volume content at room tem-perature. Measurements with dielectric spectrometer (
▫
), measurements with ohmmeter (-), percolation law fit (ee), percolation threshold pc(——).3.2. Specific heat capacity of composites
The specific heat capacity of composites, PEEK, compressed silver nanoparticles and bulk silver was measured and are dis-played inTable 1.
The measured data are coherent with the literature and stan-dard deviations are low. It shows that polymers have higher specific heat capacity than crystals, because the glass has lower density than the crystal[43].
Specific heat capacities of PEEK/AgNP composites at 17"C are
represented onFig. 2as a function of silver nanoparticles weight content. We observe a decrease of the composite specific heat ca-pacity with AgNP content. This is associated to the low value of metallic particles heat capacity.
Bellow 49.5 wt%, the decrease of composite specific heat ca-pacity can be fitted by Eq(10). The specific heat capacity is actually equal to the weighted average Cp(w) of each constituent heat
ca-pacities in the case of an isotropic composite with constant pres-sure and volume (negligible thermal expansion) with no local strain or stress[44].
CpðwÞ ¼ wCp;Ag bulkþ ð1 % wÞCp;PEEK (10)
wis the weight fraction of silver particles, Cp,Ag bulkthe specific heat
capacity of bulk silver, and Cp,PEEKthe specific heat capacity of PEEK.
Boudenne et al. have also reported a good correlation between measured specific heat capacities and values predicted by weighted average, for polymer filled with metallic micro particles up to 45 vol %[26,45].
Above 49.5 wt%. Eq(10)no longer fits experimental data. The specific heat capacity decreases more slowly approaching the specific heat capacity of compressed silver nanoparticles (Table 1). This evolution of the specific heat capacity can be attributed to composite heterogeneity at high filler content. In highly filled composites, part of silver nanoparticles is well dispersed (up to 49.5 wt%), the rest is poorly dispersed and is comparable to com-pressed AgNP (regions with less polymer matrix). For spherical filler, the percolation threshold occurs at high filler content, above of which the heterogeneity may occur. These two phenomena are coincident but not related in terms of thermal transport.
To adjust the fitting for composites above 49.5 wt%, we modelled their structure by a continuous phase with an effective heat capacity Cp(wc)in which silver nanoparticles with a specific
heat capacity Cp,AgNP are dispersed. The conductive composites
specific heat capacity Cp’(w) was expressed as the weighted average
of Cp(wc)and Cp,AgNPas in Eq(11): C0pðwÞ ¼ðw % wcÞ ð1 % wcÞCp;AgNPþ ð1 % wÞ ð1 % wcÞCpðwcÞ (11)
In our case, Cp(wc)is the measured specific heat capacity for
wc¼ 49.5 wt% and equals 0.58 J g%1K%1. This mixture rule seems to
accurately describe the specific heat capacity of conductive composites.
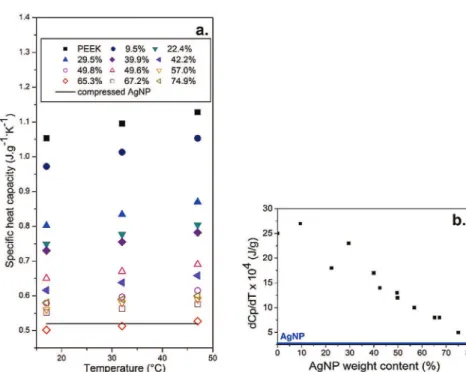
InFig. 3(a), is plotted the evolution of the composites specific heat capacity with temperature from 17"C to 48"C. Open symbols
represent electrically conductive composites and filled symbols
insulating ones.Fig. 3(b) shows the derivative of specific heat ca-pacity with respect to temperature as a function of AgNP content. Fig. 3(a) and (b) underline that the heat capacity increases with temperature for every composites. But, the temperature depen-dence of the heat capacity tends to become less significant as the AgNP content increases. The specific heat capacity of PEEK in-creases significantly with temperature and the measured specific heat capacity of compressed AgNP barely increases over this tem-perature range, as represented by the solid line in Fig. 3(a). In crystalline materials, the heat capacity reaches a plateau above ambient temperature following the Dulong and Petit empirical behaviour[46]. In glasses, the temperature dependence of the heat capacity is more pronounced because of the greater molecular mobility[47]. In our case, as the AgNP content increases, the heat capacity increases more slowly with temperature. This behaviour can be attributed to the increasing proportion of metallic phase providing the overall material an ordered-like behaviour for the highly loaded composites. The temperature influence on the spe-cific heat capacity highlights the contribution of the silver particles network to the composites specific heat capacity.
3.3. Thermal conductivity of the composites
We plotted onFig. 4the thermal conductivity of the composites as a function of silver nanoparticles volume content. We observe an increase with the introduction of silver nanoparticles up to 19.1 vol %. The measured thermal conductivity of PEEK is 0.26 W m%1K%1.
This value is consistent with the literature: Choy et al. found the PEEK thermal conductivity at 0.26 W m%1K%1measured by Laser Flash technique at 25 "C [48] and Diez-Pascual et al. at
0.22 W m%1 K%1 [29]. The maximum thermal conductivity is
reached for 19.1 vol% AgNP and equals 0.43 W m%1K%1 which represents a raise of 63%. Above 19.1 vol% AgNP, the thermal
Table 1
Specific heat capacity of PEEK at 17"C, compressed AgNP and bulk silver at 20"C measured by MT-DSC.
Measured Cp(J g%1K%1) Standard deviation (J g%1K%1) Cpfrom literature (J g%1K%1)
PEEK 1.05 0.03 1.09[42]
Compressed AgNP 0.49 0.06 e
Bulk Ag 0.24 0.01 0.235[32]
Fig. 2.Evolution of the specific heat capacity of the composites with silver nano-particles weight content at 17"C. Measured specific heat capacity (-), C
pPEEK(e ∙ ∙ e), CpAgNP(e ∙ e), mixture rule CpPEEK/CpAgbulk(ee), mixture rule Cp(wc)/CpAgNP(e e). pcis
conductivity decreases. This fall is associated with an evolution of the dispersion quality. For high volume content, the dispersion process is less efficient and aggregates are observed. The polymer/ particles interfaces are modified resulting in higher thermal resistances.
Most of the models used to predict thermal conductivity of two-phases composites are combinations of mixture rules taking into account phases relative content and morphologies. The series model describes thermal resistances in series configuration with respect to heat flow direction, and is represented by Eq(12):
1 lcomp¼ x lAgþ ð1 % xÞ lPEEK (12)
where
l
compis the thermal conductivity of the composite,l
PEEKis the thermal conductivity of PEEK,l
Agthat of bulk silver and x is the volume fraction of AgNP[17].The parallel model suggests co-continuous phases modelled by thermal resistances in parallel configuration with respect to heat flow direction[17], and can be expressed by Eq(13):
lcomp¼ lAgx þ lPEEKð1 % xÞ (13)
These two fundamental models are generally in good agreement with experimental data for layered or anisotropic composites depending if the heat flows perpendicular or parallel to the in-terfaces, but tend to either minimize or maximize the contribution of the dispersed phase in the case of an isotropic composite[17]. The series and parallel models are the lower and upper bounds of mixture rules respectively. Our experimental data lie between these bounds. The deviation from the series model suggests a contribution of the silver nanoparticles to the thermal conductivity greater than a volume effect.
The Maxwell model is tailored for composites composed of a dispersed and a continuous phase, and gives the following expression for the thermal conductivity in the case of dispersed silver particles in PEEK matrix[49]:
lcomp¼ lPEEK
lAgþ 2lPEEKþ 2x(lAg% lPEEK)
lAgþ 2lPEEKþ x(lPEEK% lAg) (14)
Our experimental data are in good correlation with the Maxwell model. It indicates that the polymer matrix is always continuous (except above 19.1 vol%), thus that particles distribution into the polymer matrix is satisfying. Nevertheless, there is no thermal manifestation of the electrical percolation, observed near 10.8 vol%. Similar results are observed in the literature. Mamunya et al. re-ported a monotonous increase of the thermal conductivity and no discontinuity in the electrical percolation threshold region in epoxy and PMMA matrixes filled with copper and nickel particles[4]. Huang et al. also observed a large increase of the thermal
Fig. 3.(a) Evolution of the composites specific heat capacity with temperature. AgNP weight content: 0% (-), 9.5% (C), 22.4% (;), 29.5% (
:
), 39.9% (A), 42.2% (=), 49.6% (▵
), 49.8% (B), 57.0% (7), 65.3% (◊), 67.2% (▫
), 74.9% (9); compressed AgNP is also represented (ee). (b) Derivative of specific heat capacity with respect to temperature as a function of AgNP weight content. Experimental data for composites (-) and for compressed silver nanoparticles (ee).Fig. 4.Evolution of the thermal conductivity of the composites with silver nano-particles volume content. Measured thermal conductivity at 17"C (-), Maxwell model
conductivity of Polyvinyldenefluoride/AgNP composites, under-estimated by the Effective Medium Approximation, while no elec-trical percolation was observed up to 20 vol% of AgNP[50]. The evolution of thermal conductivity as a function of AgNP content is not influenced by the electrical percolation pathway formation.
Fig. 5, represents the evolution of the composites thermal con-ductivity with temperature from 17"C to 48 "C. Open symbols
represent electrically conductive composites and filled symbols the insulating ones. We observe the same behaviour for both: the thermal conductivity increases slightly with the temperature. Classically, near room temperature, the temperature dependence of the thermal conductivity of a material is well known. For disor-dered solids and contrary to crystalline ones, the thermal conduc-tivity increases with temperature [46,51,52]. This phenomenological behaviour is strongly associated with phonon mean free path. Our results suggest the predominant influence of the polymer matrix on the composite thermal conductivity dependence with temperature. In this temperature range, the thermal conductivity behaviour is similar to the heat capacity one. 4. Conclusion
The introduction of metallic nanoparticles into an insulating matrix enables an interesting optimization of electrical and thermal conductivities. The electrical conductivity drastically increases above a critical particle content pc¼ 10.8 vol%, well described by a
percolation law. The electrical characterization of the composites gives insights about connectivity and phases morphology. The specific heat capacity of the composites decreases with increasing
particles content. This decrease is slower for conductive composites and their specific heat capacities converge toward the specific heat capacity of compressed silver nanoparticles. This behaviour has been attributed to the formation of heterogeneities above the electrical percolation threshold. The temperature dependence of the heat capacity decreases with the particles content. It indicates an evolution from glasses to an ordered-like behaviour for the highly loaded composites. Concerning the thermal conductivity, the discrepancy of our experimental data from the values predicted by the series model suggests a contribution of the silver particles to the effective thermal conductivity greater than a volume effect. A good agreement with the Maxwell model validates an isotropic distribution of silver particles into the polymer matrix up to 19.1 vol %. No manifestation of the electrical percolation phenomenon on the thermal conductivity is observed. The composites thermal conductivity increases with temperature as for glasses. The intro-duction of metallic particles does not induce any modification. Acknowledgements
This work was done in the framework of the MACOTHEC pro-gram and supported by BPI France and Conseil Regional Midi Pyr"en"ees.
References
[1] S. Kirkpatrick, Percolation and conduction, Rev. Mod. Phys. 45 (1973) 574e588,http://dx.doi.org/10.1103/RevModPhys.45.574.
[2] F. Lux, Models proposed to explain the electrical conductivity of mixtures made of conductive and insulating materials, J. Mater Sci. 28 (1993) 285e301,
http://dx.doi.org/10.1007/BF00357799.
[3] C.W. Nan, Physics of inhomogeneous inorganic materials, Prog. Mater Sci. 37 (1993) 1e116,http://dx.doi.org/10.1016/0079-6425(93)90004-5.
[4] Y.P. Mamunya, V.V. Davydenko, P. Pissis, E.V. Lebedev, Electrical and thermal conductivity of polymers filled with metal powders, Eur. Polym. J. 38 (2002) 1887e1897,http://dx.doi.org/10.1016/S0014-3057(02)00064-2.
[5] G.W. Lee, M. Park, J. Kim, J.I. Lee, H.G. Yoon, Enhanced thermal conductivity of polymer composites filled with hybrid filler, Compos Part A Appl. Sci. Manuf. 37 (2006) 727e734,http://dx.doi.org/10.1016/j.compositesa.2005.07.006. [6] F.H. Gojny, M.H.G. Wichmann, B. Fiedler, I.A. Kinloch, W. Bauhofer,
A.H. Windle, et al., Evaluation and identification of electrical and thermal conduction mechanisms in carbon nanotube/epoxy composites, Polym. Guildf. 47 (2006) 2036e2045,http://dx.doi.org/10.1016/j.polymer.2006.01.029. [7] Z. Han, A. Fina, Thermal conductivity of carbon nanotubes and their polymer
nanocomposites: a review, Prog. Polym. Sci. 36 (2011) 914e944, http:// dx.doi.org/10.1016/j.progpolymsci.2010.11.004.
[8] P. Bonnet, D. Sireude, B. Garnier, O. Chauvet, Thermal properties and perco-lation in carbon nanotube-polymer composites, Appl. Phys. Lett. 91 (2007) 201910,http://dx.doi.org/10.1063/1.2813625.
[9] R. Haggenmueller, C. Guthy, J.R. Lukes, J.E. Fischer, K.I. Winey, Single wall carbon nanotube/polyethylene nanocomposites: thermal and electrical con-ductivity, Macromolecules 40 (2007) 2417e2421,http://dx.doi.org/10.1021/ ma0615046.
[10] Y.P. Mamunya, A. Boudenne, N. Lebovka, L. Ibos, Y. Candau, M. Lisunova, Electrical and thermophysical behaviour of PVC-MWCNT nanocomposites, Compos Sci. Technol. 68 (2008) 1981e1988, http://dx.doi.org/10.1016/ j.compscitech.2007.11.014.
[11] K. Razeeb, E. Dalton, Nanowire-polymer nanocomposites as thermal interface material, in: Dr Reddy Borredy (Ed.), Adv. Nanocomposites - Synth. Charact. Ind. Appl., Vol. 1, Rijeka: in Tech, 2011, pp. 685e706.
[12] B. Weidenfeller, M. H€ofer, F.R. Schilling, Thermal conductivity, thermal diffusivity, and specific heat capacity of particle filled polypropylene, Compos Part A Appl. Sci. Manuf. 35 (2004) 423e429, http://dx.doi.org/10.1016/ j.compositesa.2003.11.005.
[13] A. Lonjon, I. Caffrey, D. Carponcin, E. Dantras, C. Lacabanne, High electrically conductive composites of Polyamide 11 filled with silver nanowires: nano-composites processing, mechanical and electrical analysis, J. Non Cryst. Solids 375 (2013) 199e204,http://dx.doi.org/10.1016/j.jnoncrysol.2013.05.020. [14] A. Lonjon, P. Demont, E. Dantras, C. Lacabanne, Low filled conductive
P(VDF-TrFE) composites: influence of silver particles aspect ratio on percolation threshold from spheres to nanowires, J. Non Cryst. Solids 358 (2012) 3074e3078,http://dx.doi.org/10.1016/j.jnoncrysol.2012.09.006.
[15] L. Quiroga Cortes, A. Lonjon, E. Dantras, C. Lacabanne, High-performance thermoplastic composites poly(ether ketone ketone)/silver nanowires: morphological, mechanical and electrical properties, J. Non Cryst. Solids 391 (2014) 106e111,http://dx.doi.org/10.1016/j.jnoncrysol.2014.03.016. [16] S. Torquato, Thermal conductivity of disordered heterogeneous media from Fig. 5.Evolution of the composite thermal conductivity with temperature. AgNP
volume content: 0% (-), 1.3% (C), 3.5% (;), 5% (
:
), 7.7% (A), 8.4% (=), 11% (▵
), 11.1% (B), 14.3% (7), 19.1% (◊), 20.5% (▫
), 27.3% (9).the microstructure, Rev. Chem. Eng. 1987 (4) (1987) 151,http://dx.doi.org/ 10.1515/REVCE, 4.3e4.151.
[17] D.M. Bigg, Thermal conductivity of heterophase polymer compositions, Adv. Polym. Sci. 119 (1995) 1e30,http://dx.doi.org/10.1007/BFb0021279. [18] C.-W. Nan, R. Birringer, D.R. Clarke, H. Gleiter, Effective thermal conductivity
of particulate composites with interfacial thermal resistance, J. Appl. Phys. 81 (1997) 6692,http://dx.doi.org/10.1063/1.365209.
[19] M. Foygel, R. Morris, D. Anez, S. French, V. Sobolev, Theoretical and compu-tational studies of carbon nanotube composites and suspensions: electrical and thermal conductivity, Phys. Rev. B 71 (2005) 104201,http://dx.doi.org/ 10.1103/PhysRevB.71.104201.
[20] S. Kumar, M.A. Alam, J.Y. Murthy, Effect of percolation on thermal transport in nanotube composites, Appl. Phys. Lett. 90 (2007) 104105,http://dx.doi.org/ 10.1063/1.2712428.
[21] S.Y. Kwon, I.M. Kwon, Y.G. Kim, S. Lee, Y.S. Seo, A large increase in the thermal conductivity of carbon nanotube/polymer composites produced by percola-tion phenomena, Carbon N. Y. 55 (2013) 285e290,http://dx.doi.org/10.1016/ j.carbon.2012.12.063.
[22] J. Koo, Y. Kang, C. Kleinstreuer, A nonlinear effective thermal conductivity model for carbon nanotube and nanofiber suspensions, Nanotechnology 19 (2008) 375705,http://dx.doi.org/10.1088/0957-4484/19/37/375705. [23] N. Shenogina, S. Shenogin, L. Xue, P. Keblinski, On the lack of thermal
percolation in carbon nanotube composites, Appl. Phys. Lett. 87 (2005) 1e3,
http://dx.doi.org/10.1063/1.2056591.
[24] S.U.S. Choi, Z.G. Zhang, W. Yu, F.E. Lockwood, E.A. Grulke, Anomalous thermal conductivity enhancement in nanotube suspensions, Appl. Phys. Lett. 79 (2001) 2252e2254,http://dx.doi.org/10.1063/1.1408272.
[25] A. Boudenne, Etude exp"erimentale et th"eorique des propri"et"es thermophy-siques de mat"eriaux composites !a matrice polym!ere, PhD. Paris XII Val de Marne, 2003.
[26] A. Boudenne, L. Ibos, M. Fois, J.C. Majest"e, E. G"ehin, Electrical and thermal behavior of polypropylene filled with copper particles, Compos Part A Appl. Sci. Manuf. 36 (2005) 1545e1554, http://dx.doi.org/10.1016/ j.compositesa.2005.02.005.
[27] M.Y. Razzaq, M. Anhalt, L. Frormann, B. Weidenfeller, Thermal, electrical and magnetic studies of magnetite filled polyurethane shape memory polymers, Mater Sci. Eng. A 444 (2007) 227e235, http://dx.doi.org/10.1016/ j.msea.2006.08.083.
[28] B. Weidenfeller, M. H€ofer, F. Schilling, Thermal and electrical properties of magnetite filled polymers, Compos Part A Appl. Sci. Manuf. 33 (2002) 1041e1053,http://dx.doi.org/10.1016/S1359-835X(02)00085-4.
[29] A.M. Díez-Pascual, M. Naffakh, C. Marco, G. Ellis, M.A. G"omez-Fatou, High-performance nanocomposites based on polyetherketones, Prog. Mater Sci. 57 (2012) 1106e1190,http://dx.doi.org/10.1016/j.pmatsci.2012.03.003. [30] J.C. Seferis, Polyetheretherketone (PEEK): processing-structure and properties
studies for a matrix in high performance composites, Polym. Compos 7 (1986) 158e169,http://dx.doi.org/10.1002/pc.750070305.
[31] N.A. Pratten, Review the precise measurement of the density of small samples, J. Mater Sci. 16 (1981) 1737e1747,http://dx.doi.org/10.1007/BF00540619. [32] D.R. Lide, CRC Handbook of Chemistry and Physics, CRC Press, 2003. [33] M. Reading, A. Luget, R. Wilson, Modulated differential scanning calorimetry,
Thermochim. Acta 238 (1994) 295e307, http://dx.doi.org/10.1016/S0040-6031(94)85215-4.
[34] A. Boller, Y. Jin, B. Wunderlich, Heat capacity measurement by modulated DSC at constant temperature, J. Therm. Anal. 42 (1994) 307e330,http://dx.doi.org/ 10.1007/BF02548519.
[35] B. Wunderlich, Thermal analysis of Polymeric Materials, 2005, http:// dx.doi.org/10.1007/b137476.
[36] L.C. Thomas, Measurement of Accurate Heat Capacity Values, TA Instruments, Modul DSC Pap #9, 2005, pp. 1e11.
[37] S.M. Marcus, R.L. Blaine, Thermal conductivity of polymers, glasses and ce-ramics by modulated DSC, Thermochim. Acta 243 (1994) 231e239,http:// dx.doi.org/10.1016/0040-6031(94)85058-5.
[38] R.L. Blaine, S.M. Marcus, Derivation of temperature-modulated DSC thermal conductivity equations, J. Therm. Anal. Calorim. 54 (1998) 467e476,http:// dx.doi.org/10.1023/A:1010178022559.
[39] U. Gaur, B. Wunderlich, Heat capacity and other thermodynamic properties of linear macromolecules. V. Polystyrene, J. Phys. Chem. Ref. Data 11 (1982) 313,
http://dx.doi.org/10.1063/1.555663.
[40] H.F. Mark, Encyclopedia of Polymer Science and Technology, third ed., Wiley Interscience, 2003.
[41] A.I. Medalia, Electrical conduction in carbon black composites, Rubber Chem. Technol. 59 (1986) 432e454,http://dx.doi.org/10.5254/1.3538209. [42] S.Z. Cheng, S. Lim, L.H. Judovits, B. Wunderlich, Heat capacities of high melting
polymers containing phenylene groups, Polym. Guildf. (1987), http:// dx.doi.org/10.1016/0032-3861(87)90313-2.
[43] A.I. Chumakov, G. Monaco, A. Fontana, A. Bosak, R.P. Hermann, D. Bessas, et al., Role of disorder in the thermodynamics and atomic dynamics of glasses, Phys. Rev. Lett. (2014), http://dx.doi.org/10.1103/PhysRevLett.112.025502, 112: 025502.
[44] B. Budiansky, Thermal and thermoelastic properties of isotropic composites, J. Compos Mater 4 (1970) 286e295, http://dx.doi.org/10.1177/ 002199837000400301.
[45] B. Agoudjil, A. Boudenne, I. Krupa, L. Ibos, J. Majeste, Propri"et"es thermophy-siques de composites polym!ere/charges isolantes m"etallis"ees. Congr!es Fran-çais Therm, SFT 3 (2007) 1e6. Les Embiez.
[46] C. Kittel, Introduction to Solid State Physics, third ed., Wiley, John, New York, 1967.
[47] B. Wunderlich, The heat capacity of polymers, Thermochim. Acta 300 (1997) 43e65,http://dx.doi.org/10.1016/S0040-6031(96)03126-7.
[48] C.L. Choy, K.W. Kwok, W.P. Leung, F.P. Lau, Thermal conductivity of poly(ether ether ketone) and its short-fiber composites, J. Polym. Sci. Part B Polym. Phys. 32 (1994) 1389e1397,http://dx.doi.org/10.1002/polb.1994.090320810. [49] J. Wang, J.K. Carson, M.F. North, D.J. Cleland, A new structural model of
effective thermal conductivity for heterogeneous materials with co-continuous phases, Int. J. Heat. Mass Transf. 51 (2008) 2389e2397,http:// dx.doi.org/10.1016/j.ijheatmasstransfer.2007.08.028.
[50] X. Huang, P. Jiang, L. Xie, Ferroelectric polymer/silver nanocomposites with high dielectric constant and high thermal conductivity, Appl. Phys. Lett. 95 (2009) 242901,http://dx.doi.org/10.1063/1.3273368.
[51] C.L. Choy, Thermal conductivity of polymers, Polym. Guildf. 18 (1977) 984e1004,http://dx.doi.org/10.1016/0032-3861(77)90002-7.
[52] R.C. Zeller, R.O. Pohl, Thermal conductivity and specific heat of noncrystalline solids, Phys. Rev. B 4 (1971) 2029e2041, http://dx.doi.org/10.1103/ PhysRevB.4.2029.