Recent Vegetation Dynamics and Hydrological Changes in Bogs Located in an
1Agricultural Landscape
2Stéphanie Pellerin1*, Martin Lavoie2, Arnaud Boucheny1, Marie Larocque3,4, Michelle 3
Garneau4,5,6 4
1
Institut de recherche en biologie végétale, Université de Montréal and Jardin botanique de 5
Montréal, Montréal, Qc, Canada. 6
2
Département de géographie and Centre d’études nordiques, Université Laval, Québec, Qc, 7
Canada 8
3
Département des sciences de la Terre et de l’atmosphère, Université du Québec à Montréal, 9
Montréal, Qc, Canada 10
4
GEOTOP – Geochemistry and Geodynamics Research Center, Université du Québec à 11
Montréal, Montréal, Qc, Canada 12
5
Département de géographie, Université du Québec à Montréal, Montréal, Qc, Canada 13
6
Chair on Peatland Ecosystems Dynamics and Climatic Change, Université du Québec à 14
Montréal, Montréal, Qc, Canada 15 16 *Corresponding author: 17 e-mail: [email protected] 18 phone: 514-872-2829 19 fax: 514-343-2288 20 21
Abstract 22
This study aims to reconstruct the recent dynamics of two bogs located in an agricultural 23
landscape and to determine which factors favour tree expansion, the most salient change recently 24
reported in treeless peatlands. The vegetation and hydrological dynamics of the bogs as well as 25
land use changes in the vicinity were reconstructed using a combination of paleoecological, 26
paleohydrological, and historical approaches. It was hypothesized that upland deforestation 27
indirectly induced atmospheric mineral dust deposition on sites, thus increasing nutrient 28
availability and triggering forest expansion. Results indicated that a widespread, but 29
asynchronous tree expansion occurred in both bogs during the 20th century. However, no 30
evidence suggesting that nutrient enrichment favoured the phenomenon was found. Forest 31
expansion seems rather to have been favoured by drying of the peat surface, as a decrease of the 32
water table depth coincided with the beginning of the forest encroachment on both sites. This 33
drying correlated with the establishment of an in situ artificial drainage ditch on one site and with 34
agricultural development in the catchment of the other. Local historical factors of each site 35
apparently override regional factors such as climate anomalies or upland deforestation in 36
explaining rapid, abrupt changes in bogs. 37
Keywords Human disturbance, Peatland, Plant macrofossil, Testate amoebae, Tree 38
encroachment, Vegetation shift 39
Introduction 41
Peatlands are wetlands formed through the accumulation of partially decayed organic material 42
(peat); they represent 50–70% of global wetland resources (Chapman et al. 2003). These 43
ecosystems are important for biodiversity conservation, climate regulation and human welfare. 44
For instance, owing to their peat accumulation processes, peatlands play an important role in the 45
global carbon (C) cycle, having accumulated approximately 600 GtC during the Holocene (Yu et 46
al. 2010). They also store fresh water and help regulate regional hydrologic fluxes (e.g., Levison 47
et al. 2014). Furthermore, they support specialized flora adapted to harsh prevailing conditions, 48
notably acidic and water logged soils. In temperate regions, their flora contrasts sharply with 49
surrounding environments and contributes to increased regional diversity (Ingerpuu et al. 2001). 50
The maintenance of the above functions and services is nevertheless threatened when peatland 51
plant communities are altered. With intensification of the human footprint on these ecosystems, 52
it becomes crucial to better understand the factors driving their compositional and structural 53
changes through time, in order to better protect them. 54
Increases in woody plant cover and density on historically treeless or sparsely treed sites is one 55
of the most drastic changes recently reported in ombrotrophic peatlands (bogs) of northern 56
Europe (Freléchoux et al. 2000; Linderholm and Lein 2004; Kapfer et al. 2011) and North 57
America (Pellerin and Lavoie 2003; Berg et al. 2009; Talbot et al. 2010; Ireland and Booth 2012; 58
Pasquet et al. 2015). Although the progression of bog communities from Sphagnum to tree 59
dominated has been considered as a natural stage of wetland succession (e.g., Mitsch and 60
Gosselink 1986), the results of recent studies indicate that direct and indirect anthropogenic 61
disturbances favour the current phenomenon. Indeed, human-induced drainage, eutrophication, 62
fire and contemporary climate change (warmer and/or drier climatic conditions) are the main 63
factors usually pinpointed to explain the present-day woody encroachment in bogs, through their 64
influence on water and nutrient availability (e.g., Frankl and Schmeidl 2000; Linderholm and 65
Leine 2004; Pellerin and Lavoie 2003; Berg et al. 2009; Pasquet et al. 2015). For example, using 66
paleoecological techniques, Ireland and Booth (2012) have shown that the shift from Sphagnum 67
to white pine (Pinus strobus) dominance on a floating kettle peatland in north-western 68
Pennsylvania (USA) coincided with enhanced nutrient availability due to an increase of mineral 69
dust deposition that concurred with upland deforestation by European settlers (ca. 1900). Using 70
similar techniques, Pellerin and Lavoie (2003) attributed the recent (20th century) tree expansion 71
(Pinus banksiana and Picea mariana) in bogs of southeastern Québec (Canada) to the impact of 72
combined fire and drainage disturbances associated with short dry climatic periods. In Europe, 73
the recent pinewood development on bogs in the Jura Mountains has also been linked to artificial 74
drainage and peat cutting (Freléchoux et al. 2000). 75
The aims of this study were 1) to reconstruct the recent dynamics of two bog zones located in a 76
large wetland complex in southern Québec (Canada), and 2) to determine which factors 77
influenced tree expansion on those sites. The vegetation and hydrological dynamics of the bogs 78
were reconstructed using a combination of paleoecological, paleohydrological, and historical 79
approaches. As the study sites are located in protected areas, and in accordance with Ireland and 80
Booth (2012), it is hypothesized that upland deforestation indirectly induced peat sediment 81
enrichment through an increase of atmospheric mineral dust deposition rich in nitrogen and 82
phosphorous, triggering forest expansion on the sites. 83
Methods 85
Study Area 86
The Lanoraie Wetland Complex is located 40 km northeast of Montréal, on the north shore of the 87
St. Lawrence River, southern Québec (Canada), and covers an area of 76 km2 (Fig. 1). Inherited 88
from the St. Lawrence River paleochannels, the complex lies over low-permeability clayey silts 89
of the Champlain Sea and is bordered by deltaic terrace sands (Rosa and Larocque 2008). 90
Organic accumulation began around 7400 cal BP (Comtois, 1982), and peat thickness ranges 91
between 0.3 and 8.4 m (Rosa et al. 2009; Tousignant et al. 2010). The complex is mainly 92
composed of forested fens dominated by Acer rubrum, Alnus incana subsp. rugosa and Ilex 93
verticillata. Scattered areas of bogs are also present, and dominated by Picea mariana, Larix
94
laricina, ericaceous shrubs (mostly Chamaedaphne calyculata, Kalmia angustifolia,
95
Rhododendron groenlandicum and Vaccinium angustifolium) and Sphagnum mosses (mostly
96
S. capillifolium, S. fallax and S. magellanicum). Swamps and riparian marshes occur along the
97
four rivers that run through the complex (Fig. 1). The complex is part of a vast hydrosystem 98
composed of five catchment areas where surface water and groundwater are intensively used for 99
drinking water purposes and irrigation (Bourgault et al. 2014). 100
European settlement in the region began around 1630 (Morneau et al. 2012). However, the 101
region remained sparsely populated until 1850, when agricultural activities began to increase. 102
Land clearance peaked around 1940-50 with the mechanization of drainage and agricultural 103
practices, and during this period, summer aeolian erosion events were frequent (Morneau et al. 104
2012). Today, less than 10% of the lands surrounding the complex are forested. The region has a 105
strong agricultural vocation with approximately 85% of the territory used for agriculture, mainly 106
fruit and vegetable production. 107
The lands surrounding the wetland complex have been transformed by human activities, and the 108
complex itself has also been highly disturbed, mainly in the forested swamps at its margins. 109
Since the beginning of European settlement, the complex has been used for wood gathering, 110
especially Thuja occidentalis trees, which were used for posts and fences (Tousignant et al. 111
2010). Over the last 100 years, approximately 28% of the complex’s area has been converted to 112
agricultural use or housing (Tardy and Pellerin 2006). Moreover, it is now partitioned by several 113
roads, highways, railroads and power line rights-of-way, while about 200 irrigation reservoirs 114
and drainage ditches have been built in and around it. According to a recent study of its present-115
day vegetation patterns (Tousignant et al. 2010), anthropogenic disturbances (agriculture, 116
drainage, logging, transportation infrastructures) had detrimental effects on the richness of 117
bryophyte and peatland species (i.e., species that occur always, preferably or frequently in 118
peatlands), but favoured grasses as well as non-peatland and exotic species diversity. In 1994, 119
approximately 4 km2 were set aside to ensure long-term protection, with the creation of the 120
Tourbières-de-Lanoraie Ecological Reserve by the Government of Québec (Fig. 1). Additional 121
areas have been protected since then by a local non-governmental conservation organization 122
(Fig. 1). 123
The regional climate is temperate and continental. The mean annual air temperature (1915–2010) 124
at the nearest meteorological station (Joliette; 15 km) is 5.5 °C, and varies from a minimum of 125
3.2 °C in 1926 to a maximum of 7.9 in 2010 (see Online resource 1 for complete climatic data). 126
Mean annual precipitation is about 910 mm (20% of which falls as snow), and varies from a 127
minimum of 567 mm (1953) to a maximum of 1346 mm (1981). The mean annual potential 128
evapotranspiration is 588 mm and varies from 528 mm (1926) to 642 mm (2010). Mean 129
temperature, total precipitation and potential evapotranspiration time series show a statistically 130
significant increase trend (Mann-Kendall test; p < 0.001). 131
Coring Sites and Peat Extraction 132
In 2010, two 1-meter long cores were collected using a Box corer (100 × 8 × 8 cm; Jeglum et al. 133
1992) in two protected ombrotrophic sectors of the complex (Fig. 1). Both cores were extracted 134
from a small hollow in a Sphagnum-dominated environment surrounded by a dense cover of 135
ericaceous shrubs and a semi-open forest canopy of Larix laricina and Picea mariana. Following 136
extraction, the sediments were wrapped in cellophane and aluminium foil for transport to the 137
laboratory, where they were stored at 4°C until analysis. 138
The Ecological Reserve coring site (ER; 45º59’26.5’’N, 73º18’00’’W) is located in the Point-du-139
Jour River catchment near the junction with the St. Joseph River catchment, and about 240 m 140
south of a railway constructed between 1847 and 1850, and abandoned in 1894. A large 141
(~1.5 m), deep (~2 m) artificial drainage ditch was dug in the southwestern part of the sector 142
(about 1000 m from the coring site) at the end of the 1960s (Fig. 1). The St. Jean coring site (SJ) 143
is located in the headwaters of the St. Jean River catchment (45º59’46.6’’N, 73º13’22.8’’W), and 144
about 30 m from an unpaved road and a large (~1.5 m), deep (~2 m) artificial drainage ditch dug 145
in the 1980s (Fig. 1). 146
Chronology 147
For each core, one sample (consisting of a few mg dry weight of bulk sediments) from 46 cm 148
(ER site) and 50 cm (SJ site) was submitted for accelerator mass spectrometry (AMS) 149
radiocarbon dating (Table 1). One sample was pre-treated and prepared at Laval University’s 150
14
C Laboratory and dated at the Keck-Carbon Cycle AMS facility (University of California, 151
Irvine). The other sample was dated at the Beta Analytic laboratory (Florida). The two 152
radiocarbon dates (14C yr BP) were calibrated (cal yr BC/AD) using the CALIB 6.0.1 program 153
(Stuiver and Reimer 1993) and the INTCAL09 dataset (Reimer et al. 2009). Calibrated dates 154
were rounded to the nearest 10 years using a 2-sigma cal age range. A 210Pb chronology was also 155
obtained for each core at 4 cm-intervals from the surface to 50 cm downcore. Measurements 156
were performed on an alpha-spectrometer at GEOTOP Research Center (Université du Québec à 157
Montréal, Montréal). For each level, a dry 0.5 g subsample was analyzed for 210Pb activity after 158
spiking with a 209Po yield tracer. The constant rate of supply model was applied to calculate age 159
(Appleby and Oldfield 1978; Appleby 2004). Results are presented in calibrated years (years 160
AD; Table 2). 161
Macrofossil Analysis 162
First, both cores were cleaned and cut into contiguous 1-cm thick slices. Since the aim of our 163
study was to reconstruct vegetation changes following the onset of anthropogenic activities in 164
the vicinity of the wetland complex, analyses and results described in this paper are restricted to 165
the upper 50 cm of each core (data and results from 50 to 100 cm are available in Boucheny 166
2014). Intervals of 1 cm were used for macrofossil analysis. For each level, a 20-cm3 subsample 167
was prepared according to Bhiry and Filion (2001). Macroremains were separated from the 168
organic matrix by boiling the material for about 3 min in a weak 5% KOH solution to induce 169
deflocculation. The material was then wet-screened through a series of sieves of 0.850, 0.425 and 170
0.180 mm mesh. The percentage of volume occupied by each of the different botanical groups 171
(wood remains, roots and rootlets, herbaceous plants, brown mosses, Sphagnum, ericaceous 172
plants) was first estimated. Then, remains of vascular plants were picked out, identified and 173
counted using a stereomicroscope at 4 to 40× magnification (results were expressed in number of 174
macrofossils per 20 cm3 of sediments). 175
Testate Amoebae Analysis and Water Table Level Reconstruction 176
Subsamples of 2 cm3 were taken for testate amoebae analysis at 2 cm-intervals. Standard 177
methods were used to isolate testate amoebae from the organic matter (Hendon and Charman 178
1997; Charman et al. 2000; Booth et al. 2010). Subsamples were boiled in distilled water 179
(10 min) and then screened through a series of sieves with 0.350 and 0.150 mm mesh. Residual 180
material was stained, mounted on glass slides and analyzed under a microscope 181
(400× magnification). For each level, at least 150 tests (shells) were identified and counted 182
(Payne and Mitchell, 2009). Test identification was performed using the Charman et al. (2000) 183
identification key with the modifications suggested by Booth and Sullivan (2007). The relative 184
abundance of each taxon was calculated as a percentage of the total count. Past water table 185
depths (cm) were inferred using a transfer function developed by Lamarre et al. (2013). 186
Diagrams were built with the most abundant observed species throughout both cores. 187
Organic Matter, Nitrogen and Phosphorus Analyses 188
Subsamples (2 cm3) were taken from both cores at regular intervals (2 cm) and analyzed for 189
percent-weight organic matter by loss-on-ignition (550 °C; Heiri et al. 2001). To measure 190
nitrogen (N) and phosphorus (P) contents, supplemental subsamples of 1- cm3 were collected. 191
Subsamples were subjected to a wet digestion procedure based on the method developed by 192
Parkinson and Allen (1975). Total N concentrations were quantified using flow injection analysis 193
(FIA QuikChem4000, Lachat Instruments Division, Milwaukee, USA), and total P with an 194
inductively coupled plasma optimal emission spectrometer (Optima 4300 DV ICP, PerkinElmer 195
Instruments, Norwalk, USA). Analyses were performed at Laval University’s Laboratoire de 196
pédologie forestière.
Aerial Photograph Analyses 198
To assess recent tree encroachment history on the two studied bogs, we used grey-scale aerial 199
photographs from1933, 1964, 1979, 1997 and 2012. Aerial photographs were selected based on 200
cloud-free conditions and absence of distortion. All photos were digitized and georeferenced 201
using QGIS (QGIS, Open Source Geospatial Foundation Project, Beaverton, OR, USA). Sectors 202
surrounding the coring point that showed no obvious signs of extensive tree cutting since 1933 203
were first delineated (ER: 67.5 ha; SJ: 250 ha). Forested areas in these sectors were then 204
manually delineated on each aerial photo based on colour, brightness, contrast and texture. 205
Forested areas roughly correspond to those with more than 35% coverage of tall trees (>2 m; 206
S. Pellerin, unpublished data). Automatic methods, such as thresholding, were not suitable due to 207
high variability in the background colour of the photos (especially with the oldest photos). Visual 208
interpretation of vegetation structure was confirmed by stereoscopic viewing of all aerial 209
photographs. 210
The perimeters of disturbed surfaces (agricultural lands, tree cutting areas, roads, etc.) and 211
drainage ditches located within or bordering the peatlands were then digitized on each 212
georeferenced photograph. The percentage of disturbed surfaces and ditch density (m/ha) within 213
a radius of 500 m from each coring site were then calculated. 214
Results 215
Vegetation History and Human Disturbances 216
For the ER site, a radiocarbon date of 1860 AD (mid-point age) was obtained at a depth of 46 cm 217
while 210Pb results indicated a date of 1907 AD at 24 cm. For the SJ site, a radiocarbon date of 218
1660 AD (mid-point age) was obtained at a depth of 50 cm while 210Pb results indicated a date of 219
1880 AD at 32 cm (Tables 1 and 2; Fig. 2). 220
In both cores, Sphagnum remains were abundant throughout the record, suggesting ombrotrophic 221
conditions (Fig. 2). Remains of ericaceous shrubs (mainly Chamaedaphne calyculata, Kalmia 222
angustifolia and Rhododendron groenlandicum; data not shown) increased in abundance towards
223
the top of both cores, with a similar pattern for Larix laricina needles in the SJ core and brown 224
mosses (mainly Polytrichum strictum) in the ER core. The percentage of volume occupied by 225
roots and rootlets (mainly monocots roots) was quite high at the bottom of the ER core. This 226
section of the core corresponds to the fen/bog transition (see Boucheny 2014 for complete 227
macrofossil results). In the ER, the percentage of volume occupied by roots and rootlets (mainly 228
dycots roots) peaked between 24 and 16 cm and between 10 and 8 cm. These peaks likely 229
correspond to the rooting zones of present-day shrubs and trees and to those that established at 230
the beginning of the 1990s. 231
The increase of shrub (both sites) and tree (SJ) remains concurred with the increase of tree cover 232
(according to aerial photograph analyses) on both sites (Fig. 2). Widespread forest expansion has 233
indeed occurred in both sectors since 1933 (Fig. 3). In the ER sector, the percentage of the area 234
occupied by forest increased from 4 to 45% between 1933 (year of the older aerial photograph) 235
and 2012 (the most recent photograph), which represents an overall gain of 27 ha of forest 236
habitat. The tree cover increase accelerated after 1979. During the same time period, disturbed 237
areas have increased from 10 to 30%, and artificial drainage density from 4.3 to 6.3 m/ha (Fig. 238
2). In the SJ sector, the percentage of the area occupied by forest increased from 44 to 95% 239
between 1933 and 2012, representing an overall gain of 143 ha of forest habitat (Fig. 3). 240
Disturbed areas have increased from 32 to 71%, and artificial drainage density from 7.8 to 9.0 241
m/ha (Fig 2). 242
Inferred Water Table Depths 243
Testate amoebae were identified throughout both cores (Fig. 4). As living tests were found in the 244
uppermost 10 cm, their assemblages have not been interpreted as a record of past hydrological 245
changes. 246
At ER, a gradual rise of the water table from 29 cm (ca. 1840 at 50 cm depth) to 13 cm (ca. 1900 247
at 28 cm depth) was inferred with the decline of Hyalosphenia subflava and Cyclopyxis 248
arcelloides. This was followed by a relatively stable water table (mean 20 ± 0.8 cm) recorded
249
between 28 and 14 cm depths (ca. 1900 to 1970) and characterized by the co-dominance of 250
Difflugia pristis, D. pulex, Hyalosphenia subflava and Nebela militaris. Finally, a decline of the
251
water table from 21 to 35 cm was registered between14 cm (1970) and 10 cm (1985) depths, 252
associated with the decline of D. pristis, D. pulex and N. militaris, and the increase of Trinema-253
Corythion, Assulina muscorum and C. arcelloides. The mean inferred WTD was 32 ± 3.7 cm
254
during this last period. 255
At SJ, the inferred water table was relatively stable (15 ± 2.8 cm) between 50 and 20 cm depths 256
(ca. 1660 to 1946). This period is characterized by a high abundance of Difflugia pulex, a species 257
with a wide tolerance to surface wetness level (Lamarre et al. 2013), and other species associated 258
to similar conditions (e.g., Archerella flavum, Cyclopyxis arcelloides, Pseudodifflugia fulva). 259
This period was followed by a decrease of the water table from 20 to 10 cm depths (1946 260
to1988) inferred by the abundance of Hyalosphenia subflava and the co-occurrence of Nebela 261
militaris, Heleopera sylvatica, Trigonopysis arcula and D. pristis.
262
Organic Matter, Nitrogen and Phosphorus Contents 263
Organic matter content was high (> 94%) and quite stable along both cores (Fig. 5). 264
Concentrations of peat N ranged from 0.99 to 2.03% (mean: 1.34%) in the ER core and from 265
0.89 to 2.07% (mean: 1.27%) in the SJ core. In the ER core, concentrations of N were lower than 266
the mean, from the top of the core to 37 cm depth (ca. 1880) with the exception of a small 267
increase at 9 cm depth. In the SJ core, concentrations of N were lower than the mean from the 268
top of the core to 17 cm depth (ca. 1970) as well as from 31 to 36 cm depth (ca. 1886 to 1835). 269
In the ER core, P concentrations remained relatively stable from the bottom up to 20 cm (ca. 270
1943) ranging from 0.06 to 0.09% (mean: 0.08%), after which they increased up to the surface 271
(ranging from 0.10 to 0.57%; mean: 0.18%). Concentrations of peat P ranged from 0.04 to 0.08% 272
(mean: 0.06%) in the SJ core and were stable throughout. 273
Discussion 274
Disentangling drivers of vegetation changes in peatlands during recent centuries is a challenge, 275
as natural drivers can be confounded with in situ and regional anthropogenic factors. A 276
multi-proxy approach, as used in this study, is expected to facilitate the task by making it 277
possible to explore several drivers acting at different temporal and spatial scales (Pellerin and 278
Lavoie 2003; van der Linden and Van Geel 2006; Lamentowicz et al. 2008; Ireland and Booth 279
2012). Overall, the paleoecological and historical analyses showed that tree encroachment on 280
both sites began recently (last 100-50 years) but was not synchronous. This suggests that the 281
factors driving the phenomenon are different at ER and SJ, even though they are situated in 282
proximity to each other (5.7 km). This general result concurs with a previous study conducted in 283
16 bogs of southeastern Québec, that concluded that local historical factors of each site (e.g., fire, 284
drainage) override regional factors (e.g. climate anomalies, upland deforestation) in explaining 285
rapid and abrupt changes (Pellerin and Lavoie 2003). 286
In a recent Pennsylvania study, Ireland and Booth (2012) showed that upland deforestation by 287
European settlers indirectly induced enrichment of organic deposits due to increased deposition 288
of atmospheric mineral dust rich in nitrogen, phosphorus and potassium and likely caused tree 289
encroachment in a kettle peatland. It was hypothesized that a similar phenomenon occurred on 290
the studied sites, as they were both affected by a very low level of direct human disturbances. 291
However, there was no evidence to support this in the present study. Nitrogen content was lower 292
in both sites following the onset of upland deforestation (1850), while phosphorus content 293
remained relatively stable at the SJ site. At the ER site, a sharp increase in phosphorus content 294
was only registered at the top of the core (ca. 1995-2000), i.e., much later than the peak of 295
upland deforestation. This increase is likely related with the conversion of agricultural practices 296
from tobacco to potato in the vicinity of the ER site (Morneau et al. 2012). Phosphorus loss 297
(through runoff or soil aeolian erosion) in areas of potato production is indeed a widespread 298
concern, because potatoes are a high P-demanding crop that uses applied P inefficiently, leading 299
to frequent over-application of P to crop fields (Ruark et al. 2014). 300
Trees or shrubs encroachment in peatlands has often been ascribed to warmer and/or drier 301
climatic periods (e.g., Birks 1975; Pilcher et al. 1995; Berg et al. 2009). Such conditions are 302
known to favor the lowering of the water table and facilitate the survival and growth of trees in 303
waterlogged ecosystems. In SJ, the beginning of the water level drawdown and of the forest 304
expansion (ca 1946) occurred during a period of low annual precipitation and of high potential 305
evapotranspiration (Online resource 1). In ER, the beginning of the water table drawdown 306
(ca. 1970) and of forest expansion (ca. 1979) occurred rather during a period of high annual 307
precipitation and of average level of potential evapotranspiration. Although we cannot rule out 308
that the climate have contributed to enhance tree expansion, the fact that the tree encroachment 309
and water level drawdown were not synchronous on both studied sites despite close proximity, 310
suggest that climate was likely not the main factor initiating the phenomenon. A more detailed 311
climatic analysis combined with tree rings analyses would be needed to evaluate adequately the 312
influence of climate on the observed changes.An alternative explanation for tree encroachment 313
could be related to gradual drying of the peat deposits associated with in situ drainage or by the 314
development of agriculture and associated drainage network on mineral soils in the surrounding 315
catchment. Several paleoecological and ecological studies have indeed shown increased tree or 316
shrub density following the establishment of drier conditions induced by artificial drainage (e.g., 317
Pellerin and Lavoie 2003; Linderholm and Leine 2004; Talbot et al. 2010; Pasquet et al. 2015). 318
The ditch density measured on both study sites of the Lanoraie Wetland Complex is quite low 319
(<10 m/ha), and much lower than the level of 200 m/ha recommended to spur tree growth in 320
bogs (Roy et al. 2000). However, on both study sites, a decrease of the water table depth 321
(inferred from testate amoebae) coincides with the beginning of forest encroachment. At the SJ 322
site, the water table began to decrease around 1946, i.e. three decades before the drainage ditches 323
in the bog were dug (1980s). However, this water level drawdown matches the peak of 324
agricultural activities and ditch digging mechanization in the area (Morneau et al. 2012). This 325
suggests that the main driver of the tree encroachment in this site was the gradual drying of the 326
peatland surface due to a change in the regional hydrology associated with an intensification of 327
modern agricultural activities on adjacent mineral soils. In situ ditches and climate 328
warming/drying may have facilitated further tree expansion and eventually impeded the return to 329
previous open Sphagnum-dominated state. At the ER site, forest cover expansion (ca. 1979) 330
occurred much later than the peak of agriculture (ca. 1950), but only ca. 15 years after a large, 331
deep artificial drainage ditch was dug in the southwestern part of the sector (Fig. 2). This lag is 332
likely associated to the time needed for a tree to be distinguishable on an aerial photograph 333
following its establishment. Consequently, human-induced drainage likely triggered tree 334
encroachment in the sector, an assertion supported in part by the fact that forest expansion began 335
near the ditch (see Fig 1). 336
Conclusion 337
This multi-proxy approach reveals that the recent tree encroachment in the two studied bogs was 338
triggered by a drying of the bog surface likely caused by a combination of both in situ and 339
regional anthropogenic drainage. Although climate warming/drying could have contributed to 340
the tree encroachment, its effect does not appear to be dominating. Contrary to the prediction, 341
upland deforestation seems to have had no or little effect on woody encroachment, as no 342
evidence was found of nutrient enrichment concurrent with this transformation of the landscape. 343
Whatever the underlying causes of the forest expansion in the two studied bogs, the phenomenon 344
is expected to cause deleterious effects on the diversity and functioning of these protected sites. 345
For instance, a recent study on the flora of these sites showed that forested bog habitats were 346
characterized by fewer true ombrotrophic species, such as Sphagnum magellanicum, S. 347
angustifolium and Kalmia angustifolia and more minerotrophic, non-peatland or exotic species,
348
such as Calamagrostis canadensis, Osmundastrum cinnamomeum, Oxalis stricta and Solidago 349
rugosa, than open bog sectors (Tousignant et al. 2010). Moreover, the observed plant succession
350
toward a globally more forested system may create conditions that will hamper peat 351
accumulation, notably through the decrease in Sphagnum growth under forest cover (Eppinga et 352
al. 2009). Finally, this study shows that the vegetation dynamics of even preserved bogs located 353
in humanized landscapes are sensitive to activities in the surrounding catchments, but that the 354
local history of disturbances seems more influential than the regional setting. 355
Acknowledgements 356
Funding for this study was provided by the Fonds de recherche Nature et technologies (Team 357
grant to M. Larocque and S. Pellerin), the Natural Sciences and Engineering Research Council of 358
Canada (Discovery grant to S. Pellerin: RGPIN-2014-05367), the Friends of the Montréal 359
Botanical Garden and the Ministère du Développement durable, de l’Environnement et de la 360
Lutte contre les changements climatiques du Québec. Our thanks to the Quebec Centre for
361
Biodiversity Science for providing grants to A. Boucheny, as well as E.R. Robert, C. Michaud 362
and H. Asnong for their technical contributions, A. Lamarre for testate amoebae analyses, K. 363
Grislis for English revision and two anonymous reviewers for comments on a previous version of 364
the manuscript. 365
References 366
Appleby PG (2004) Chronostratigraphic techniques in recent sediments. In: Last WM, Smol JP 367
(eds.) Tracking environmental change using lake sediments. Basin analysis, coring, and 368
chronological techniques, vol. 1. Kluwer Academic Publishers, Dordrecht, pp 171-203. 369
Appleby PG, Oldfield F (1978) The calculation of lead-210 dates assuming a constant rate of 370
supply of unsupported 210Pb to the sediment. Catena 5: 1-8. doi: 10.1016/S0341-371
8162(78)80002-2 372
Berg EE, McDonnell Hillman K, Dial R, DeRuwe A (2009) Recent woody invasion of wetlands 373
on the Kenai Peninsula Lowlands, south-central Alaska: a major regime shift after 18 000 374
years of wet Sphagnum-sedge peat recruitment. Canadian Journal of Forest Research 39: 375
2033-2046. doi: 10.1139/X09-121 376
Bhiry N, Filion L (2001) Analyse des macrorestes végétaux. In: Payette S, Rochefort L (eds.) 377
Écologie des tourbières du Québec-Labrador, Presses de l’Université Laval, Sainte-Foy, pp 378
259-273. 379
Birks HH (1975) Studies in the vegetational history of Scotland. IV. Pine stumps in Scottish 380
blanket peats. Philosophical Transactions of the Royal Society of London 270: 181–226. 381
Booth RK, Lamentowicz M, Charman DJ (2010). Preparation and analysis of testate amoebae in 382
peatland palaeoenvironmental studies. Mires and Peat 7: Article 02, 1-7. 383
Booth RK, Sullivan M (2007). Key of testate amoebae inhabiting Sphagnum-dominated 384
peatlands with an emphasis on taxa preserved in Holocene sediments. Lehigh University, 385
Bethlehem. 386
Boucheny A (2014) Dynamique végétale récente du complexe tourbeux des Tourbières-de-387
Lanoraie (Québec). Dissertation, Université de Montréal. 388
Bourgault MA, Larocque M, Roy M (2014) Simulation of aquifer-peatland-river interactions 389
under climate change. Hydrology Research 45: 425-440. doi:10.2166/nh.2013.228 390
Charman DJ, Hendon D, Woodland WA (2000) The identification of testate amoebae (Protozoa: 391
Rhizopoda) in peats. Technical Guide No. 9, Quaternary Research Association. 392
Chapman S, Buttler A, Francez A, Laggoun-Defarge F, Vasander H, Schloter M, Combe J, 393
Grosvernier P, Harms H, Epron D, Gilbert D, Mitchell E (2003) Exploitation of northern 394
peatlands and biodiversity maintenance: a conflict between economy and ecology. Frontiers in 395
Ecology and the Environment 1: 525-532. doi: 10.2307/3868163 396
Comtois P (1982) Histoire holocène du climat et de la végétation à Lanoraie (Québec). Canadian 397
Journal of Earth Sciences 19: 1938-1952. doi: 10.1139/e82-172 398
Eppinga MB, De Ruiter PC, Wassen MJ, Rietkerk M (2009) Nutrients and hydrology indicate 399
the driving mechanisms of peatland surface patterning. The American Naturalist 173: 803-400
818. doi: 10.1086/598487. 401
Frankl R, Schmeidl H (2000) Vegetation change in a south German raised bog: ecosystem 402
engineering by plant species, vegetation switch or ecosystem level feedback mechanisms? 403
Flora 195: 267-276. 404
Freléchoux F, Buttler A, Schweingruber FH, Gobat JM (2000) Stand structure, invasion, and 405
growth dynamics of bog pine (Pinus uncinata var. rotundata) in relation to peat cutting and 406
drainage in the Jura Mountains, Switzerland. Canadian Journal of Forest Research 30: 1114-407
1126. doi: 10.1139/x00-039 408
Heiri O, Lotter AF, Lemcke G (2001) Loss on ignition as a method for estimating organic and 409
carbonate content in sediments: reproductibility and comparability of results. Journal of 410
Paleolimnology 25: 101-110. doi: 10.1023/A:1008119611481 411
Hendon D, Charman DJ (1997) The preparation of testate amoebae (protozoa: Rhizopoda) 412
samples from peat. The Holocene 7: 199-205. doi: 10.1177/095968369700700207 413
Ingerpuu N, Vellak K, Kukk T, Partel M (2001) Bryophyte and vascular plant species richness in 414
boreo-nemoral moist forests and mires. Biodiversity and Conservation 10: 2153-2166. doi: 415
10.1023/A:1013141609742 416
Ireland AW, Booth RK (2012) Upland deforestation triggered an ecosystem state-shift in a kettle 417
peatland. Journal of Ecology 100: 586-596. doi: 10.1111/j.1365-2745.2012.01961.x 418
Jeglum JK, Rothwell RL, Berry GJ, Smith GKM (1992) A peat sampler for rapid survey. 419
Technical Note, Canadian Forestry Service, Saut-Sainte-Marie. 420
Kapfer J, Grytnes JA, Gunnarsson U, Birks HJB (2011) Fine-scale changes in vegetation 421
composition in a boreal mire over 50 years. Journal of Ecology 99: 1179-1189. doi: 422
10.1111/j.1365-2745.2011.01847.x 423
Lamarre A, Magnan G, Garneau M, Boucher É (2013) A testate amoeba-based transfer function 424
for paleohydrological reconstruction from boreal and subarctic peatlands in northeastern 425
Canada. Quaternary International 306: 88-96. doi:10.1016/j.quaint.2013.05.054 426
Lamentowicz M, Milecka K, Gałka M, Cedro A, Pawlyta J, Piotrowska N, Lamentowicz L, Van 427
der Knapp WO (2008) Climate and human induced hydrological change since AD 800 in an 428
ombrotrophic mire in Pomerania (N Poland) tracked by testate amoebae, macro-fossils, pollen 429
and tree rings of pine. Boreas 38: 214-229. doi: 10.1111/j.1502-3885.2008.00047.x 430
Levison J, Larocque M, Fournier V, Gagné S, Pellerin S, Ouellet MA (2014) Dynamics of a 431
headwater system and peatland under current conditions and with climate change. 432
Hydrological Processes 28: 4808-4822. doi: 10.1002/hyp.9978. 433
Linderholm HW, Leine M (2004) An assessment of twentieth century tree-cover changes on a 434
southern Swedish peatland combining dendrochronology and aerial photograph analysis. 435
Wetlands 24: 357-363. doi: 10.1672/0277-5212(2004)024[0357:AAOTCT]2.0.CO;2 436
Mitsch WJ, Gosselink JG (1986) Wetlands. Van Nostrand Reinhold. New York. 437
Morneau J, Lanthier P, Brouillette N (2012). Histoire de Lanaudière. Presses de l’Université 438
Laval, Québec. 439
Parkinson JA, Allen SE (1975) A wet oxydation procedure for the determination of nitrogen and 440
mineral nutrients in biological material. Communications in Soil Science and Plant Analysis 441
6: 1-11. doi: 10.1080/00103627509366539 442
Pasquet S, Pellerin S, Poulin M (2015) Three decades of vegetation changes in peatlands isolated 443
in an agricultural landscape. Applied Vegetation Science 18: 220-229. doi: 444
10.1111/avsc.12142 445
Payne RJ, Mitchell EAD (2009) How many is enough? Determining optimal count totals for 446
ecological and palaeoecological studies of testate amoebae. Journal of Paleolimnology 42: 447
483-495. doi: 10.1007/s10933-008-9299-y 448
Pellerin S, Lavoie C (2003) Reconstructing the recent dynamics of mires using a multi-technique 449
approach. Journal of Ecology 91: 1008-1021. doi: 10.1046/j.1365-2745.2003.00834.x 450
Pilcher JR, Baillie MGL, Brown DM, McCormac FG, MacSweeney PB, McLawrence AS (1995) 451
Dendrochronology of subfossil pine in the north of Ireland. Journal of Ecology 83: 665–671. 452
Reimer PJ, Baillie MGL, Bard E et al (2009) IntCal09 and Marine09 radiocarbon age calibration 453
curves, 0–50,000 years cal BP. Radiocarbon 51: 1111-1150. 454
Rosa E, Larocque M (2008) Investigating peat hydrological properties using field and laboratory 455
methods: application to the Lanoraie peatland complex (southern Quebec, Canada). 456
Hydrological Processes 22: 1866-1875. doi: 10.1002/hyp.6771 457
Rosa E, Larocque M, Pellerin S, Gagné S, Fournier B (2009) Determining the number of manual 458
measurements required to improve peat thickness estimations by ground penetrating radar. 459
Earth Surface Processes and Landforms 34: 377-383. doi: 10.1002/esp.1741 460
Roy V, Plamondon AP, Bernier PY (2000) Draining forested wetland cutovers to improve 461
seedling root zone conditions. Scandinavian Journal of Forest Research 15: 58-67. doi: 462
10.1080/02827580050160475 463
Ruark M, Kelling K, Good L (2014) Environmental concerns of phosphorus management in 464
potato production. American Journal of Potato Research 91: 132-144. doi: 10.1007/s12230-465
014-9372-1 466
Stuiver M, Reimer PJ (1993) Extended 14C database and revised CALIB radiocarbon calibration 467
program. Radiocarbon 35: 315-330. 468
Talbot J, Richard PJH, Roulet NT, Booth RK (2010) Assessing long-term hydrological and 469
ecological responses to drainage in a raised bog using paleoecology and a hydrosequence. 470
Journal of Vegetation Science 21: 143-156. doi: 10.1111/j.1654-1103.2009.01128.x 471
Tardy G, Pellerin S (2006) Complexe tourbeux du delta de Lanoraie. Délimitation révisée et état 472
de situation. Institut de recherche en biologie végétale, Montréal. 473
Tousignant ME, Pellerin S, Brisson J (2010) The relative impacts of human disturbances on the 474
vegetation of a large wetland complex. Wetlands 30: 333-344. doi: 10.1007/s13157-010-475
0019-9 476
van der Linden M, van Geel B (2006) Late Holocene climate change and human impact recorded 477
in a south Swedish ombrotrophic peat bog. Palaeogeography, Palaeoclimatology, 478
Palaeoecology 240: 649-667. doi:10.1016/j.palaeo.2006.03.039 479
Yu Z, Loisel J, Brosseau DP, Beilman DW, Hunt SJ (2010) Global peatland dynamics since the 480
last glacial maximum. Geophysical Research Letters. doi:10.1029/2010GL043584 481
Table 1. Radiocarbon dates of the cores collected from the Lanoraie Wetland Complex. 483 Site and depth (cm) Laboratory number Material dated 14C date (years BP) 2 σ age range (years BC/AD) Mid-point (years BC/AD) RE-46 UCIAMS-121089 ULA-3937 Peat 135 ± 15 1832 – 1885 AD 1860 AD SJ-50 UCIAMS-121088 ULA-3936 Peat 125 ± 20 1642 – 1676 AD 1660 AD 484 485
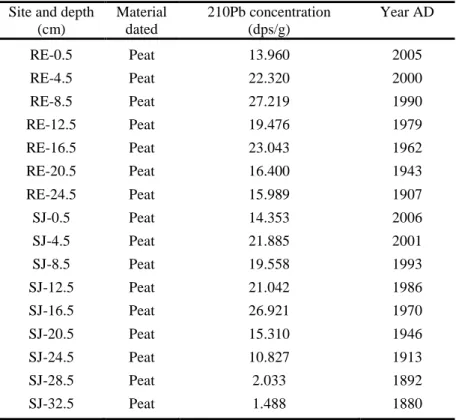
Table 2. 210Pb concentrations and dates from the upper part of the peat cores collected from the 486
Lanoraie Wetland Complex. 487
Site and depth (cm) Material dated 210Pb concentration (dps/g) Year AD RE-0.5 Peat 13.960 2005 RE-4.5 Peat 22.320 2000 RE-8.5 Peat 27.219 1990 RE-12.5 Peat 19.476 1979 RE-16.5 Peat 23.043 1962 RE-20.5 Peat 16.400 1943 RE-24.5 Peat 15.989 1907 SJ-0.5 Peat 14.353 2006 SJ-4.5 Peat 21.885 2001 SJ-8.5 Peat 19.558 1993 SJ-12.5 Peat 21.042 1986 SJ-16.5 Peat 26.921 1970 SJ-20.5 Peat 15.310 1946 SJ-24.5 Peat 10.827 1913 SJ-28.5 Peat 2.033 1892 SJ-32.5 Peat 1.488 1880 488
Fig. 1 Location of the Lanoraie Wetland Complex (southern Québec, Canada) and of the two 489
coring sites: Ecological Reserve (ER) and St. Jean (SJ). 490
Fig. 2 Macrofossil diagrams (black bars = botanical groups expressed as percentage of organic 492
matter volume; grey bars = number of vascular plant macrofossils/20 cm3, selected taxa only) for 493
the Ecological Reserve (ER) and St. Jean (SJ) cores. Grey bands begin at 1850 and end at 1950, 494
corresponding respectively to the onset of agricultural activities and maximum deforestation in 495
the area (Morneau et al. 2012). Evolution of the tree cover on the sites according to aerial 496
photograph analyses is also shown, along with percentage of disturbed areas and ditch density in 497
a radius of 500 m of the coring point. The asterisks indicate the approximate date when the main 498
ditches were dug. Chronological data are shown on the left axis (black squares = 210Pb; black 499 circles = 14C). 500 501 502 503
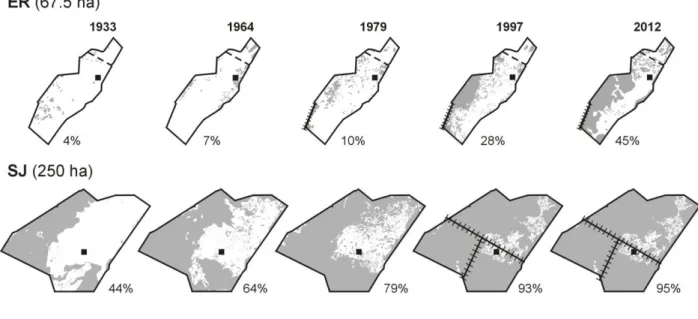
Fig 3 Spatiotemporal evolution of the forest cover (grey areas) of the Ecological Reserve (ER) 504
and St. Jean (SJ) sectors of the Lanoraie Wetland Complex (sites are not to scale), reconstructed 505
from aerial photographs. Percentage of the bog area covered by forest is indicated for each year. 506
507
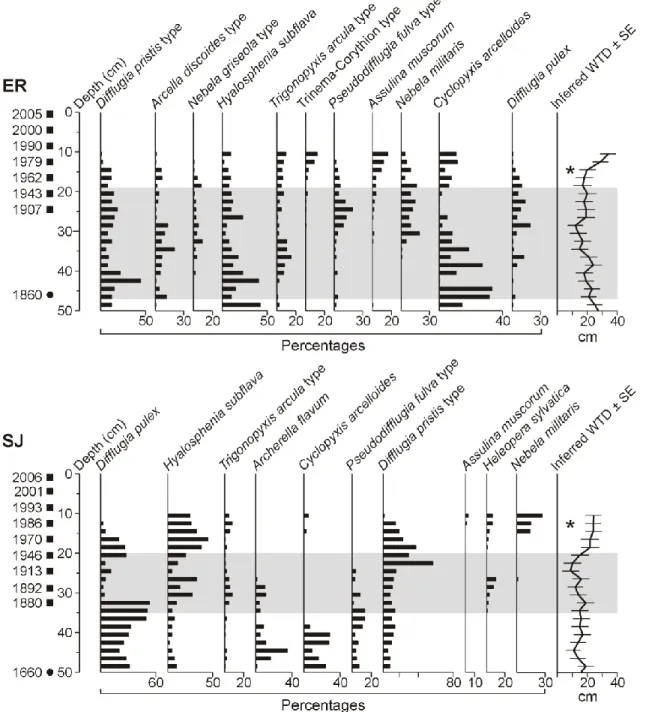
Fig. 4 Testate amoebae diagrams (selected taxa only) and inferred water table depth (WTD ± 509
standard error [SE]) for the Ecological Reserve (ER) and St. Jean (SJ) cores. Living tests were 510
found in the uppermost 10 cm of both cores; their assemblages have thus not been interpreted as 511
a record of past hydrological changes. Grey bands begin at 1850 and end at 1950, corresponding 512
respectively to the onset of agricultural activities and maximum deforestation in the area 513
(Morneau et al. 2012). The asterisks indicate the approximate date when the main ditches were 514
dug. Chronological data are shown on the left axis (black squares = 210Pb; black circles = 14C). 515
516 517
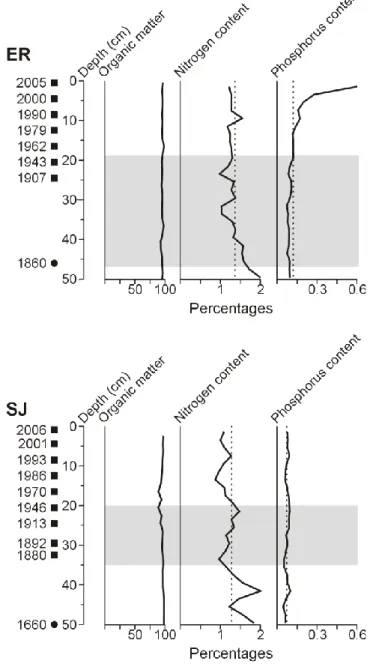
Fig. 5 Changes in organic matter, nitrogen and phosphorus contents (dashed lines = mean level) 518
through time for the Ecological Reserve (ER) and St. Jean (SJ) cores. Grey bands begin at 1850 519
and end at 1950, corresponding respectively to the onset of agricultural activities and maximum 520
deforestation in the area (Morneau et al. 2012). Chronological data are shown on the left axis 521
(black squares = 210Pb; black circles = 14C). 522
523 524