potential estimation of major mineral contents in cow milk
using mid-infrared spectrometry
H. Soyeurt,*1 D. Bruwier,* J.-m. romnee,† n. Gengler,*‡ C. Bertozzi,§ D. veselko,# and p. Dardenne† *Gembloux Agricultural University, Animal Science Unit, B-5030 Gembloux, Belgium
†walloon Agricultural research Centre, Quality Department, B-5030 Gembloux, Belgium ‡National Fund for Scientific research, B-1000 Brussels, Belgium
§walloon Breeding Association, B-5590 Ciney, Belgium #Milk Committee, B-4651 Battice, Belgium
aBStraCt
Milk and dairy products are a major source of miner-als, particularly calcium, involved in several metabolic functions in humans. Currently, several dairy products are enriched with calcium to prevent osteoporosis. The development of an inexpensive and fast quantitative analysis for minerals is required to offer dairy farm-ers an opportunity to improve the added value of the produced milk. The aim of this study was to develop 5 equations to measure Ca, K, Mg, Na, and P contents directly in bovine milk using mid-infrared (MIR) spec-trometry. A total of 1,543 milk samples were collected between March 2005 and May 2006 from 478 cows dur-ing the Walloon milk recorddur-ing and analyzed by MIR spectrometry. Using a principal component approach, 62 milk samples were selected by their spectral vari-ability and separated in 2 calibration sets. Five outliers were detected and deleted. The mineral contents of the selected samples were measured by inductively coupled plasma atomic emission spectrometry. Using partial least squares combined with a repeatability file, 5 cali-bration equations were built to estimate the contents of Ca, K, Mg, Na, and P in milk. To assess the accuracy of the developed equations, a full cross-validation and an external validation were performed. The cross-val-idation coefficients of determination (R2cv) were 0.80, 0.70, and 0.79 for Ca, Na, and P, respectively (n = 57), and 0.23 and 0.50 for K and Mg, respectively (n = 31). Only Ca, Na, and P equations showed sufficient R2cv for a potential application. These equations were validated using 30 new milk samples. The validation coefficients of determination were 0.97, 0.14, and 0.88 for Ca, Na, and P, respectively, suggesting the potential to use the Ca and P calibration equations. The last 30 samples were added to the initial milk samples and the calibration equations were rebuilt. The R2cv for
Ca, K, Mg, Na, and P were 0.87, 0.36, 0.65, 0.65, and 0.85, respectively, confirming the potential utilization of the Ca and P equations. Even if new samples should be added in the calibration set, the first results of this study showed the feasibility to quantify the calcium and phosphorus directly in bovine milk using MIR spectrometry.
Key words: milk, mineral, mid-infrared spectrometry,
calcium
IntrODuCtIOn
Milk and dairy products are the main source of cal-cium (around 1,200 mg/L of milk) in Western diets (Devriese et al., 2006). In Belgium, cheese is the major source of calcium (27%) followed by raw milk (14%). Globally, dairy products contribute 54% of the daily dietary intake of calcium (Devriese et al., 2006). In the European Union, this contribution varies between 45 and 70% (Guéguen and Pointillart, 2000). According to Gerrior and Bente (2002), milk provides more than 70% of the calcium available in the US food supply.
Consumption of the multifunctional nutriment cal-cium is important for humans because calcal-cium plays a role in several metabolic functions such as blood coagu-lation and muscular contractions. The average recom-mended dietary calcium intake is about 900 mg/d for adults (19 to 59 yr old) and 1,200 mg/d for adolescents and the elderly (Guéguen and Pointillart, 2000; Devriese et al., 2006). However, consumption of Ca by women and men is too low. In Belgium, in 2004, the average consumption of dietary calcium was 838 mg/d for men and 716 mg/d for women (e.g., Heaney, 2000; Devriese et al., 2006). According to Huth et al. (2006), the low intake of calcium by Americans and the large difference between recommended and typical dietary Ca intakes are recognized as major public health problems. In fact, low consumption of Ca has several effects on human health such as osteoporosis, which is more frequent in women than in men (e.g., Guéguen and Pointillart, 2000; Lanou et al., 2005; Devriese et al., 2006; Huth et
J. Dairy Sci. 92:2444–2454 doi:10.3168/jds.2008-1734
© American Dairy Science Association, 2009.
2444
Received September 20, 2008. Accepted January 20, 2009.
al., 2006), arterial hypertension, colon cancer (Guéguen and Pointillart, 2000; Huth et al., 2006), and regulation of body weight and body fat (Huth et al., 2006).
Milk is a good source of other major minerals such as magnesium, phosphorus, and potassium. In the United States, dairy products provide about 16% of Mg and 32% of P and Na dietary intakes. Like calcium, phosphorus and magnesium are involved in bone health and human development. The combination of sodium, magnesium, calcium, and other milk components such as vitamins, protein, and essential fatty acids has a beneficial effect on blood pressure regulation (Huth et al., 2006).
Currently, several dairy products are enriched in calcium to prevent osteoporosis. However, according to Huth et al. (2006), the combination of minerals in milk seems to be more effective than minerals taken alone. Improving the mineral content in milk could be an interesting opportunity for dairy farmers to add value to the milk produced. To do this, the farmers could use the natural sources of variation influencing the contents of mineral in milk. For instance, Mouillet et al. (1975) and Cerbulis and Farrell (1976) showed breed differences for the mineral profile in bovine milk. Davis et al. (2001) observed within-breed differences of calcium for constant protein content in milk, suggesting a potential animal selection effect on mineral contents. The use of genetic variation (within or across breeds) requires a large data set. Currently, one of the faster methodologies—inductively coupled plasma atomic emission spectrometry (ICP-AES)—is too expensive to permit routine analysis of milk samples collected, for instance, during the regular milk recording managed by different breed organizations. However, the regular milk recording permits the rapid collection of a large amount of data. The current method used to measure the con-tents of fat, protein, lactose, and urea during regular milk recording is mid-infrared (MIR) spectrometry. Using this technology to measure the contents of min-eral in milk could permit the development of selection and management tools for dairy farmers to improve the nutritional quality of milk. Thus, the objective of this research was to study the feasibility of developing calibration equations permitting the quantification of Ca, K, Mg, Na, and P directly in bovine milk using MIR spectrometry.
materIaLS anD metHODS
Sampling and Recording Spectra Files
The development of calibration equations requires the analysis of samples showing a large variability of milk composition. Therefore, different known sources of
variation for milk composition were taken into account during the sampling (e.g., geographical situation, sea-son of sampling, breed). Following standard procedures (International Committee for Animal Recording, 2004), 2 × 1,543 milk samples of 50 mL (50% morning milk and 50% evening milk) were collected for 1 yr (March 2005 to May 2006) during the milk recording of the Walloon region of Belgium organized by the Walloon Breeding Association (Ciney, Belgium). These samples were collected from 478 cows belonging to 8 herds and representing 6 dairy breeds (dual-purpose Belgian Blue, Holstein-Friesian, Jersey, Montbeliarde, Normande, and Meuse-Rhine-Yssel type Red and White). One sample was analyzed directly after sampling by MIR spectrom-etry using a MilkoScan FT6000 spectrometer (Foss, Hillerød, Denmark) by the Milk Committee (Battice, Belgium). All of the generated spectra were recorded in a database. The second sample was conserved at −26°C pending chemical analysis.
Selection of Samples
The measurement of mineral contents for all collect-ed samples was not conceivable because of the cost of chemical analysis. The selection of samples was difficult because any indicator traits of mineral contents in milk were available. To maximize the milk composition vari-ability of the samples used in the calibration set, 100 samples were selected from their spectral variability using a principal components approach.
Reference Method
The reference mineral contents used for the calibration process were measured using ICP-AES (Ultima, Jobin-Yvon, Longjumeau, France). The dispersive system was a Czerny-Turner monochromator; the focal distance was 1 m. A concentric nebulizer composed of Meinhard glass and a cyclonic room was used. The spectral data ranged from 120 to 800 nm. Humidification of argon was used as well as a peristaltic pump. The integration parameters were as follows: nebulizer gas flow = 0.75 min−1; pressure of nebulizer = 3 bar; Rf power = 1,100 W; fixed time of rising = 60 s; fast speed rinsing pump; time of transfer = 15 s; time of stabilization = 45 s; fast speed of transfer pump; synchronization time = 0 s; normal speed of pump = 20 m/s. The spectral lines for the detection of Ca, K, Mg, Na, and P were 318, 766, 279, 590, and 178 nm, respectively.
Some liquids can be analyzed without the mineraliza-tion stage (which increases the cost of analysis, the time needed, and, frequently, the risk of sample contamina-tion). Nobrega et al. (1997) tested the direct analysis of milk without mineralization using a dilution in an
aqueous solution at pH 8 containing a tertiary amine mixed at 5 and 10% to prevent the precipitation of proteins. Murcia et al. (1999) performed direct analysis of diluted milk samples (1:50) by addition of Fluka Tri-ton X-100 (polyethylene glycol tert-octylphenyl ether; Sigma-Aldrich, Birnem, Belgium) as a tensioactive dis-persant to improve the repeatability of measurements. The results obtained with and without mineralization stage were similar (Murcia et al., 1999).
Before the development of calibration equations, the first step of this study was to validate the hypothesis that the measurements of minerals by ICP-AES with and without a previous mineralization stage should be similar. Four milk samples were chosen based on their extreme fat content (2.38, 2.40, 7.52, and 7.62 mg/dL of milk) because fat is a critical point in milk analysis by ICP-AES. These selected samples were then analyzed by ICP-AES with and without the mineraliza-tion stage. Each sample was analyzed 3 times for each treatment. For the dispersive analysis, each sample was diluted at 1:100 and Triton X-100 was added at 1:1000. The diluent was ultra-pure water obtained with a Mil-liQ Gradient instrument (Millipore, Billerica, MA). A nitroperchloric mineralization by microwave was used. A total of 0.5 g of sample was introduced in a Teflon vessel. Then, 1 mL of H2O2 at 30% (Merck, Brussels, Belgium) and 6 mL of HNO3 at 65% (Merck) were added. The vessel was hermetically sealed and placed in the microwave. Two microwaves (MLS 1200 mega, Milestone Microwave Laboratory Systems, Bergamo, Italy) were used. The first contained a rotor with 6 places and the second had a rotor with 10 places. The process of mineralization using the microwave contain-ing a rotor with 6 places was 1 min at 250 W; 1 min at 0 W; 5 min at 250 W; 5 min at 400 W; 5 min at 650 W; and 10 min of ventilation. The process of mineraliza-tion using the microwave containing a rotor with 10 places was: 2 min at 250 W; 2 min at 0 W; 5 min at 250 W; 5 min at 450 W; 5 min at 650 W; 5 min at 450 W; and 10 min of ventilation. The dispersed samples were analyzed first followed by the mineralized samples to prevent potential precipitation of proteins. After min-eralization, the samples were filtered using Whatman filter paper (595 ½, diameter 125 mm, Scheider and Schuell, Dassel, Germany). For the filtration of samples for the quantification of P, a paper poor in P was used (Whatman, 512 ½, diameter 150 mm, Scheicher and Schuell).
Estimation of Uncertainty
The uncertainty of measurement comprised different sources of uncertainty: 1) the uncertainty of repeat-ability among independent analyses executed on the
same sample (Urepeat); 2) the uncertainty about the recovery percentage of mineral element estimated using a certified reference milk (CRM) sample (Urecup); 3) the uncertainty on the weighing of sample (Uweight). The calibration certificate of the precision balance provided this information; 4) the uncertainty of the dilutions of the sample (Udilution). The manufacturer of the vessel mentioned this characteristic; 5) the uncertainty of the ICP-AES instrument (UICP). The instrument gave this uncertainty from repeated analysis (3 times) of the sample milk sample; 6) the uncertainty of the concentra-tion of the stock soluconcentra-tion [standard soluconcentra-tion: CertiPur (Merck) for the standard needed for the calibration of the ICP-AES instrument (Ustock)]. The manufacturer provided this information; 7) the uncertainty of the di-lutions of the standard needed to establish the calibra-tion of the ICP-AES instrument (Ustandard); and finally, 8) the uncertainty about the purity of the CRM sample used (UCRM). The provider gave this characteristic.
The CRM sample used was a powdered skimmed milk (CRM-063R) of the Community Bureau of Refer-ence (Brussels, Belgium). In accordance with Skoog et al. (1997), the total uncertainty of the chemical method (Utotal) was calculated following this expression:
U = (U )²+(U )²+(U )²+(U )² +(U )
total repeat recup weight dilution ICP ²²+(Ustock)²+(Ustandard)²+(UCRM)²
.
Calibration Procedure
The calibration equations were established using 3 different calibration sets. The first calibration set contained the 40 samples showing the highest spectral variability from the 100 samples initially selected. Eight samples were not correctly conserved and were not ana-lyzed by ICP-AES. Following the same approach, a sec-ond set including 30 samples was created from the 60 remaining samples. The third calibration set contained 30 samples selected using the Ca calibration equation developed based on the samples contained in the first and the second calibration sets (more details in the Results and Discussion section). A total of 92 samples were analyzed by ICP-AES; 5 outliers were detected and deleted. From the reference mineral contents and the corresponding spectral data, 5 calibration equations for the prediction of Ca, K, Mg, Na, and P contents were developed using a program for multivariate calibration (WINISI III; http://www.winisi.com/; Foss, Hillerød, Denmark). The use of partial least squares regressions was preferred in this study over other methods such as multiple linear or principal components regressions because the use of partial least squares regressions lim-its the presence of noise in the calibration equations
when a limited number of samples are used. In fact, the PLS method compresses all spectral data (Martens and Jensen, 1982; Frank et al., 1984) and simultaneously maximizes the variability of the dependent variable (Martens and Naes, 1987).
To linearize the spectra, the initial spectral data expressed in transmittance were converted into ab-sorbance using the following formula: abab-sorbance = log(transmittance−1).
To improve the repeatability of the calibration equa-tions across instruments, a repeatability file containing milk spectra analyzed by 4 different MilkoScan FT6000 (Foss) was used: 3 located at the Milk Committee (Bat-tice, Belgium) and 1 located at Convis (Ettelbruck, Luxembourg). The approach was similar to the one described by Westerhaus (1990). Some statistical pa-rameters of the developed calibration equations were calculated to assess the accuracy of the prediction: the mean and the standard deviation (SD) of the reference mineral contents measured by ICP-AES, the standard error of calibration (SEC), and the calibration coef-ficient of determination (R2
C).
Validation
The developed calibration equations were validated using 2 different methods: an internal validation using a full cross-validation and an external validation using milk samples that were not used to build the considered equations.
A full cross-validation was applied to determine the most appropriate number of factors used and also to assess the robustness of the developed equations. Cross-validation uses the same samples for Cross-validation and calibration processes. Full cross-validation leaves out one sample and then performs a calibration with the remaining samples (Williams, 2007). This procedure is repeated until every sample has been predicted once. Finally, the validation errors are combined into a stan-dard error of cross-validation (SECV). Consequently, some additional statistical parameters were calculated to assess the accuracy of calibration equations: the SECV and the cross-validation coefficient of determi-nation (R2
CV). The ratio of SECV to SD (RPD) was
also calculated to assess the efficiency of the calibration (Williams, 2007).
External validation was based on the comparison between the mineral contents predicted by MIR spec-trometry and those measured by the reference chemical analysis (ICP-AES) for milk samples that were not used for the calibration procedure. The prediction values were obtained by applying the developed calibration equations on collected spectra using the calibration program (WINISI III; http://www.winisi.com/; Foss).
The validation coefficient of determination (R2v) was
calculated.
reSuLtS anD DISCuSSIOn
Reference Method
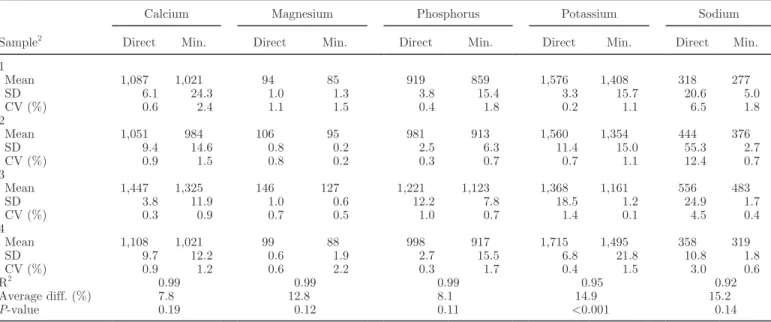
Table 1 depicts the results obtained for the analysis by ICP-AES of the 4 selected samples with and with-out the mineralization pretreatment. This experiment showed that these 2 treatments (with and without min-eralization) differed significantly only for K. Indeed, the P-value obtained by the test of equality of means and presented in Table 1 was <0.001 for K. The coefficient of variation (CV) observed from the measurement of Na by direct milk dispersion in the ICP-AES spectrometer was greater than that calculated for the measurement of Na after mineralization. Thus, the direct analysis of milk sample by ICP-AES was not appropriate to measure the Na content. However, in accordance with the CV values, the direct analysis of milk by ICP-AES was more efficient for the measurement of the other studied minerals (Table 1).
This observation was confirmed by the coefficient of determination (R2) calculated for the relationships between the mineral concentrations measured by ICP-AES with and without mineralization. In fact, R2 was 0.99 for Ca, Mg, and P, and was 0.95 for K. The R2 value for Na was the lowest (0.92), indicating the larger dif-ference in the measurement of Na between the 2 studied methods. However, this value was still relatively high.
The average differences for the mineral contents mea-sured by the 2 considered methods are also presented in Table 1. The difference ranged between 7.8 and 15.2%. As expected based on the previous results, the great-est difference was observed for Na. Globally, the values given by the direct analysis of milk sample were greater than those measured after a mineralization stage.
For the 2 methods, the repeatability can be consid-ered as good because the CV values were ≤3% except for the measurement of Na performed by ICP-AES without previous mineralization (Table 1).
This inequality between the concentrations obtained by ICP-AES with and without mineralization was in agreement with a previous study conducted by Roulez (2001). The results obtained by that author showed the highest contents of Ca, K, and Na for the direct method of analysis compared with the mineralization pretreatment. The use of nitric acid could precipitate a part of the proteins and modify the spatial repartition of mineral in the solution. The use of Triton X-100 was not investigated. In contrast to the results of Roulez (2001), Murcia et al. (1999) used this tensioactive dis-persant and showed similar results with and without
mineralization. In this study, the measurement of Na by the two proposed methods did not provide similar results.
Based on the obtained results and the fact that the use of the ICP-AES with a previous mineralization stage increases the possibility of sample loss, direct analysis of milk sample by ICP-AES without mineralization was used to quantify the reference mineral contents needed for the development of calibration equations.
Sample Selection
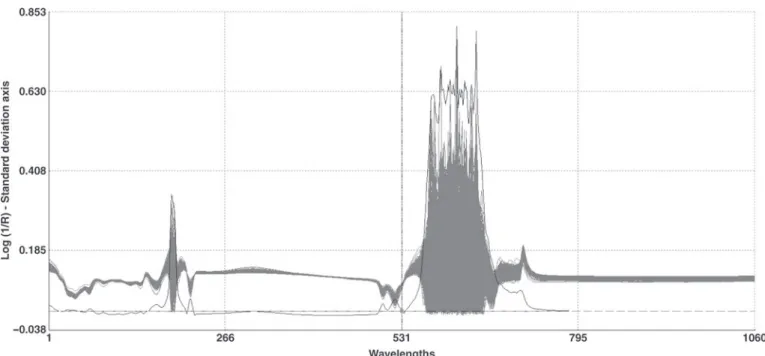
Figure 1 illustrates the spectral variability of the 1,543 collected milk samples. All spectra were plotted and the variation is clearly observable. For convenience, the standard deviation for each spectral data points (1,060 in total for the spectra generated by the Milko-Scan FT6000) is also represented. For financial reasons, it was not possible to analyze all collected samples. Principal components analysis was applied to select the most interesting samples to elaborate the first and second calibration sets. Thirty-one principal compo-nents described 99.98% of the spectral variability. As explained in the Materials and Methods section, a total of 100 milk samples were selected and 57 of the selected samples showing the largest spectral variability were analyzed by ICP-AES.
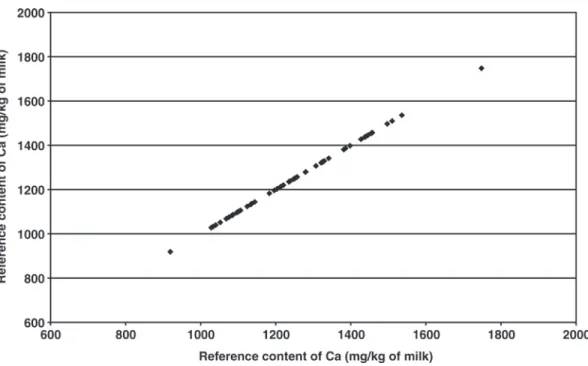
After ICP-AES analysis of these samples, we observed that the variation of Ca content was not completely represented, especially for the highest and lowest con-tents (Figure 2). Instead of the analysis of the remaining selected samples, we decided to apply the Ca calibra-tion equacalibra-tion developed from the 57 analyzed samples to select samples permitting to complete the observed variation of Ca content. Figure 3 presents the predic-tions of Ca content for the 1,473 collected samples. A total of 30 milk samples showing the highest and lowest Ca contents was selected to be analyzed by ICP-AES and constituted the third calibration set.
Reference Samples
The descriptive statistics for the 3 calibration sets containing 92 samples are described in Table 2. Because of technical issues, the contents of K and Mg were not measured for the second calibration set by ICP-AES.
The total variation ranges observed for Ca, Na, and P from the 92 analyzed milk samples were 1,043, 561, and 505 mg/kg of milk, respectively. The total varia-tion ranges observed for K and Mg from 62 samples were 80 and 767 mg/kg of milk, respectively (Table 2). The largest variability for the samples selected based on their spectral variability (calibration sets 1 and 2) was obtained for calcium, which was expected because
Table 1. Comparison between the concentrations of studied minerals (means and SD in mg/kg of milk) obtained by a direct analysis of milk
samples by inductively coupled plasma atomic emission spectroscopy (ICP-AES) and by ICP-AES after mineralization1
Sample2
Calcium Magnesium Phosphorus Potassium Sodium
Direct Min. Direct Min. Direct Min. Direct Min. Direct Min.
1 Mean 1,087 1,021 94 85 919 859 1,576 1,408 318 277 SD 6.1 24.3 1.0 1.3 3.8 15.4 3.3 15.7 20.6 5.0 CV (%) 0.6 2.4 1.1 1.5 0.4 1.8 0.2 1.1 6.5 1.8 2 Mean 1,051 984 106 95 981 913 1,560 1,354 444 376 SD 9.4 14.6 0.8 0.2 2.5 6.3 11.4 15.0 55.3 2.7 CV (%) 0.9 1.5 0.8 0.2 0.3 0.7 0.7 1.1 12.4 0.7 3 Mean 1,447 1,325 146 127 1,221 1,123 1,368 1,161 556 483 SD 3.8 11.9 1.0 0.6 12.2 7.8 18.5 1.2 24.9 1.7 CV (%) 0.3 0.9 0.7 0.5 1.0 0.7 1.4 0.1 4.5 0.4 4 Mean 1,108 1,021 99 88 998 917 1,715 1,495 358 319 SD 9.7 12.2 0.6 1.9 2.7 15.5 6.8 21.8 10.8 1.8 CV (%) 0.9 1.2 0.6 2.2 0.3 1.7 0.4 1.5 3.0 0.6 R2 0.99 0.99 0.99 0.95 0.92 Average diff. (%) 7.8 12.8 8.1 14.9 15.2 P-value 0.19 0.12 0.11 <0.001 0.14
1Direct = direct analysis of milk sample by ICP-AES; Min. = analysis of milk sample by ICP-AES after mineralization.
2The 4 samples were analyzed 3 times each. R2 = coefficient of determination for the relation between the contents measured by the direct
ICP-AES analysis and the contents measured by ICP-ICP-AES after mineralization; Average diff. = average difference; P-value = P-value for the test of equality of means.
calcium showed also the greatest content in bovine milk (Table 2).
Uncertainty
Table 3 shows the uncertainty of the method used to measure the reference mineral contents. The high-est uncertainty came from the recuperation percentage of mineral element in the CRM sample. The second highest contributors to uncertainty were related to the weighing of sample and to the purity of the CRM sample used. The total uncertainty ranged between 3.95 and 5.55% (Table 3). These values were globally <5% and were, therefore, acceptable.
Calibration Equations
Table 4 depicts the descriptive statistics for the de-veloped calibration equations. As explained previously, 3 distinct sets of calibration samples were analyzed. The first calibration equations, which quantified the Ca, K, Mg, Na, and P in milk, were built from 32 samples selected based on their spectral variability. The R2c values for the equations of Ca, Na, and P were >0.80. The cross-validation gave lowest values: R2cv values for these equations were >0.70 and RPD was >2. These statistics (RPD and R2cv) observed for Mg and K were too low to investigate potential use of these equations.
The second step of this study was to establish cali-bration equations by the addition of the samples ana-lyzed in the second calibration set. Table 4 presents the statistics of the developed equations for Ca, Na, and P from a total of 57 reference samples analyzed by ICP-AES. The observed R2cv was higher compared with the first calibration equation only for the Ca, even if the R2c was lower. The larger variation range of the second calibration set compared with the first calibration set could explain this difference (Table 2). The external validation for the developed equations was executed from milk samples contained in the third calibration set (Table 2). The R2v values were 0.97, 0.14, and 0.88 for Ca, Na, and P, respectively (Figure 4). This external validation showed a poorer ability to predict Na using MIR spectrometry. However, these results showed the feasibility of using the developed calibration equations to predict the contents of Ca and P in milk.
Reference samples with extreme values of Ca were rare (Figure 2). Therefore, the samples for the third calibration set were selected based on their Ca MIR predictions obtained using the second Ca calibration equation to enhance the robustness of the predic-tion. The final step of this study was to rebuild the calibration equation for the total samples analyzed by ICP-AES. The RPD and R2cv values calculated for the calibration equations that predicted the contents of Ca and P were the highest (Table 4). Therefore, the addi-tion of samples with extreme values of Ca improved the
Figure 1. Spectral variability of the 1,543 collected milk samples. The gray background represents the spectral variability of the collected samples (all spectra are plotted). The continuous black line presents the standard deviation for the 1,060 spectral data points.
accuracy of the prediction (RPD = 2.74). Perhaps the accuracy for the prediction of P by MIR spectrometry was improved (RPD = 2.54) because of the positive correlation between P and Ca (0.73; Table 5). Even if selection of the reference samples used for calibration based on the spectral data is the best way to select
the first samples, the selection of new samples based on the prediction given by an appropriate calibration equation seems to be the best way to improve the ro-bustness of the calibration equation. Greater values of R2cv and RPD for K and Mg were also observed but the values were too low to investigate a potential
Figure 3. Calcium contents predicted by mid-infrared spectrometry using the calibration equation of calcium developed from 57 samples. Figure 2. Reference calcium contents measured by inductively coupled plasma atomic emission spectroscopy from the 57 samples initially selected.
use of these equations. However, the improvement of the prediction for Mg showed potential to increase the number of reference samples used to build this equa-tion. These samples could be chosen using the second calibration equation established for Mg. The decrease in the robustness of the equation predicting the con-tent of Na could be partly explained by the chemical analysis used to measure the Na content. Based on the results presented in Table 1, direct analysis of milk by ICP-AES was less appropriate to measure the contents of Na. The contents of Na should be measured again using the ICP-AES with a mineralization stage. As the calibration equations are directly affected by the refer-ence values, this might improve the robustness of this equation.
Usefulness of the developed equations exists only if the MIR predictions of minerals are related to a real spectral absorbance and cannot be estimated based on the correlations with other known milk components also predicted by MIR. In the Walloon milk recording, the contents of fat, protein, urea, and lactose are mea-sured by MIR. The correlations between the Ca and P MIR predictions and the known milk components were calculated and shown in Table 5. All correlations were inferior to the correlation calculated based on the cross-validation. Therefore, the calibration equa-tions established to predict the contents of Ca and P in bovine milk are useful because they came from a real spectral absorbance.
According to Williams (2007), calibration equations showing R2 values between 0.83 and 0.90 can be used with caution for most applications, including research. In conclusion, based on the obtained statistical param-eters, this study showed the feasibility of quantifying the contents of Ca and P directly in milk using MIR spectrometry. This application could have interest-ing potential interest for dairy farmers. For instance, Harmon (1994) suggested that the variation of miner-als in milk could be studied to detect the presence of mastitis.
Interpretation of Calibration Equations
The correlations between Ca and P contents and spectral data were also estimated to detect the most related spectral zones to mineral predictions by MIR. The greatest correlations for Ca were located between 1,454 and 1,458 cm−1 (R = 0.74) and between 2,831 and 2,970 cm−1 (R = 0.73). The greatest correlations for P were located between 1,200 and 1,277 cm−1 (R = 0.77), between 2,841 and 2,974 cm−1 with a maximum at 2,974 cm−1 (R = 0.77), and between 1,442 and 1,469 cm−1 (R = 0.71). The spectral data located at 2,927 cm−1 and 2,858 cm−1 are related to milk fat.
Conse-T
able 2.
Descriptiv
e statistics of the reference samples analyzed b
y inductiv
ely coupled plasma atomic emission sp
ectroscop
y (ICP-AES) for eac
h calibration set (1, 2, and 3)
Statistic Calcium Magnesium Phosphorus P otassium So dium 1 2 3 1 3 1 2 3 1 3 1 2 3 n 32 30 30 32 30 32 30 30 32 30 32 30 30 Mean (mg/kg of milk) 1,193 1,323 1,488 108 112 1,074 1,058 1,135 1,382 1,287 461 434 351 SD (mg/kg of milk) 132 161 338 14 22 113 96 152 110 204 124 109 98 CV (%) 11 12 23 13 19 10 9 13 8 16 27 25 28 Minim um (mg/kg of milk) 1,028 919 1,002 85 77 868 880 862 1,132 819 316 283 250 Maxim um (mg/kg of milk) 1,457 1,748 1,962 134 157 1,312 1,302 1,367 1,607 1,595 811 674 631 Range (mg/kg of milk) 429 828 961 49 80 444 423 505 474 776 495 391 382
quently, the MIR predictions of Ca and P are linked to the content of fat, which was expected because the cor-relations between Ca or P and fat were positive (Table 5). The greatest correlations observed between 1,743 and 1,747 cm−1 were related to the carbonyl group of ester bonds present in milk fat and organic acid. The spectral zone between 1,446 and 1,470 cm−1 is charac-terized by CH2 and CH3 groups present in milk fat and proteins (Coates, 2000). The high correlation located at 1,242 cm−1 is related to the P=O bond present in phos-pholipids (Bertrand and Dufour, 2006). The spectral zones known between Ca and the carboxylate group of casein at 1,410 cm−1 and 1,575 cm−1 (Byler and Farrell, 1989) did not show high correlation (R = 0.46 and R = 0.41, respectively). Upreti and Metzger (2006) studied the feasibility of developing calibration equations to measure organic P and bound Ca in Cheddar cheese. These authors based on the previous work of Fernan-dez et al. (2003) limited the development of calibration equations to spectral data between 1,050 and 900 cm−1.
In this region, Upreti and Metzger (2006) observed a region from 956 to 946 cm−1 related to the concen-tration of organic P. The region located around 980 cm−1 observed by those authors seemed to be related to bound Ca. In our study, these regions were not the most interesting for the measurement of Ca and P by MIR spectrometry.
COnCLuSIOnS
This study showed the feasibility of predicting the contents of Ca and P by MIR spectrometry. The results obtained for the calibration equations that predict the Mg content indicated the need to increase the number of reference samples analyzed by ICP-AES used for the calibration procedure. The method used to measure mineral content (ICP-AES without mineralization) was inappropriate to determine the Na concentration in milk. As the calibration equations are strongly influ-enced by the reference values used, this inability could
Table 3. Uncertainty of samples analyzed by inductively coupled plasma atomic emission spectroscopy (ICP-AES) without mineralization stage
Source of uncertainty (%) Calcium Magnesium Phosphorus Potassium Sodium
Repeatability 1.92 1.35 1.83 2.52 1.81 Recuperation 4.94 3.21 3.32 3.48 2.76 Weighting 1.02 1.02 1.02 1.02 1.02 Dilution 0.01 0.01 0.01 0.01 0.01 ICP-AES 0.69 1.05 0.56 1.92 1.59 Stock solution 0.30 0.18 0.29 0.36 0.18 Dilutions of standard 0.62 0.92 0.62 0.56 0.69 Purity of CRM1 0.86 2.19 1.35 1.24 0.82 Total uncertainty 5.55 4.47 4.25 5.02 3.95
1CRM = certified reference milk (Community Bureau of Reference, Brussels, Belgium).
Table 4. Statistics1 for the calibration equations developed for the prediction of Ca, Na, P, K, and Mg
Element n Mean SD SEC R2c SECV R2cv RPD
First calibration set
Ca 31 1,196 133 25 0.96 55 0.77 2.41
K 31 1,390 102 71 0.52 91 0.23 1.12
Mg 31 108 14 9 0.54 10 0.50 1.39
Na 31 450 108 45 0.82 52 0.77 2.07
P 31 1,077 113 13 0.99 47 0.83 2.40
First and second calibration sets
Ca 57 1,252 157 54 0.88 71 0.80 2.22
Na 57 431 102 42 0.83 56 0.70 1.81
P 57 1,071 107 32 0.91 50 0.79 2.15
Total of analyzed samples
Ca 87 1,333 260 78 0.91 95 0.87 2.74
K 61 1,336 168 82 0.76 136 0.36 1.24
Mg 61 110 18 7 0.85 11 0.65 1.68
Na 87 403 107 48 0.80 64 0.65 1.68
P 87 1,093 127 42 0.89 50 0.85 2.54
1SEC = standard error of calibration; R2c = calibration coefficient of determination; SECV = standard error of cross-validation; R2cv =
partly explain the poor prediction by MIR observed for this mineral. Finally, the prediction of K by MIR was not possible.
As MIR spectrometry is used routinely by the milk labs to estimate the contents of the major milk compo-nents such as the percentage of fat and protein (used for milk payment and milk recording), implementation of the developed equations to estimate the concentra-tions of Ca and P in milk could be interesting for dairy farmers to give added value to the produced milk and to improve cheese properties.
aCKnOWLeDGmentS
The authors acknowledge the financial support pro-vided through grants 2.4507.02F (2), F.4552.05, and 2.4623.08 of the National Fund for Scientific Research (Brussels, Belgium). Nicolas Gengler, research associate at the National Fund for Scientific Research (Brussels, Belgium) acknowledges its support.
reFerenCeS
Bertrand, D., and E. Dufour. 2006. La Spectroscopie Infrarouge et Ses Applications Analytiques. 2nd ed. Lavoisier Tec et Doc, Paris, France.
Byler, D. M., and H. M. Farrell. 1989. Infrared spectroscopic evidence for calcium ion interaction with carboxylate groups of casein. J. Dairy Sci. 72:1719–1723.
Cerbulis, J., and H. M. Farrell. 1976. Composition of the milks of dairy cattle. II. Ash, calcium, magnesium, and phosphorus. J. Dairy Sci. 59:589–593.
Coates, J. 2000. Interpretation of infrared spectra, a practical approach. Pages 10815–10837 in Encyclopedia of Analytical Chemistry. R. A. Meyers, ed. John Wiley & Sons, New York, NY.
Davis, S. R., V. C. Farr, S. O. Knowles, J. Lee, E. S. Kolver, and M. J. Auldist. 2001. Sources of variation in milk calcium content. Aust. J. Dairy Technol. 56:156.
Devriese, S., I. Huybrechts, M. Moreau, and H. Van Oyen. 2006. Enquête de consommation alimentaire Belge A – 2004. Institut Scientifique de Santé Publique. ISP/EPI Reports. http://www. iph.fgov.be/epidemio/epifr/foodfr/table04.htm. Accessed Sep. 2, 2008.
Fernandez, C., S. F. Ausar, R. G. Badini, L. F. Castagna, I. D. Bianco, and D. M. Beltramo. 2003. An FTIR spectroscopy study of the interaction between alpha s-casein-bound phosphosyryl group and chitosan. Int. Dairy J. 13:897–901.
Frank, I. E., J. Feikema, N. Constantine, and B. R. Kowalski. 1984. Prediction of product quality from spectral data using the partial least-squares method. J. Chem. Inf. Comput. Sci. 24:20–24. Gerrior, S., and L. Bente. 2002. Nutrient content of the US food
supply, 1909–1999: A summary report. Center for Nutrition Policy and Promotion, USDA, Washington, DC.
Guéguen, L., and A. Pointillart. 2000. The bioavailability of dietary calcium. J. Am. Coll. Nutr. 19:119S–136S.
Harmon, R. J. 1994. Physiology of mastitis and factors affecting somatic cell counts. J. Dairy Sci. 77:2103–2112.
Heaney, R. P. 2000. Calcium, dairy products and osteoporosis. J. Am. Coll. Nutr. 19:83S–99S.
Huth, P. J., D. B. DiRienzo, and G. D. Miller. 2006. Major scientific advances with dairy foods in nutrition and health. J. Dairy Sci. 89:1207–1221.
International Committee for Animal Recording. 2004. Section 2. ICAR rules, standards and guidelines for dairy production record-ing. http://www.icar.org/docs/Rules%20and%20regulations/ Figure 4. Relation between the reference contents of calcium and
phosphorus measured by inductively coupled plasma atomic emission spectroscopy and prediction of Ca and P by mid-infrared spectrometry using the second calibration equation established for Ca and P for the samples selected for the third calibration set.
Table 5. Correlations between the contents of Ca and P measured by inductively coupled plasma atomic emission spectroscopy (ICP-AES) and the known milk components predicted by mid-infrared spectrometry (contents of fat, protein, urea, and lactose)
Component Calcium Phosphorus
Phosphorus (mg/kg of milk) 0.73
Percentage fat (g/dL of milk) 0.72 0.62
Percentage protein (g/dL of milk) 0.64 0.70
Percentage lactose (g/dL of milk) 0.25 0.19
Urea (mg/kg of milk) −0.22 −0.02
Guidelines/Guidelines_2005_final_low_resolution.pdf Accessed Nov. 17, 2005.
Lanou, A. J., S. E. Berkow, and N. D. Barnard. 2005. Calcium, dairy products, and bone health in children and young adults: A reevaluation of the evidence. Pediatrics 115:736–743.
Martens, H., and S. A. Jensen. 1982. Partial least squares regression: A new two-stage NIR calibration method. Pages 607–647 in Proc. 7th World Cereal and Bread Congress, Prague. K. Holas, ed. Elsevier, Amsterdam, the Netherlands.
Martens, H., and T. Naes. 1987. Multivariate Calibration by Data Compression. Wiley, Chichester, UK.
Mouillet, L., F. M. Luquet, and J. Casalis. 1975. Contribution à l’étude des variations de la teneur en sels minéraux du lait de vache dans différentes regions françaises. Lait 55:683–694.
Murcia, M. A., A. Vera, M. Martinez-Tome, A. Munoz, M. Hernandez-Cordoba, and R. Ortiz-Gonzalez. 1999. Fast determination of the Ca, Mg, K, Na and Zn contents in milk and non-dairy imitation milk using ICP-AES without mineralization stage. Lebens. Wiss. Technol. 32:175–179.
Nobrega, J. A., Y. Gelinas, A. Krushevska, and R. M. Barnes. 1997. Direct determination of major and trace elements in milk by inductively coupled plasma atomic emission and mass spectrometry. J. Anal. At. Spectrom. 12:1243–1246.
Roulez, D. 2001. Contribution à la mise en service d’un spectromètre d’émission atomique couplé à un plasma induit : Études de diverses matrices. MS thesis. Haute Ecole Charleroi-Europe, Charleroi, Belgium.
Skoog, D. A., D. M. West, and F. J. Holler. 1997. Chimie Analytique. 7th ed. De Boeck Université, Brussels, Belgium.
Upreti, P., and L. E. Metzger. 2006. Utilization of Fourier transform infrared spectroscopy for measurement of organic phosphorus and bound calcium in Cheddar cheese. J. Dairy Sci. 89:1926–1937. Westerhaus, M. O. 1990. Improving repeatability of NIR calibrations
across instruments. Pages 671–674 in Proc. 3rd Int. Conf. Near Infrared Spectroscopy, Brussels, Belgium. Agricultural Research Centre, Gembloux, Belgium.
Williams, P. 2007. Near-infrared technology—Getting the best out of light. PDK Grain, Namaimo, Canada.