International Forum on Aeroelasticity and Structural Dynamics IFASD 2017 25-28 June 2017 Como, Italy
DYNAMIC STALL ONSET VARIATION WITH REDUCED
FREQUENCY FOR THREE STALL MECHANISMS
Boutet Johan1, Dimitriadis Grigorios1, Amandolese Xavier2 1Aerospace and Mechanical Engineering Department
University of Li`ege
Quartier Polytech 1, All´ee de la d´ecouverte, 9, 4000 Li`ege, Belgium. [email protected]
2LadHyX, CNRS-Ecole Polytechnique, F-91128 Palaiseau, France
Conservatoire National des Arts et M´etiers, F-75141 Paris, France [email protected]
Keywords: Dynamic stall, Leading Edge Vortex, Wind tunnel testing
Abstract: A set of unsteady aerodynamic load measurement is performed on three oscillating airfoils with distinct stall mechanisms: a flat plate, a NACA0012, and a NACA0018. The airfoils are forced to oscillate in pitch around the stall angle of attack with prescribed frequency and amplitude. A criterion proposed by Sheng et al. [1–3] is used to locate the onset of the flow separation process associated with dynamic stall, and quantify its variation with an equivalent reduced pitch rate. The validity of this criterion is tested for the three airfoils at low Reynolds number, Re = 2 × 10⁴. Results are compared with the experimental data obtained by Sheng et al. at higher Reynolds number of Re = 1.5 × 10⁶.
1 INTRODUCTION
The current popularity of small unmanned aerial vehicles has created significant interest in steady and unsteady aerodynamics at very low to moderate Reynolds numbers, i.e. O (102 −
104). In particular, the development of micro-drones based on flapping or rotating wings re-quires a new focus on the dynamic stall process and model at such Reynolds numbers. The Leishman-Beddoes [4] (LB) dynamic stall model is a popular model mainly used for helicopter and wind turbine applications and tuned for mach numbers superior to 0.3. Sheng et al. [1–3] showed that at lower airspeeds the LB model required modifications in order to correlate better with experimental results.
The dynamic stall process has been widely studied [5–11] and the main characteristics of the flow topology and associated unsteady airloads can be found in Leishman [12]. An important issue in dynamical stall modelling is to predict the delay in the onset of flow separation and thus the starting of dynamic stall process that can be amplified if a leading edge vortex convection is involved.
In their original work Leishman and Beddoes [4] proposed an onset criterion that proved to be inaccurate for low airspeed. Instead, Sheng et al. [1–3] proposed a new criterion using experimental unsteady aerodynamic data to locate the instantaneous angle of attack at which dynamic stall initiates and to assess the variation of this angle of attack with reduced frequency and amplitude of vibration.
Sheng et al. used experimental data obtained at Reynolds numbers of the order of Re ' 106. The present work aims to assess the validity of the Sheng et al dynamic stall criterion at a much lower Reynolds number of Re ' 104. This validity is assessed for three airfoils that exhibit
distinct stall mechanisms : a flat plate, a NACA 0012, and a NACA 0018. 2 EXPERIMENTAL SETUP
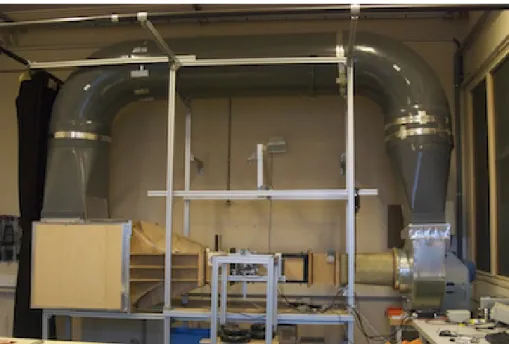
The experiments were performed in a closed-loop subsonic wind tunnel at LadHyX laboratory, which has a rectangular test-section 0.26 m wide and 0.24 m high, see figure 1.
Figure 1: LadHyx Closed-loop subsonic wind tunnel
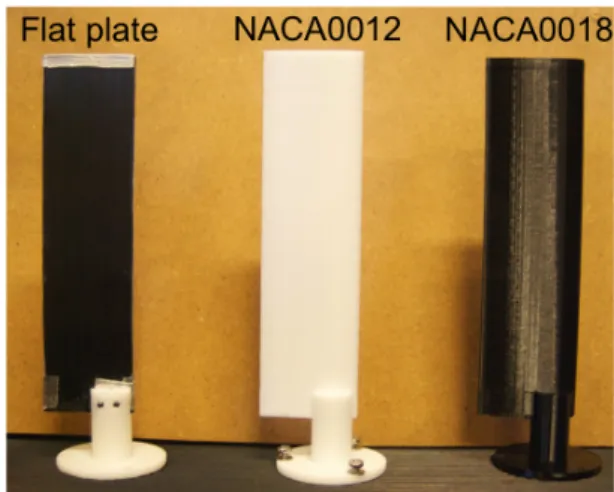
2.1 Three wings models
Three models were chosen for the experiments: a flat plate, a NACA0012 and a NACA0018. They are shown in figures 2 and 3. The flat plate model was made from a carbon fiber plate of span 130 mm, chord 35 mm and thickness 1.5 mm. This model featured a rectangular cross section with a thickness-to-chord ratio of 4.3%. No modifications were made to the leading and trailing edges, so that they remained sharp. The NACA0012 and NACA0018 models of span 130 mm and chord length 40 mm were produced by means of 3D printing. The residual roughness caused by the 3D printing process is close to 0.25 percent of the chord length. Each model was mounted horizontally in the test section. A small distance from the wall was allowed at one end to limit boundary layer perturbations. An end plate was installed at the other extremity of the model to ensure a two-dimensional flow.
2.2 Measurement setup
The harmonic pitching motion was directly driven by a brushless motor (Maxon flat motor EC 60, 100W). The motor was controlled by a digital positioning controller (EPOS2 24/5) using proportional/integral/derivative (PID) control.
Figure 2: Side view of the tested wings.
Figure 3: Top view of the tested wings.
Wing Chord [mm] Span [mm]
Flat plate 35 130
NACA0012 40 130
NACA0018 40 130
Table 1: Wings dimensions
Figure 4: NACA0012 in mounted configuration
in-side the wind tunnel. Figure 5: Angle measurement setup.
The unsteady loads acting on the wings were measured by a six-axis force/torque sensor (ATI Nano43) mounted between the motor and the models. A 24-bit data acquisition system fur-nished by Muller- BBM was used to receive the analog transducer signals and convert them to force and moment using the calibration matrix provided by ATI. A laser displacement sensor (Keyence LB-11W) was used to measure the instantaneous angle of attack synchronously with the unsteady forces and moment. All data were recorded with a sampling rate of 1024 kHz and the acquisition time was equal to or higher than 50 times the period of the harmonic pitching motion.
2.3 Data processing
Direct unsteady force measurements on moving models are subjected to two types of error. The first source is the natural vibration of the wing and motor supports, which in this case were designed as light and as stiff as possible. The second source of error involves the combination of static weight and dynamic inertia effects. Dynamic tare subtraction and low-pass filtering were applied to the data during post-processing in order to removes these errors. Dynamic tare was systematically identified at zero wind conditions prior to each dynamic test of a given amplitude and frequency of motion. A brick-wall low-pass filter was used to filter the dynamic loops at frequencies above 40 Hz. This cut-off frequency eliminated the first resonance frequency of the full setup, while it preserved up to the 10th harmonic of the oscillation frequency. For
each prescribed pitching motion (i.e. each set of amplitude and frequency values), the unsteady measurement process can be summarized as follows:
1. Dynamic tare identification (same process as 2-4 but at zero wind condition).
2. Synchronous measurement of the pitching motion, normal force, chordwise force and pitching moment (Figures 6(a), 6(b), 6(e)).
3. Low pass filtering (Figures 6(c), 6(f)).
4. Identification of the forces and moment statistics over at least 50 consecutive cycles of motion (Figures 6(d), 6(g)).
5. Subtraction of the dynamic tare (Figures 6(h)).
6. Calculation of the resulting dynamic loops for the normal, chordwise and moment coeffi-cients (Figures 6(i)).
The statistics used to show the results are the median, and the interquartile region defined as the area between the first and third quartile. At each aligned point of the cycles :
• The first quartile is the value separating the lower 25% aligned cycles values. • The median is the cycle value separating the lower 50% aligned cycles values. • The third quartile is the cycle value separating the lower 75% aligned cycles values. This process is demonstrated for the normal force measurement in Figure 6 for a pitching motion of amplitude 15◦, reduced frequency k = 0.045 (dimensional frequency f = 2.5 Hz) and wind tunnel mean velocity U = 7 m/s. It must be noted that the wind-off load measurements included added mass aerodynamic effects but their amplitude was negligible at such low reduced frequencies. Structural inertial loads constituted the only measurable load component at U = 0 m/s.
3 STEADY RESULTS
At low mach number and moderate Reynolds number, O (106), three type of stall behavior can be observed depending on the airfoil geometry [12, 13]: thin airfoil stall, leading edge stall and trailing edge stall. Thin airfoil stall occurs for low thickness to chord ratio airfoil or flat plate. It is characterized by a smooth stall behavior preceded by a leading edge flow separation which increases gradually with the angle of attack until the flow completely separates from the upper surface. Leading edge stage is typical of the NACA0012 airfoil section. It is characterized by an increased linear region followed by a sharp breaks in lift and moment due to an abrupt flow separation near the leading edge. The trailing edge stall can be observed on thicker airfoil section such as the NACA0018. It produces a smoother stall in lift and moment due to the progressive separation of the flow from the trailing edge toward the leading edge.
A first set of experiments was carried out in order to measure the steady aerodynamic charac-teristics of our flat plate, NACA0012 and NACA0018 section models at low Reynolds number Re ' 2 × 10⁴. The measurements concerned the normal and chordwise force coefficients and the pitching moment coefficient about the quarter chord for angle of attack ranged from 0◦ to 45◦. The results are shown in Figure 7. For each fixed angle of attack, the average values of the load coefficients were calculated from 10 seconds of measurements acquired at a sampling frequency of 1024 Hz.
According to the steady normal and moment coefficient evolution with the angle of attack it seems that the flat plate, NACA0012 and NACA0018 airfoils still show different types of stall
0 1 2 3 4 5 −5 0 5 10 15 20 25 Time [s] A n g le [ ◦]
(a) Measured angle of attack
0 1 2 3 4 5 −0.5 0 0.5 1 1.5 Time [s] C N [-]
(b) Unfiltered normal force
0 1 2 3 4 5 −0.5 0 0.5 1 1.5 Time [s] C N [-]
(c) Filtered normal force
0 0.1 0.2 0.3 0.4 −0.5 0 0.5 1 1.5 Time [s] C N [-]
(d) Dynamic cycle median with in-terquartile envelope 0 1 2 3 4 5 −0.4 −0.3 −0.2 −0.1 0 0.1 0.2 0.3 Time [s] C N [-]
(e) Dynamic tare unfiltered normal force 0 1 2 3 4 5 −0.05 0 0.05 0.1 0.15 0.2 Time [s] C N [-]
(f) Dynamic tare filtered normal force 0 0.1 0.2 0.3 0.4 −0.05 0 0.05 0.1 0.15 0.2 Time [s] C N [-]
(g) Dynamic tare cycle median with interquartile envelope 0 0.1 0.2 0.3 0.4 −0.5 0 0.5 1 1.5 Time [s] C N [-]
(h) Aerodynamic normal force versus time
−5 0 5 10 15 20 25 −0.5 0 0.5 1 1.5 Angle[◦] C N [-]
(i) Aerodynamic normal force versus instantaneous pitch angle
Figure 6: Summary of the unsteady measurement process for a NACA0012 airfoil with a pitching motion of am-plitude 15◦, a reduced frequency k = 0.045 (dimensional frequency f = 2.5 Hz), and mean velocity U = 7 m/s.
0 10 20 30 40 −0.2 0 0.2 0.4 0.6 0.8 1 1.2 Angle[◦] C N [-] Flat plate NACA0012 NACA0018
(a) Normal lift coefficient
0 10 20 30 40 0.16 0.14 0.12 0.1 0.08 0.06 0.04 Angle[◦] C C [-] Flat plate NACA0012 NACA0018
(b) Chordwise force coefficient
0 10 20 30 40 −0.25 −0.2 −0.15 −0.1 −0.05 0 0.05 Angle[◦] C M [-] Flat plate NACA0012 NACA0018 (c) Moment coefficient Figure 7: Comparison of steady forces and moment measurement for the three models.
at low Reynolds number. The flat plate exhibits a very smooth stall behavior for which the normal force smoothly moves away from the linear evolution with neither local maximum nor decreasing region. An estimate of the static stall angle of attack can be obtained from the pitch-ing moment change of slope durpitch-ing the upstroke and uspitch-ing the “0.05 drop in CM” criterion.
This gives a static stall angle of attack close to 5.5◦. The NACA0012 shows a sharper drop in the normal lift and moment coefficients, which is characteristic of leading edge stall. Re-garding the chordwise coefficient evolution with the angle of attack a criteria based on a local minimum can be used to quantify the static angle of attack at which the flow separation process initiates. It is close to 6.6◦ and leads to a local maximum normal coefficient for an angle of attack close to 9.5◦. Finally, the NACA0018 exhibits an intermediate stall behavior. According the the steady chordwise force the initiation of the flow separation process is closed to 6◦ but unlike the NACA0012 airoil the lift increasing with the angle of attack stop beyond that point. An interaction between a trailing edge stall mechanism and a leading edge laminar separation bubble might be responsible for this low Reynolds number behavior.
4 DYNAMIC RESULTS
4.1 Equivalent reduced frequency
The main idea behind the Sheng et al. dynamic stall criterion is that the onset angle of attack depends on the reduced pitch rate r0 for pitch ramp-up tests [1, 3] and an equivalent reduced pitch rate r for oscillating tests [2]. For pitch ramp motion the reduced pitch rate is defined as
r0 = α˙ b
U (1)
where, α is the pitch angle, ˙α is the constant pitch rate, b is the airfoil half chord and U is the free stream speed. For harmonic pitching motion the equivalent reduced pitch rate is defined as the maximum reduced pitch rate:
r = ˙αmaxUb = AωUb = Ak (2)
where, α = A0+ A sin(ωt) is the oscillating pitch angle in radians, A0 is the mean angle, A is
the amplitude, ω is the angular frequency, and k = ωbU is the reduced frequency. 4.2 Prescribed pitch motion
The frequency of the pitch oscillations was chosen as f = [1, 2.5, 5, 7.5, 10] Hz. The mean pitch angle was always set to A0 = 10◦and the oscillation amplitude to A = [5, 10, 15, 20]◦. As
a consequence, the maximum 2D wind tunnel blockage coefficient, defined as 2b sin(30◦)/Hv,
where Hv is the height of the test section, was always less than 8.4%. Therefore, no blockage
corrections were used throughout the present study. Higher frequency and amplitude combina-tions were not possible due to motor limitacombina-tions.
The reduced frequency and equivalent pitch rate are shown on Table 2 for the NACAs and Table 3 for the flat plate.
f [hz] 1 2.5 5 7.5 10 k [−] 0.0168 0.0419 0.0838 0.1257 0.1776 A = 5 0.0015 0.0037 0.0073 0.011 0.0146 A = 10 0.0029 0.0073 0.0146 0.0219 0.0292 A = 15 0.044 0.011 0.0219 0.0329 0.0439 A = 20 0.0058 0.0146 0.0292 0.0439 0.0585
Table 2: Table of the equivalent reduced pitch rate for the NACAs in function of the frequency and amplitude of vibration.
All tests were carried out at a Reynolds number of Re = 1.5 × 10⁴., i.e. a mean flow velocity
of U ' 7.5m/s for the flat plate and U ' 7.25m/s for the two NACA wings, for which the non-uniformity of the mean flow velocity in the test section was less than 1% and the turbulence level was close to 1.2%.
f [hz] 1 2.5 5 7.5 10 k [−] 0.0152 0.0379 0.0758 0.1137 0.1517 A = 5 0.0013 0.0033 0.0066 0.099 0.0132 A = 10 0.0026 0.0066 0.0132 0.0199 0.0265 A = 15 0.04 0.099 0.0199 0.0298 0.0397 A = 20 0.0053 0.0132 0.0265 0.0397 0.0529
Table 3: Table of the equivalent reduced pitch rate for the flat plate in function of the frequency and amplitude of vibration.
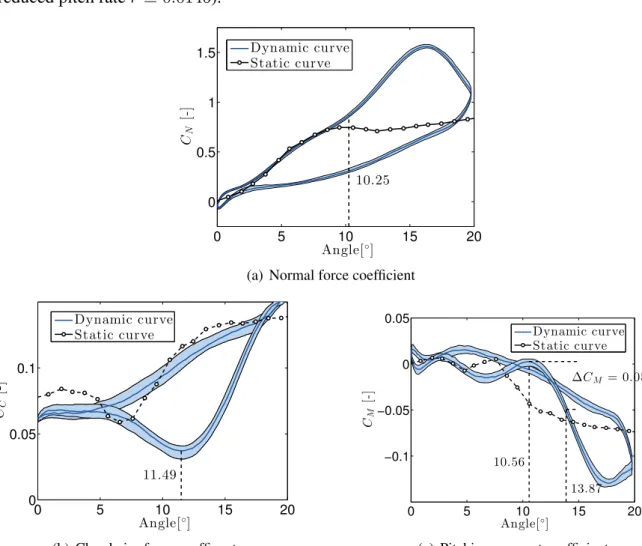
4.3 NACA0012
Figures 8(a), 8(b), and 8(c) show an example of the median and interquartile envelope for the normal force, chordwise force, and pitching moment coefficients responses to oscillations in pitch with mean angle of attack A0 = 10◦, amplitude A = 10◦ and frequency f = 5 Hz,
(reduced pitch rate r ' 0.0146).
0 5 10 15 20 0 0.5 1 1.5 Angle[◦] C N [-] Dynamic curve Static curve 10.25
(a) Normal force coefficient
0 5 10 15 20 0.1 0.05 0 Angle[◦] C C [-] Dynamic curve Static curve 11.49
(b) Chordwise force coefficent
0 5 10 15 20 −0.1 −0.05 0 0.05 Angle[◦] CM [-] Dynamic curve Static curve ∆CM = 0.05 13.87 10.56
(c) Pitching moment coefficient
Figure 8: Aerodynamic loads for a NACA0012 oscillating with amplitude A = 10◦, frequency f = 5 Hz and mean angle A0= 10◦.
• A change of slope in the normal force coefficient.
• A local maximum in the upstroke section of the chordwise force coefficient, although the current results showed a local minimum instead.
• A ∆CM = 0.05 drop of the pitching moment coefficient.
Regarding the results reported on figures 8(a), 8(b), and 8(c) the more robust criterion to localize the dynamic stall onset is here clearly the local minimum on the chordwise force and we will then focus on this one.
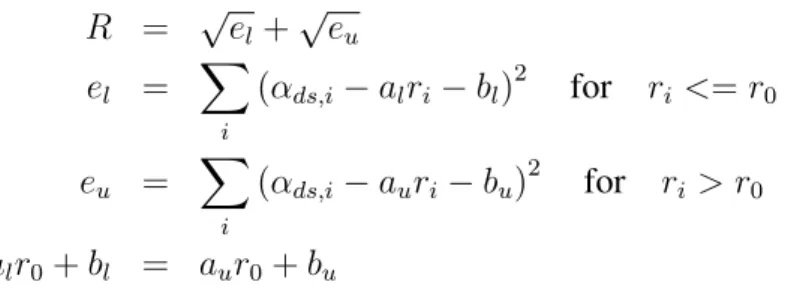
Figure 9 plots the dynamic stall onset angle αds as a function of the equivalent reduced pitch
rate for the NACA0012. The cloud of point is clearly bilinear and can be curve-fitted as two straight lines intersecting at point r = r0. The equations of the lower and upper lines are simply
α = alr + bl, α = aur + bu
where al, bl, auand buare unknown coefficients to be determined through a least squares curve
fit, while eland eu are the curve fit errors. The fitting constraints are given by :
R = √el+ √ eu el = X i (αds,i− alri− bl)2 for ri <= r0 eu = X i (αds,i− auri− bu)2 for ri > r0 alr0+ bl = aur0+ bu
where the residual R should be as low as possible. The al, bl, au and bu coefficients are
com-puted using a least squares approach for a given r0. The least square fit is repeated for different
r0 in order to minimize R, as shown in figure 10.
0 0.02 0.04 0.06 6 8 10 12 14 16 18 20
Equivalent reduced pitch r [−]
α [ ◦ ] Experimental data Linear regression r0= 0.015
Figure 9: Bilinear least square regression of the dy-namic stall onset for the NACA0012.
0.01 0.02 0.03 0.04 0.05 0.06 3.5 4 4.5 5 5.5 6 6.5 r0 [-] R es id u a l [ ◦]
Figure 10: Bilinear least square regression residual in function of r0.
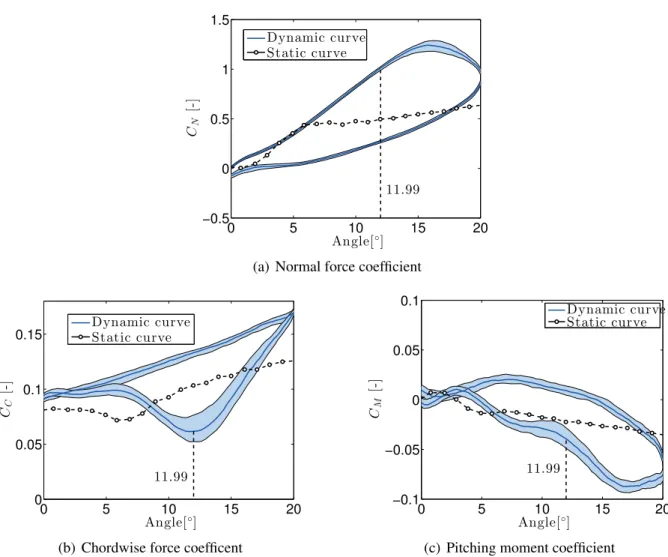
4.4 NACA0018
Figures 11(a), 11(b), and 11(c) show an example of the median and interquartile envelope for the normal force, chordwise force, and pitching moment coefficients for the NACA0018 airfoil.
0 5 10 15 20 −0.5 0 0.5 1 1.5 Angle[◦] C N [-] Dynamic curve Static curve 11.99
(a) Normal force coefficient
0 5 10 15 20 0.15 0.1 0.05 0 Angle[◦] C C [-] Dynamic curve Static curve 11.99
(b) Chordwise force coefficent
0 5 10 15 20 −0.1 −0.05 0 0.05 0.1 Angle[◦] C M [-] Dynamic curve Static curve 11.99
(c) Pitching moment coefficient
Figure 11: Aerodynamic loads for a NACA0018 oscillating with amplitude A = 10◦, frequency f = 5 Hz and mean angle A0= 10◦.
The test case plotted in the figures concerns an oscillation with mean angle A0 = 10◦, amplitude
A = 10◦and frequency f = 5 Hz, (reduced pitch rate r ' 0.0146).
As in the case of the NACA0012 airfoil the only criterion that results in a clear estimate of the dynamic stall onset angle is the minimum in the chordwise force coefficient. For results shown in figure 11, the value of the dynamic stall onset angle of attack is close to 12◦. Figure 12 plots the variation of this dynamic stall angle of attack with the equivalent reduced pitch rate along with the best bilinear curve fitting. Note that, as in the case of the NACA 0012, the break point between the two straight lines is located at r0 = 0.015.
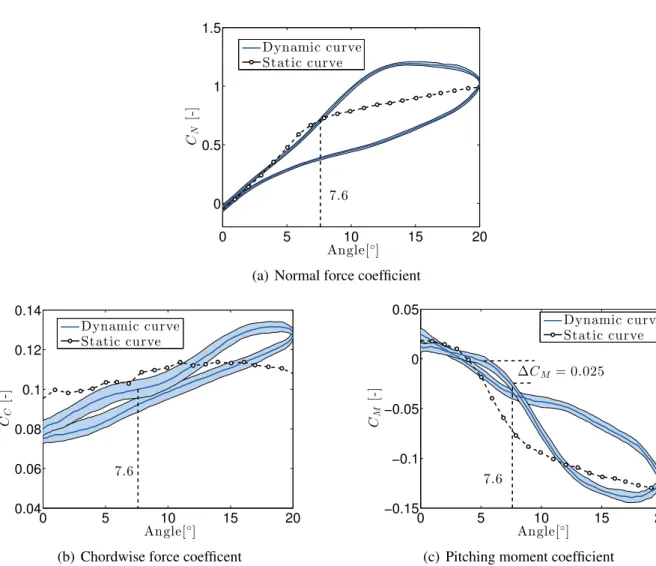
4.5 Flat plate
Figures 13(a), 13(b) and 13(c) show an example of the median and interquartile envelope for the normal force, chordwise force, and pitching moment coefficients of the flat plate wing. The oscillation has a mean angle of A0 = 10◦, an amplitude of A = 10◦ and a frequency of f = 5
Hz, (reduced pitch rate r ' 0.0132).
These results show that none of the Sheng et al. criteria for determining dynamic stall onset are clearly noticeable. There is no change of slope in figure 13(a) and there is no maximum
0 0.01 0.02 0.03 0.04 0.05 5
10 15 20
Equivalent reduced pitch r [−]
α d s [ ◦] Experimental data Linear regression r0= 0.015
Figure 12: Bilinear least square regression of the dynamic stall onset for the NACA0018
0 5 10 15 20 0 0.5 1 1.5 Angle[◦] C N [-] Dynamic curve Static curve 7.6
(a) Normal force coefficient
0 5 10 15 20 0.14 0.12 0.1 0.08 0.06 0.04 Angle[◦] C C [-] Dynamic curve Static curve 7.6
(b) Chordwise force coefficent
0 5 10 15 20 −0.15 −0.1 −0.05 0 0.05 Angle[◦] C M [-] Dynamic curve Static curve 7.6 ∆CM = 0.025
(c) Pitching moment coefficient
Figure 13: Aerodynamic loads for a flat plate oscillating with amplitude A = 10◦, frequency f = 5 Hz and mean angle A0= 10◦.
or minimum in the upstroke of the chordwise force on figure 13(b). Furthermore, the change of slope in the pitching moment curve in figure 13(c) is shallow and applying the ∆CM drop
However, looking at the Cccurves for all equivalent reduced frequencies reveals a trend.
• At low r, no special features can be seen in these graphs.
• At medium r, an inflection point starts to appear, as seen on figure 13(b).
• At high r, the inflection point bifurcates into a local minimum, as in the cases of the NACA 0012 and 0018 wings.
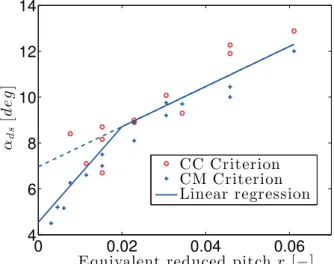
A new dynamic stall onset criterion can be defined, based on the inflection point on Cc, plotted
by circles in figure 14. Unfortunately this criterion cannot be used for equivalent reduced pitch rates lower than 0.01. An alternative criterion based on a ∆CM = 0.025 drop after the change
of the moment coefficient slope occurring during the upstroke has then be validated for high reduced pitch rate and used for reduced pitch rate lower than 0.01. This moment coefficient criterion can be shown in figure 13(c).
Figure 14 shows that the Ccand CM criteria give qualitative agreement for dynamic stall onset
angle for r > 0.01, as the drop value ∆CM = 0.025 was calibrated in this high reduced pitch
rate area. The advantage of the CM criterion is that it also estimates dynamic stall onset for
r < 0.01. 0 0.02 0.04 0.06 4 6 8 10 12 14
Equivalent reduced pitch r [−]
α d s [d e g ] CC Criterion CM Criterion Linear regression
Figure 14: Bilinear least square regression of the dynamic stall onset for the flat plate
Finally, it should be noted that the CM criterion results in a bilinear variation of dynamic stall
onset angle with equivalent reduced pitch rate, as for the NACA 0012 and 0018 wings. However, the break in the two straight lines occurs at the higher value of r0 = 0.02.
4.6 Discussion
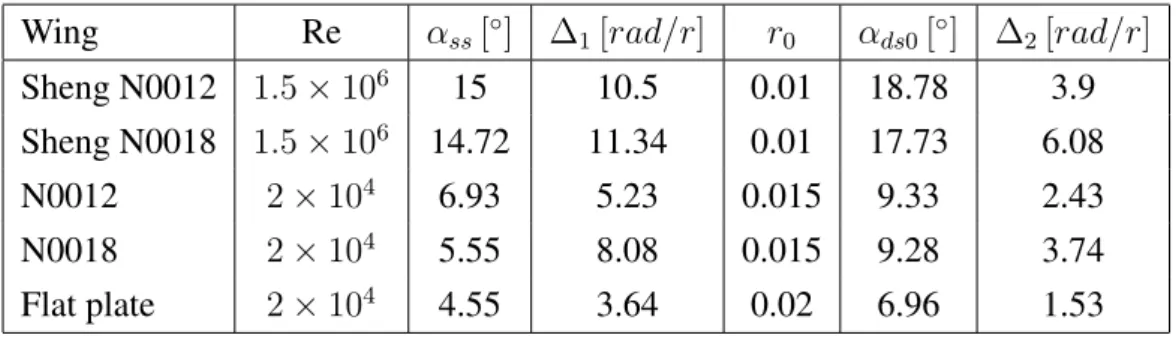
Figure 15 compares the dynamic stall onset angle obtained by Sheng et al. for the NACA0012 and NACA0018 airfoil at a Reynolds number of Re = 1.5 × 10⁶to the ones obtained during the present study for Re = 2 × 10⁴. Table 4 is a quantitative summary of figure 15, created using the definitions of Figure 16. In this scheme, αssis the static stall angle, αds0 is the dynamic stall
onset angle at r0, ∆1is the slope of the lower straight line and ∆2that of the upper straight line.
Figure 15 and table 4 first show that the separation process occurs at lower angle of attack in the present study. A overall drop of almost 10◦ is observed between the NACA results for Re = 1.5 × 10⁶ and Re = 2 × 10⁴. Meanwhile if the qualitative behavior is bilinear for all
0 0.02 0.04 0.06 0 5 10 15 20 25 30
Equivalent reduced pitch r [−]
α [d e g ] Sheng N0018 Sheng N0012 Flat plate N0012 N0018
Figure 15: Summary of the dynamic stall onset change with equivalent reduced pitch rate. r [-] α d s [ ◦]
∆
1r
0∆
2α
ds0α
ssFigure 16: Schematic graph describing data value given in Table 4
Wing Re αss[◦] ∆1[rad/r] r0 αds0[◦] ∆2[rad/r]
Sheng N0012 1.5 × 10⁶ 15 10.5 0.01 18.78 3.9
Sheng N0018 1.5 × 10⁶ 14.72 11.34 0.01 17.73 6.08
N0012 2 × 10⁴ 6.93 5.23 0.015 9.33 2.43
N0018 2 × 10⁴ 5.55 8.08 0.015 9.28 3.74
Flat plate 2 × 10⁴ 4.55 3.64 0.02 6.96 1.53
Table 4: Summary Table
airfoils one can notice some difference due to the Reynolds number and the airfoil geometry. The values of both the ∆1 and ∆2 slopes are significantly lower in the present study and one
can also observe an increases of the equivalent pitch rate at which the bilinear break occurs decreasing the Reynolds number. Regarding the airfoil geometry one can observe that, unlike for Re = 1.5 × 10⁶ the slope of the low pitch rate linear fitting curve ∆
1is significantly higher
for the NACA0018. The flat plate is also the airfoil exhibiting the less pronounced dynamic stall with ∆1and ∆2 values more than half those reported for the NACA0018.
5 CONCLUSIONS
This work has demonstrated that the Sheng et al. criterion (based on the chordwise force coeffi-cient) can be used for determining the onset of dynamic stall for the NACA0012 and NACA0018 airfoils at low Reynolds numbers, i.e. O (104). Pinpointing the dynamic stall onset angle of at-tack for the flat plate is less straightforward. The reason for this difficulty is not clear yet, although it might be related to the fact that the dynamic stall process for the flat plate is more smooth and does not involve a strong leading edge vortex.
The variation of the dynamic stall onset angle of attack with equivalent reduced pitch rate was quantified and compared to the measurements by Sheng et al. The two sets of results are in qualitative agreement, showing a bilinear variation that features an intersection close to r = 0.015 for both the NACA airfoils and r = 0.02 for the flat plate. However, decreasing the
Reynolds number from Re = 1.5 × 10⁶ to Re = 2 × 10⁴ leads to a significant reduction in the static angle of attack and in the slopes of the bilinear relationships.
6 ACKNOWLEDGMENTS
The authors would like to acknowledge the financial support of the European Union (ERC Starting Grant NoVib 307265) and the technical support provided by the LadHyX.
7 REFERENCES
[1] Sheng, W., Galbraith, R. A., and Coton, F. N. (2008). A Modified Dynamic Stall Model for Low Mach Numbers. Journal of Solar Energy Engineering, 130(3), 31013. doi: 10.1115/1.2931509.
[2] Sheng, W., Galbraith, R. A., and Coton, F. N. (2008). Prediction of Dynamic Stall Onset for Oscillatory Low-Speed Airfoils. Journal of Fluids Engineering, 130(10), 101204. doi:10.1115/1.2969450.
[3] Sheng, W., Galbraith, R., and Coton, F. N. (2006). A new stall onset criterion for low speed dynamic stall. Journal of Solar Energy Engineering, 128(4), 461–471.
[4] J. G. Leishman, T. S. B. (1989). A semi-empirical Model for dynamic stall. Journal of the american helicopter society, 34(3), 3–17.
[5] McCroskey, W. (1975). Recent developments in dynamic stall.
[6] McCroskey, W. J., Carr, L. W., and McAlister, K. W. (1976). Dynamic stall experiments on oscillating airfoils. AIAA journal, 14(1), 57–63.
[7] McCroskey, W. J., McAlister, K., Carr, L., et al. (1981). Dynamic stall on advanced airfoil sections. Journal of the American Helicopter Society, 26(3), 40–50.
[8] Carr, L. W., McAlister, K. W., and McCroskey, W. J. (1977). Analysis of the development of dynamic stall based on oscillating airfoil experiments.
[9] Carr, L. W. (1988). Progress in analysis and prediction of dynamic stall. Journal of aircraft, 25(1), 6–17.
[10] Ericsson, L. and Reding, J. (1988). Fluid mechanics of dynamic stall part i. unsteady flow concepts. Journal of fluids and structures, 2(1), 1–33.
[11] Ericsson, L. and Reding, J. (1988). Fluid mechanics of dynamic stall part ii. prediction of full scale characteristics. Journal of Fluids and Structures, 2(2), 113–143.
[12] Leishman, J. (2002). Principles of Helicopter Aerodynamics. Cambridge Aerospace Se-ries. Cambridge University Press. ISBN 9780521523967.
[13] Mccullough, G. B. and Gault, D. E. (1951). Examples of three representative types of airfoil-section stall at low speed.
COPYRIGHT STATEMENT
The authors confirm that they, and/or their company or organization, hold copyright on all of the original material included in this paper. The authors also confirm that they have obtained permission, from the copyright holder of any third party material included in this paper, to publish it as part of their paper. The authors confirm that they give permission, or have obtained permission from the copyright holder of this paper, for the publication and distribution of this paper as part of the IFASD-2017 proceedings or as individual off-prints from the proceedings.