Christian monseur, Ariane Baye, Dominique lafontaine, and Valérie Quittre
University of Liège, Liège, Belgium
Large-scale assessments of reading comprehension, notably OECD’s Programme for International Student Achievement (PISA) and IEA’s Progress in Reading Literacy Study (PIRLS), generally use paper-and-pencil tests in which a reading passage, with different questions based on it, is presented to the student. The PISA mathematics and science literacy tests also consist of a hierarchically embedded structure stimulus. In these surveys, cognitive data are scaled according to an item response theory (IRT) model. One of the cornerstones of standard IRT models is the assumption of local item independence (LII). Because multiple items are connected together to a common passage, items within a unit are not likely to be conditionally independent, which means that the independence assumption might be violated. In the first part of this study, Yen’s Q3 statistic was used to evaluate the importance of the local item dependency (LID) effect with respect to PISA 2000 and PISA 2003 data. The consequences of the violation of the LII assumption on the student performance distribution were then explored. Moderate but clear global context dependencies were detected in a large number of the PISA reading and mathematics units. Some reading and mathematics units showed additional significant pairwise local dependencies. Further, LID impacted on the variability of the student proficiencies, and the bias in the variability estimate strongly correlated with average country performance. Therefore, the consequence of LII violation in PISA is that the relative variability of low-performing countries is overestimated while the relative variability of high-performing countries is underestimated.
IERI Monograph Series: Issues and Methodologies in Large-Scale Assessments Volume 4
INTRoDuCTIoN
Large-scale assessments of reading literacy generally use paper-and-pencil tests in which a reading passage, with different questions (items) based on it, is presented to the student. This format seems to be the conventional reading test format for international assessments of reading conducted by the Organisation for Economic Co-operation and Development (OECD) and by the International Association for the Evaluation of Educational Achievement (IEA). The OECD has used this format for its PISA tests since 2000 (OECD, 2002). IEA used it for its first reading comprehension test in 1971 (Walker, 1976) and then continued to use it in its subsequent such tests (Elley, 1994; Mullis, Martin, Ruddock, O’Sullivan, Arora, & Erberer, 2007; Mullis et al., 2003).
This test format may be viewed as the most appropriate for assessing a complex process such as reading comprehension. In real-life situations, students have to use different cognitive processes to understand various components of the same text. Large-scale assessments are intended to evaluate whether some of these comprehension processes are successfully applied to a particular stimulus. For instance, the PISA reading literacy frameworks (OECD, 1999, 2009) describe the different components of reading literacy, and the reading test reflects these different dimensions. As summarized by Lee (2004), citing Mehrens and Lehman (1978) and Thissen, Steinberg, and Mooney (1989), “such a format makes it possible to measure examinees’ understanding of the material from various perspectives and, at the same time, is cost-effective for both the item developers and examinees” (pp. 74–75). OECD and IEA policies relating to international mathematics and science assessments differ with respect to test format. Since 2000, the PISA mathematics and science literacy tests have taken the form of a hierarchically embedded structure with several items related to a common stimulus. As discussed by Bao, Gotwals, and Mislevy (2006), one could argue that this hierarchical format may be desirable for mathematics and the sciences because it “reflect[s] real life situations in which sub-problems are interrelated and work is organized in steps” (p. 1). Because PISA aims to evaluate 15-year-olds’ readiness for life, and proposes a non-curricular approach, the choice of test format is coherent with the general theoretical framework of the study (OECD, 2003, 2006). Conversely, IEA mathematics and science assessments include only one item per stimulus. This approach may be compared with the OECD one by contrasting the theoretical frameworks of the two surveys (grade- and curriculum-based for IEA). However, the IEA “one to one” approach in mathematics and science also presents a methodological advantage because it avoids passage-related local item dependence (LID), a phenomenon that can occur if groups of items are based on the same stimulus.
Since the IEA 1991 Reading Literacy Study (Elley, 1994; Wolf, 1995), cognitive data from international assessments have usually been scaled according to item response theory (IRT) models. One of the cornerstones of standard IRT models is the assumption of local item independence (LII). Because multiple items are connected together to a common passage, items within a unit are not likely to be conditionally independent, so the assumption might be violated. This conjectured lack of LII can have a substantial effect on the parameter estimates, on the standard error estimates, and on the fit of the IRT models (Balazs & De Boeck, 2006).
Our first purpose in conducting this study was to examine passage-related local item dependencies in PISA cognitive assessment materials. We used Yen’s Q3 statistic for detecting LID (Yen, 1984), as well as the median and maximum Q3 values per unit. Our second purpose was to explore the impact of LII assumption violation on the student performance distribution in the context of PISA surveys. The question we asked ourselves here was this: Are these consequences of the LII assumption violation so large that alternative models should be investigated?
DeFINITIoN oF loCAl ITem DePeNDeNCe
The standard unidimensional IRT model requires LII (Embretson & Reise, 2000; Lord & Novick, 1968). In such models, the probabilities that an examinee will provide a specific response to an item are a function of two components:
1. The test-taker’s location on q, that is, his or her ability; and
2. One or more parameters (difficulty parameter, discrimination parameter, and guessing parameter) describing the relationship of the item to q.
For instance, according to the one-parameter Rasch model (Rasch, 1960), the probability that a person i will successfully answer an item j, given the person’s ability, qi, and the item’s difficulty, d, is equal to:
exp(qi – dj)
1+exp(qi – dj)
P(Xij =1 qi,dj) =
(1) Because the likelihood of success depends only on the person’s ability and on item characteristics, this means that the response to any item is unrelated to any other item given the latent trait q. In other words, the unidimensionality assumption means that although the items may be highly intercorrelated in the test as a whole, this situation is a function that rests solely on the ability of the test-takers. When the trait level is controlled, local independence implies that no relationship remains between the items (Embretson & Reise, 2000).
If two items are locally independent, then success or failure on one item does not affect the probability of succeeding on the other item, given ability. Mathematically, if item j1 and item j2 are locally independent, then:
P (Xi j 1= x1and Xi j 2= x2qi) =P (Xi j 1= x1qi) P (Xi j 2= x2qi)
IERI MONOGRAPH SERIES: ISSUES AND METHODOLOGIES IN LARGE-SCALE ASSESSMENTS VOLUME 4
where x1and x2 are equal to 0 or 1. Given the trait level, q, the conditional probability of achieving any pattern of scores on independent items is the product of the probabilities for the distinct items.
The violation of the LII assumption can have substantial consequences on test parameter estimates and on proficiency estimates. Research studies show that statistical analysis of data with LID is misleading (Chen & Thissen, 1997; Chen & Wang, 2007; Junker, 1991; Sireci, Thissen, & Wainer, 1991; Thissen, Steinberg, & Mooney, 1989; Tuerlinckx & De Boeck, 1998, 2001; Yen, 1993). Tuerlinckx and De Boeck (2001) mathematically and empirically demonstrated the impact of LID on difficulty and discrimination item parameters. They showed that if negative LID is not modeled, the discrimination parameters of the interdependent items are underestimated. They also showed that the discrimination parameter (aj) depends on the difficulty of the item
it interacts with, but not on the difficulty of the item itself. Due to its effect on the discrimination parameter, the negative LID deflates the item information (as a function of the square of aj), and the standard error of measurement is underestimated. It is
therefore essential to ensure the accuracy of the discrimination parameters, given that they index the item quality and therefore the test quality (Chen & Wang, 2007). LID can also strongly bias the variance estimate of student ability (Junker, 1991) and produce biased proficiency estimates.
Yen (1993) identified several potential causes of LID. Some of them are independent of the item’s content: external assistance (e.g., assistance from a teacher), fatigue (stimuli tend to be more difficult when they appear at the end of a test), practice, item or response format, speediness (if test-takers do not reach item j, they will surely not reach item j+1), and so on. Chen and Thissen (1997) call this last type of local dependency “surface local dependence.”
Other causes of LID cited by Yen (1993) relate to the content of items, namely, item chaining (items organized in steps) and explanation arising out of previous answer and stimulus dependence. This stimulus-LID can be produced by an examinee’s unusual level of interest in or background knowledge about the common stimuli or by the fact that information used to answer different items is interrelated in the stimulus. Chen and Thissen (1997) define this category of dependence as “underlying local dependence” because it assumes a separate trait common to each set of locally dependent items. These separate traits can therefore be regarded as minor dimensions existing beside the unique essential latent dimension q.
DeTeCTIoN oF loCAl ITem DePeNDeNCe
Recent years have seen increased interest in the development of methods for detecting and/or modeling LID. Chen and Thissen (1997) reflected on four potential statistics as detection indices of local dependence for pairs of items: (a) the X2 statistic, (b) the G2
statistic, (c) the standardized F coefficient difference, and (iv) the standardized log-odds ratio difference. These four statistics are commonly used to examine covariation of two-way contingency tables, which here are the expected1 and the observed
contingency tables.
Although the standardized F coefficient difference and the standardized log-odds ratio difference have the advantage of having signs that correspond to the direction of the association, they have the great drawback of being undefined when zero is observed in some of the cells of the contingency tables. Chen and Thissen (1997) chose the Pearson’s X2 statistic and the likelihood ratio G2 statistic and compared
them with another statistic proposed by Yen (1984), the Q3, which is a pairwise index of correlation of the residuals from the IRT model. They showed that X2 and G2
indices appear somewhat less powerful than Yen’s Q3 statistic for “underlying local dependence” stemming from the contents of items, but equally powerful for “surface local dependence” operating between non-reached items at the end of a test. Conditional-covariance-based statistical tools developed in order to estimate characteristics of a multidimensional latent space (DETECT) can also be used for detecting the type of LID that we focus on in this study (Stout, 2000; Stout, Habing, Douglas, Kim, Roussos, & Zhang, 1996). This method, which is based, like the Q3 statistic, on the null covariance for all item pairs with respect to the latent trait level, can be used to reveal homogeneous item subsets that represent a separate dimension (Balazs & De Boeck, 2006).
Because our study investigated passage-related LIDs, which can be considered the focus of the underlying local dependence model, we chose Yen’s Q3 for our analyses. The advantage of this statistic is that it allowed us to investigate the association after the q latent trait had been partially removed.
The Q3 is based on the residuals’ Pearson product moment correlations. The principle of the analysis is to take into account the test-taker’s abilities. As mentioned earlier, in IRT models the probability of success depends on the test-taker’s ability and on item properties such as difficulty and other parameters. Inter-item correlations are therefore expected and observed. However, for any particular level of difficulty, inter-item correlations should be equal to 0 (conditional independence assumption). Analyzing the residuals provides a way of controlling for student proficiency. This is because the residuals are the differences between the individuals’ observed scores and their respective predicted scores. If some sets of items present a significant level of residual correlation, then those items can be considered as locally dependent (Yen, 1993).
Yen’s Q3 statistic requires analysts to first compute the item parameter estimates and the student proficiency estimates (maximum likelihood estimate). These estimates are then used to compute the student’s expected performance on each item.
The expected performance of student i for item j with k+1 consecutive integer-possible scores (i.e., from 0 to k) is equal to:
Eij =
S
kp(Xij =k qi)k
k=1 (3)
In the case of the dichotomous Rasch model, in which k can take only two values, that is, 0 and 1, the expected score is equal to:
exp(qi – dj)
1+exp(qi – dj) Eij = p(Xij =1 qi,dj) =
(4)
The residual is the deviation between the student’s observed performance (raw score) and the expected item performance, that is:
Rij = Xij –Eij
(5)
The Q3 statistic is the correlation between residuals of two items across students and therefore reflects LID between the two items. This statistic thus reflects only linear dependencies between residuals. “It should be noted, however, that local independence is a broader assumption than zero correlations; local independence also includes nonlinear or higher-order relationship between the items” (Embretson & Reise, 2000, p. 188).
Because the item score is included in both raw scores and theta-predicted scores, the
Q3 value tends to be slightly negatively biased. As Yen (1993) demonstrated, when LII is true, the Q3 value is approximately - 1
(n -1), where n is the total number of items. Chen and Wang (2007) distinguished negative and positive correlations between dependent items. They confirmed by simulation that negative interactions would lead to clearly negative Q3 (in contrast to the slightly negative Q3 exhibited by independent pairs of items), whereas positive dependencies would, logically, lead to positive Q3. They also showed that an identical degree of dependence between two items can produce different absolute Q3 values. They therefore questioned the appropriateness of setting a cut point (e.g., ± 0.2) for detecting item interaction.
Chen and Wang (2007) accordingly proposed that simulation should be used for the computation of the sampling variance of the Q3 statistic. Each computed Q3 value (and particularly those Q3 values where LID is suspected) is compared to the corresponding distribution of Q3 statistics obtained from a number of simulated datasets, assuming LII, and modeled according to the same specifications (identical IRT model, identical item, and person parameter estimates). A pair of items will be definitively recognized as interrelated if the Q3 statistic computed on the real dataset falls outside the critical range of the corresponding empirical distribution of “zero LID” Q3 values.
moDelING loCAl ITem DePeNDeNCe
The development of methods for modeling item dependencies parallel the development of procedures designed to detect item dependence. In line with Hoskens and De Boeck (1997) and Wilson and Adams (1995), we distinguish three main approaches.
The first approach involves methods that consider the independence requirement between subsets of items rather than between isolated items. Wainer and Kiely (1987) label these subsets of items, when analyzed together, as “testlets.” In this category of methods, testlet scoring replaces item scoring, that is, the scores within a testlet are summed and each score usually represents a category of a polytomous item. This approach is applied in the graded response model (Samejima, 1969), the dispersion-location model (Andrich, 1985), the partial credit model (Wright & Masters, 1982), and the rating scale model (Andrich, 1978). Wang, Cheng, and Wilson (2005, p. 7) cite Warner (1995), who considered that the partial credit model is a “suitable model if the test contains a minor proportion of dependent items.” Yan (1997), employing the partial credit model at the unit level, showed that context-dependent items present better-fitting statistics at the unit level than at the item level. However, this approach circumvents the LID phenomenon rather than modeling it, with the disadvantage that information at the item level is lost. The second approach, usually denoted the fixed-effects approach (Chen & Wang, 2007; Haberman, 2007; Smits, De Boeck, & Verhelst, 2003; Wang & Wilson, 2005b), models the LID into the IRT models. The response patterns of a testlet are modeled by including additional fixed item interaction parameters beside the parameters of individual items. The total item information is therefore preserved while the LII assumption can be dropped. Because the interaction parameter is constant on the logit scale, LID is viewed as an item characteristic and the unidimensionality assumption still holds.
In the third approach (random-effects models), interaction parameters introduced into the standard item response models are variable, that is, dependent on the test-taker’s ability. LID is thus viewed as a personal characteristic. The resulting model is therefore multidimensional because new dimensions are added to capture the dependencies. Among a large number of these random-effects models, we can cite the Bayesian random-effects model for testlets (Bradlow, Wainer, & Wang, 1999; Wang, Bradlow, & Wainer, 2002), the random weights linear logistic test model (LLTM) (Rijmen & DeBoeck, 2002), the random-effects two-facet model (Wang & Wilson, 2005a), the Rasch subdimension model (Brandt, 2008), and the two-tier full-information item-factor analysis model (Cai, 2010; Rijmen, 2009).
meTHoD
The OECD’s Programme for International Student Achievement (PISA) is a survey of the reading, mathematics, and science proficiencies of 15-year-olds still enrolled in school. PISA is an ongoing data collection program, with students assessed every three years. For each data collection, one of these three domains is deemed the major one. It represents about two-thirds of the cognitive testing material. The first PISA data collection occurred in 2000, with reading as the major domain; the second occurred in 2003, with mathematics as the major domain.
In PISA, the main survey items are allocated to clusters (13 in PISA 2003), each one of which is designed to represent 30 minutes of testing. Clusters do not mix items from different domains (i.e., reading literacy, mathematics literacy, and science literacy). Clusters are then assembled in several test booklets (9 in PISA 2000, 13 in subsequent data-collection cycles), with each booklet composed of four clusters. Each student participating in the international assessment is randomly assigned one of the test booklets. The two-hour test is divided into two sessions separated by a short break. Because the provision of a trend indicator of student performance constitutes one of the major purposes of PISA, items from previous cycles are included in subsequent assessments for equating purposes.
The analyses that we report in this study were performed on reading data from PISA 20002 and mathematics data from PISA 2003. We excluded from our analyses data
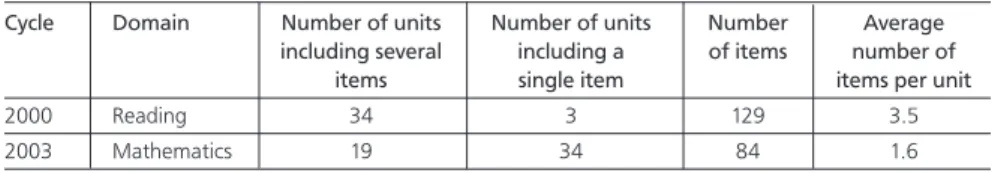
for non-OECD countries. As shown in Table 1, most of the PISA reading items are clustered in units that contain an average of 3.5 items. In mathematics, there are more single than clustered items; the average number of items per unit is 1.6.
Table 1: Number of units and items by major domain and cycle
Cycle Domain Number of units Number of units Number Average including several including a of items number of items single item items per unit 2000 Reading 34 3 129 3.5 2003 Mathematics 19 34 84 1.6
2 Turkey and the Slovak Republic did not participate in PISA 2000.
We began our analyses by examining, through computation of the Q3 statistic, stimulus-related local-item dependencies in the PISA databases. We gave separate consideration to two general types of dependence:
1. A global context local dependence that Hoskens and De Boeck (1997) call “combination dependency.” This form of LID can occur when the issue treated in the stimulus influences the response on each item within the unit.
2. A specific pairwise local dependence that occurs when two (or maybe more) items are embedded or if the information required for answering two items is linked in the stimulus. In this case, a residual correlation would only be observed between this pair of items.
We then explored the impact of a violation of the LID assumption on the student performance distribution (particularly for reading in PISA 2000 and for mathematics in PISA 2003). As we will explain, we included any sources of LID in these analyses. The first of our two purposes required the following steps: (a) calibration of the item parameters, (b) generation of the student proficiency point estimates, (c) computation of the residuals, and (d) computation of the Q3 statistic. However, some transformations of the data were necessary before we implemented these four steps. First, we had to exclude from the databases the students with special needs in education, who took a shorter test (UH booklet). Second, in order to control for LID due to speediness, we recoded the non-reached items as non-administered items. Non-reached items were represented as consecutive missing-by-design values clustered at the end of the test session except for the first item in the series of items not responded to, which was retained as an omitted response. Usually in international surveys such as PISA, the responses to non-reached items are considered as missing by design. They are therefore not included in the item calibration, and are seen as incorrect with respect to computation of student performance estimates (for more details, see Adams & Wu, 2002; OECD, 2005).
The way PISA treats non-reached items means that artificial local item dependencies can be produced.3 Chen and Thissen (1997) identify these as “surface local dependence.”
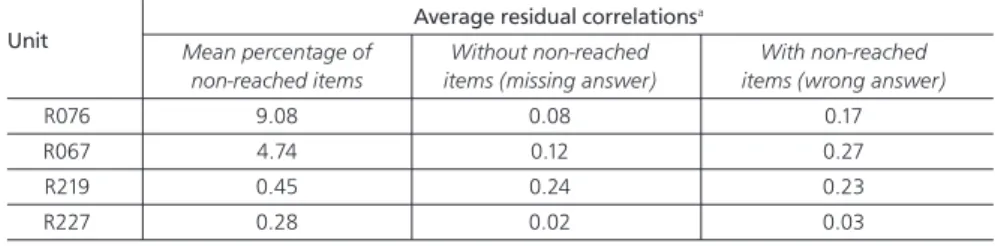
As we mentioned earlier, a test-taker not reaching item j will also not reach item j+1. This situation therefore generates a correlation between residuals. Table 2 illustrates the difference in average inter-item residual correlation within four reading units of PISA 2000, when the non-reached items were included or not included. These results illustrate that non-reached items artificially generate correlations between residuals.
3 For alternative ways of dealing with non-reached items, see Rose, von Davier, and Xu (2010) and Yamamoto and Everson (1997).
Table 2: Average residual correlationsa for four PISA 2000 reading units computed without and with non-reached items as valid answers
Unit Average residual correlations
a
Mean percentage of Without non-reached With non-reached
non-reached items items (missing answer) items (wrong answer)
R076 9.08 0.08 0.17 R067 4.74 0.12 0.27 R219 0.45 0.24 0.23 R227 0.28 0.02 0.03
Note: a The mean residuals correlation is computed per OECD country. It is the mean of the pairwise
Because the first aim of our study was to investigate LID due to the hierarchical structure of the test only, we had to exclude non-reached items from the statistical analyses. This approach ensures that detected LIDs are not a result of the speediness of the test-taker. However, because the second part of our study involved exploration of the consequences of violating the LID assumption on the student performance distribution, we considered non-reached items as incorrectly answered.
After recoding and transformation, we scaled the data with the IRT partial credit model described by Wright and Masters (1982). This model is an extension of the Rasch model for polytomous items (which are scored as correct, partially correct, or incorrect). We used ConQuest software (Wu, Adams, Wilson, & Haldane, 2007) to carry out the item calibration, and we estimated the item parameters on the international calibration samples, which consisted of simple random samples of 500 students per OECD country.4 Point estimates of students’ abilities (maximum likelihood estimates)
were then computed on the whole sample. Item parameter estimates and student proficiency point estimates were computed without weighting the data.
Finally, we computed, for each country, residual item correlations for each pair of items within a unit on weighted data, and obtained a Q3 matrix for each unit (for one k-item unit, there are k
(k-1)/2 Q3 values of the matrix). Following Yen (1993), we used
two key values to analyze the effect: the median and maximum values within the unit’s Q3 matrix. The results are summarized as an average across OECD countries. The median Q3 value is an indicator of the dependence at the unit level. It reveals the global context dependence due to use of a common passage for multiple items. As we have already mentioned, the common passage structure of a test can also engender LID, once one particular pair of items is correlated in the unit. This type of stimulus-related LID would be revealed if the maximum Q3 value of the matrix were significantly higher than its corresponding median Q3 value.
The second aim of our study was to evaluate the consequences of LID on countries’ estimates. (If the LII assumption is violated, the mean and the standard deviation of student performance may be biased.) To explore this effect of LID, we computed student proficiency estimates at the item level as well as at the unit (testlet) level. At the unit level, we recoded the cognitive data for reading in PISA 2000 and for mathematics in PISA 2003 in order to form testlets. We then summed the scores within a testlet, with each score representing a category of a polytomous item, and scaled the PISA cognitive data according to the one-parameter partial credit model. Before forming the testlets, we needed to recode some data to ensure the validity of the comparison between the scaling at the unit level and the scaling at the item level. If an item was deleted for a country, the whole unit for that country was deleted. These data transformations ensured that the two raw scores—one for the unit scaling
4 We carried out the item calibration on a subsample of 500 students by country in order to follow the PISA procedure and to ensure that each country equally contributed to the calibration
and one for the item scaling—were identical for each student. The data of students attending a special education school and who answered a shorter test were then deleted.
As previously described, we scaled the data for these second analyses with the IRT partial credit model (Wright & Masters, 1982), and used ConQuest software (Wu et al., 2007) to implement item and unit calibration. We estimated item parameters on the same international calibration samples as those selected for the item dependence measurement and then computed estimates of students’ abilities (maximum likelihood estimates). Our final step was to transform the students’ proficiency estimates (from both scalings) on the new scale with an OECD mean of 500 and an OECD standard deviation of 100. Each OECD country contributed equally to the computation of the two linear transformations.
ReSulTS AND DISCuSSIoN
Detection of lID
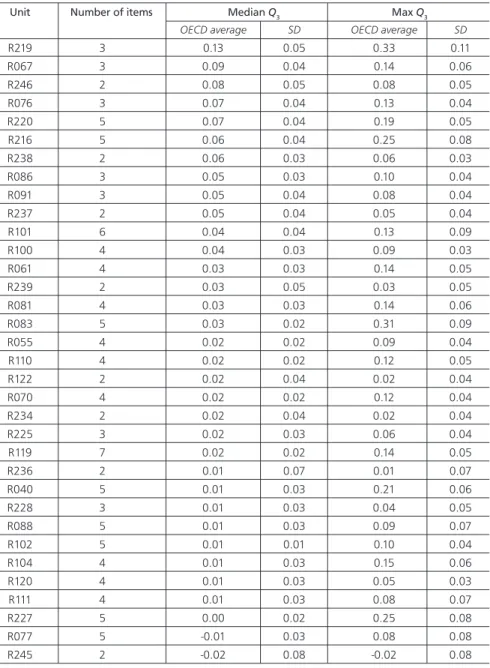
Table 3 shows that 32 of the 34 PISA reading-related units had positive values on the median Q3 statistic. However, this statistic should have been slightly negative if LII within the units had held true. PISA 2000 reading passages thus generate global context dependencies, but their magnitudes seem fairly moderate: all but one of the units had, on average for the OECD countries, a median Q3 value of less than 0.10. Although the global context dependencies appear to be quite limited in the reading units, we can observe substantial Q3 values for some pairs of residuals within no fewer than five units. The maximum Q3 values5 given in Table 3 were, on average for
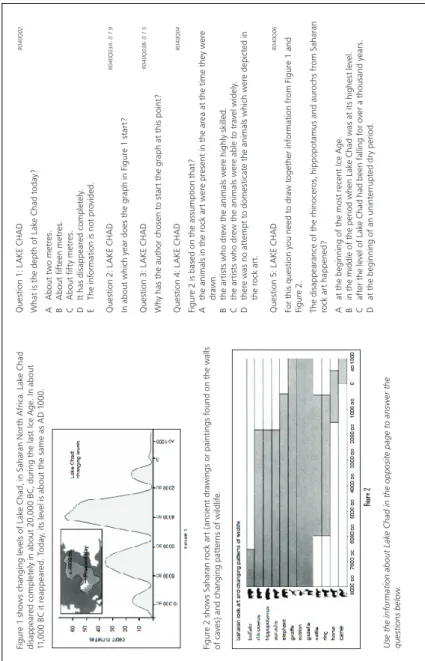
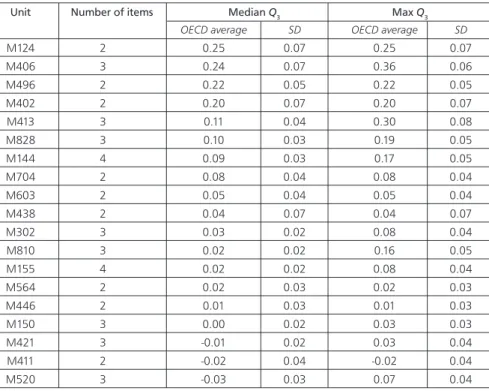
OECD countries, greater than 0.20 for R219, R216, R083, R227, and R040. These five reading units included at least one pair of items that are interrelated in the stimulus. The released unit R040 (Figure 1) illustrates this type of LID. The stimulus consists of one short text and two graphs, with five items relating to these. Question 2 and Question 3 show correlated residuals, with an average maximum Q3 value across the OECD countries of 0.21. A close examination of the content of this unit reveals the embedded structure of these two items. Obviously, if students cannot specify in which period the graph starts (Question 2), they will probably not be able to infer the reason why this start point (Question 3) has been chosen, and vice versa. Thus, the first item provides clues to the answer to the second one, explaining the positive LID detected. Table 4 shows that the median Q3 values were largely high in the PISA 2003 mathematics materials. Six units presented average median Q3 statistics that were clearly positive, that is, greater than or equal to 0.10. Note that in the mathematics units consisting of pairs of items, the median and maximum Q3 values were the same. The results showed that unit M406, with three items, was the only unit that gave an apparent global context LID (as measured by the median Q3 value). However, because this unit has not been released, we cannot provide an illustration of it here.
5 For one k-item unit, the maximum Q3 value is the maximum residual correlation out of the
k
(k-1)/2 values of the
Table 3: Summary statistics for local dependence in reading, PISA 2000
Unit Number of items Median Q3 Max Q3
OECD average SD OECD average SD
R219 3 0.13 0.05 0.33 0.11 R067 3 0.09 0.04 0.14 0.06 R246 2 0.08 0.05 0.08 0.05 R076 3 0.07 0.04 0.13 0.04 R220 5 0.07 0.04 0.19 0.05 R216 5 0.06 0.04 0.25 0.08 R238 2 0.06 0.03 0.06 0.03 R086 3 0.05 0.03 0.10 0.04 R091 3 0.05 0.04 0.08 0.04 R237 2 0.05 0.04 0.05 0.04 R101 6 0.04 0.04 0.13 0.09 R100 4 0.04 0.03 0.09 0.03 R061 4 0.03 0.03 0.14 0.05 R239 2 0.03 0.05 0.03 0.05 R081 4 0.03 0.03 0.14 0.06 R083 5 0.03 0.02 0.31 0.09 R055 4 0.02 0.02 0.09 0.04 R110 4 0.02 0.02 0.12 0.05 R122 2 0.02 0.04 0.02 0.04 R070 4 0.02 0.02 0.12 0.04 R234 2 0.02 0.04 0.02 0.04 R225 3 0.02 0.03 0.06 0.04 R119 7 0.02 0.02 0.14 0.05 R236 2 0.01 0.07 0.01 0.07 R040 5 0.01 0.03 0.21 0.06 R228 3 0.01 0.03 0.04 0.05 R088 5 0.01 0.03 0.09 0.07 R102 5 0.01 0.01 0.10 0.04 R104 4 0.01 0.03 0.15 0.06 R120 4 0.01 0.03 0.05 0.03 R111 4 0.01 0.03 0.08 0.07 R227 5 0.00 0.02 0.25 0.08 R077 5 -0.01 0.03 0.08 0.08 R245 2 -0.02 0.08 -0.02 0.08
!
Figur e 1: PIRL S t es t U nit R0 40, Lak e Chad Figur e 1 sho w s c hanging le vels of Lak e Chad, in Sahar an N or th Afr ica. Lak e Chad disappear ed com ple tel y in about 20,000 BC, dur ing t he las t Ice A ge. In about 11 ,000 BC it r eappear ed. T oda y, its le vel is about t he same as AD 1 000.!
Figur e 2 sho w s Sahar an r oc k ar t (ancient dr awings or paintings f ound on t he w alls of ca ves) and c hanging patt er ns of wildlif e. Use t he inf ormation about Lak
e Chad in t he opposit e pag e t o answ er t he ques tions belo w . Ques tion 1: L AKE C HAD R0 40Q02 What is t he dep th of Lak e Chad t oda y? A A bout tw o me tr es. B A bout fif teen me tr es. C A bout fif ty me tr es. D It has disappear ed com ple tel y. E The inf or mation is no t pr ovided. Ques tion 2: L AKE C HAD R0 40Q03A - 0 1 9 In about whic h y ear does t he g raph in F igur e 1 s tar t? Ques tion 3: L AKE C HAD R0 40Q03B- 0 1 5 Wh y has t he aut hor c hosen t o s tar t t he g raph at t his point? Ques tion 4: L AKE C HAD R0 40Q0 4 Figur e 2 is based on t he assum ption t hat? A the animals in t he r oc k ar t w er e pr esent in t he ar ea at t he time t he y w er e dr awn. B the ar tis ts who dr ew t he animals w er e highl y skilled. C the ar tis ts who dr ew t he animals w er e able t o tr av el widel y. D ther e w as no att em pt t o domes ticat e t he animals whic h w er e depict ed in the r oc k ar t. Ques tion 5: L AKE C HAD R0 40Q06 For t his q ues tion y ou need t o dr aw t og et her inf or mation fr om F igur e 1 and Figur e 2. The disappear ance of t he r hinocer os, hippopo
tamus and aur
oc hs fr om Sahar an roc k ar t happened? A at t he beginning of t he mos t r ecent Ice A ge. B in t he middle of t he per
iod when Lak
e Chad w as at its highes t le vel. C af ter t he le vel of Lak
e Chad had been f
alling f or o ver a t housand y ear s. D at t he beginning of an unint er rup ted dr y per iod.
The qualitative analysis of the released units M124 and M402 illustrated pairwise item dependence. The reason for the high dependence between the two items composing Unit M124 seems quite apparent: for both items, students are required to replace one of the elements of the formula given in the stimulus with a number given in the stem. The only difference between the two items presented in Figure 2 is that, in Question 1, it is the numerator that needs to be replaced; in Question 3, it is the denominator. Question 3 is more difficult than Question 1 because a final transformation has to be made to convert steps per minute into meters per minute. Given that both items require the ability to (a) replace a symbol in the same formula with a figure, and (b) solve a simple equation, it is not surprising that a high dependence between the two items is observed.
Unit M402, Internet Relay Chat (Figure 3), produced a similar type of dependence. This unit of two items had a Q3 value (median and/or maximum) of 0.20. Both items in the unit required students to compute the time lag between Berlin and Sydney. Although this time lag is visually presented in the stimulus, students had to determine its value (nine hours) and its direction (Sydney later than Berlin). The first item required a simple use of this time lag, whereas the second item, which is more difficult,6 required
students to first use the time lag and then compare time ranges. The communality of the tasks measured in the two items might explain the detected dependence.
Table 4: Summary statistics for local dependence in mathematics, PISA 2003
Unit Number of items Median Q3 Max Q3
OECD average SD OECD average SD
M124 2 0.25 0.07 0.25 0.07 M406 3 0.24 0.07 0.36 0.06 M496 2 0.22 0.05 0.22 0.05 M402 2 0.20 0.07 0.20 0.07 M413 3 0.11 0.04 0.30 0.08 M828 3 0.10 0.03 0.19 0.05 M144 4 0.09 0.03 0.17 0.05 M704 2 0.08 0.04 0.08 0.04 M603 2 0.05 0.04 0.05 0.04 M438 2 0.04 0.07 0.04 0.07 M302 3 0.03 0.02 0.08 0.04 M810 3 0.02 0.02 0.16 0.05 M155 4 0.02 0.02 0.08 0.04 M564 2 0.02 0.03 0.02 0.03 M446 2 0.01 0.03 0.01 0.03 M150 3 0.00 0.02 0.03 0.03 M421 3 -0.01 0.02 0.03 0.04 M411 2 -0.02 0.04 -0.02 0.04 M520 3 -0.03 0.03 0.07 0.04
!
Figure 2: PISA assessment Unit M124, Walking
Our analysis of the remaining mathematics units with high LID did not help us further isolate the source of the dependence. The similarities in the cognitive processes required for answering items might be one potential source of dependence. The contexts of the mathematics stimuli might be another potential source.
It would be inappropriate to make a strict comparison between the sources of dependence in reading and in mathematics, given that reading units have, on average, 3.5 items while mathematics units have 1.6. However, the results make it possible to hypothesize that PISA mathematics stimuli are more likely than PISA reading passages to generate dependence.
Our analyses showed LID in the PISA 2000 and 2003 materials. For the majority of the units, we detected a slight global context dependence, and for some units significant pairwise item interaction. These results confirm the hypothesis that passages can generate undesirable local interactions. They also corroborate Lee’s results (2004), showing local dependence among items within passages in a test of English as a foreign language. Lee investigated the LID within passages and within item types by computing Q3 statistics on both real and simulated (LII assumed) datasets. The author observed positive values for the average within-passage Q3 (ranging from .02 to .08 across 10 passages), whereas the same values for the simulated data were all negative. Lee concluded that there was moderate but clear evidence of positive passage-related LID supplemented by some item pairs with extreme Q3 values (.20).
6 OECD item parameters were 0.204 for the first item and 1.119 for the second one.
The picture shows the footprints of a man walking. The pacelength P is the distance between the rear of two consecutive footprints.
For men, the formula, n
P =140, gives an approximate relationship between n and P where,
n = number of steps per minute, and P = pacelength in metres
WALKING QUESTION 1
The formula applies to Heiko’s walking and Heiko takes 70 steps per minute. What is Heiko’s pacelength? WALKING QUESTION 3
Bernard knows his pacelength is 0.80 metres. The formula applies to Bernard’s walking. Calculate Bernard’s walking speed in metres per minute and in kilometres per hour.
Figure 3: Presentation of PIRLS assessment Unit M402, Internet Relay Chat
The results furthermore support, to some extent, the analyses that Cai (2010) performed on a subset of PISA 2000 data (Booklet 8) using a random effect model, corroborating the residual dependence between items within units.
effect on Countries’ estimates
The foregoing analyses identified undesirable dependence in some reading and mathematics units. As the standard deviations of the Q3 statistics in Table 3 show, LID varied across countries. For instance, Q3 for Unit M124 ranged from 0.13 to 0.40. In order to test whether there was a relationship between the extent of LID and country performance, we computed the average of median and maximum Q3 statistics per country and then correlated these with the country performance estimates. In reading, the low-achieving countries showed, on average, a higher LID than did countries with higher student scores (a correlation of -0.33 with median Q3). We also observed a higher correlation in mathematics (a correlation of -0.60 with median Q3). Because the LID varied according to the country performance level, it was essential that we analyzed the impact of such LID on country proficiency mean and standard deviation estimates.
Mark (from Sydney, Australia) and Hans (from Berlin, Germany) often communicate with each other using “chat”on the internet. They have to log on to the internet at the same time to be able to chat.
To find time to chat, Mark looked up a chart of world times and found the following:
INTERNET RELAY CHAT Question 1 At 7.00 PM in Sydney, what time is it in Berlin? INTERNET RELAY CHAT Question 2
Mark and Hans are not able to chat between 9.00 AM and 4.30 PM their local time, as they have to go to school. ALso, from 11.00 PM till 7.30 AM their local time they won’t be able to chat because they will be sleeping.
When would be a good time for Mark and Hans to chat? Write the local times in the table.
Greenwich 12 Midnight
Place Time
Sydney
Berlin
Berlin 1 AM Sydney 10:00 AM
For each student who participated in PISA 2000, we computed two new maximum likelihood estimates: one from the scaling at the item level, and one from the scaling at the testlet level. As described earlier, we considered non-reached items for these analyses as incorrect answers when conducting the item calibration and computing the proficiency estimates.
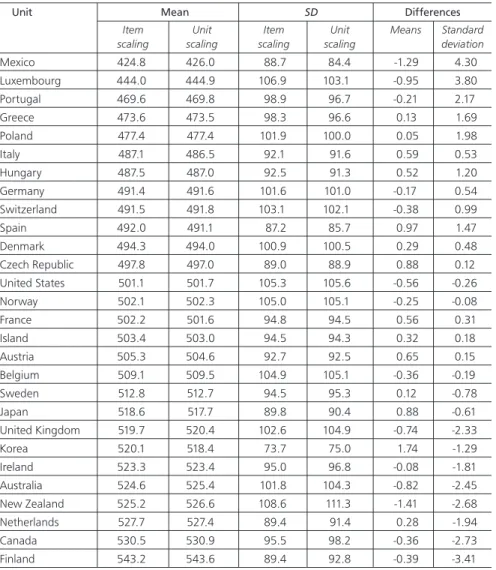
In the following paragraphs we describe the influence of the LID on country performance mean and standard deviation estimates for reading and then for mathematics. Table 5 presents the country mean and standard deviation estimates, as well as their respective differences for the two scores (i.e., the unit score and the
item score).
The shift in the country mean estimates ranged from -1.4 to 1.7 points on the PISA reading scale, and the shift in the country standard deviation ranged from -3.4 to 4.3. The change in the country mean estimates could be regarded as negligible, given that the range represents only 0.03 of an OECD standard deviation. However, Schafer and Graham (2002) consider a bias as not negligible if it is higher than half a standard error. If we apply this rule, the difference in Korea, New Zealand, and Mexico is higher than half a standard error on the mean estimate.7 The change in the standard deviation
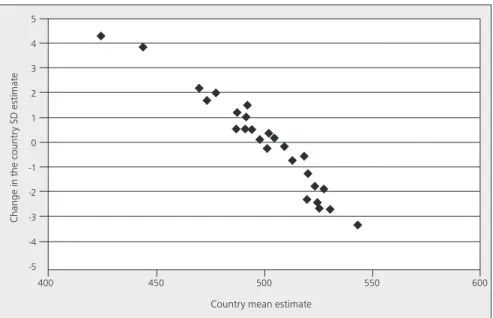
estimates is more of an issue, as the range is substantially higher (about eight points on the PISA scale) than half a standard error of the standard deviation estimates in more than half of the OECD countries. Furthermore, the change in the standard deviation closely correlates (-0.97) with the country proficiency mean estimates, as shown in Figure 4.
The x-axis of Figure 4 shows the country mean estimates based on the scaling at the item level. A positive value on the y-axis means that the standard deviation from the item scaling is higher than the standard deviation from the unit scaling. In other words, the unit scaling increases the standard deviation estimates for high-performing countries and decreases them for low-high-performing countries. A comparison between the OECD’s top-performing country and the OECD’s bottom-performing country illustrates the shift in the standard deviation. With the item scaling, the two countries present similar standard deviations (89.4 and 88.7 for Finland and Mexico respectively). These figures are quite different with respect to the unit scaling (92.8 for Finland and 84.4 for Mexico).
Unfortunately, this analysis does not disentangle the influence of LID on the country performance indicators from that of non-reached items. Because non-reached items increased LID and because the percentage of non-reached items correlated with the country performance, the relationship represented in Figure 4 might mainly be an artifact of non-reached items.
7 Note that we estimated standard errors according to the PISA sampling design. More precisely, we estimated them using a variant of the balanced repeated replication, that is, Fay’s methodology (Fay, 1989; see also Judkins, 1990; Rust & Rao, 1996).
To overcome this limitation, we re-conducted these analyses after deleting any student with at least one non-reached item in reading. The correlation between the country mean estimates and the change in the country standard deviation estimates was not affected. The observed correlation therefore did not result from the non-reached item issue.
Table 5: Mean and standard deviation estimatesa on the combined reading scale per type of scaling
Unit Mean SD Differences
Item Unit Item Unit Means Standard
scaling scaling scaling scaling deviation
Mexico 424.8 426.0 88.7 84.4 -1.29 4.30 Luxembourg 444.0 444.9 106.9 103.1 -0.95 3.80 Portugal 469.6 469.8 98.9 96.7 -0.21 2.17 Greece 473.6 473.5 98.3 96.6 0.13 1.69 Poland 477.4 477.4 101.9 100.0 0.05 1.98 Italy 487.1 486.5 92.1 91.6 0.59 0.53 Hungary 487.5 487.0 92.5 91.3 0.52 1.20 Germany 491.4 491.6 101.6 101.0 -0.17 0.54 Switzerland 491.5 491.8 103.1 102.1 -0.38 0.99 Spain 492.0 491.1 87.2 85.7 0.97 1.47 Denmark 494.3 494.0 100.9 100.5 0.29 0.48 Czech Republic 497.8 497.0 89.0 88.9 0.88 0.12 United States 501.1 501.7 105.3 105.6 -0.56 -0.26 Norway 502.1 502.3 105.0 105.1 -0.25 -0.08 France 502.2 501.6 94.8 94.5 0.56 0.31 Island 503.4 503.0 94.5 94.3 0.32 0.18 Austria 505.3 504.6 92.7 92.5 0.65 0.15 Belgium 509.1 509.5 104.9 105.1 -0.36 -0.19 Sweden 512.8 512.7 94.5 95.3 0.12 -0.78 Japan 518.6 517.7 89.8 90.4 0.88 -0.61 United Kingdom 519.7 520.4 102.6 104.9 -0.74 -2.33 Korea 520.1 518.4 73.7 75.0 1.74 -1.29 Ireland 523.3 523.4 95.0 96.8 -0.08 -1.81 Australia 524.6 525.4 101.8 104.3 -0.82 -2.45 New Zealand 525.2 526.6 108.6 111.3 -1.41 -2.68 Netherlands 527.7 527.4 89.4 91.4 0.28 -1.94 Canada 530.5 530.9 95.5 98.2 -0.36 -2.73 Finland 543.2 543.6 89.4 92.8 -0.39 -3.41
Figure 4: PISA 2000 country proficiency mean estimates (at the item level) and changes in the standard deviation estimates for reading
Table 6: Shifts in the mean and standard deviation estimates,a PISA 2003 mathematics
Minimum Maximum Whole set of items Mean -0.43 0.31
SD -1.03 0.67 Units with several items only Mean -1.38 0.55
SD -1.81 2.19
In mathematics, over 40 percent of the 2003 items were not embedded within a unit made up of several items (as shown in Table 1 in the previous section). Our analyses of the impact of LID were therefore performed on the whole set of items and also on the units with several items only. Table 6 presents the minimum and maximum shifts for the mean estimates and for the standard deviation estimates.
Not surprisingly, the ranges of the shifts were considerably larger for the analyses that we conducted on units with several items only. Furthermore, the correlation between the shift in the standard deviation and the country performance was equal to -0.60 for the whole set of items, but it was equal to -0.91 when we included only units with several items in the computation of student proficiency estimates. This correlation of -0.91 upholds the results observed in reading, namely, LID alters the standard deviation, and the shift in the standard deviation closely correlates with the country performance. Nevertheless, these results need to be confirmed by application of other IRT models such as a generalized partial credit model.
5 4 3 2 1 0 -1 -2 -3 -4 -5 400 450 500 550 600 Chang e in t he countr y SD es timat e
Country mean estimate
CoNCluSIoN
Since the IEA 1991 Reading Literacy Study (Elley, 1994; Wolf, 1995), cognitive data from international assessments have usually been scaled according to IRT models. One of the assumptions of IRT models is local item independence (LII). PISA assessment material, as well as that of other international assessments of reading literacy such as PIRLS, is hierarchically structured, which means that several items relate to a single context. This embedded structure may violate the assumption of LII. As Embretson and Reise (2000) state, “Practically, local independence is violated when item responses are linked” (p. 188).
Our research was aimed at detecting local item dependence (LID) in PISA and measuring its impact on student performance distribution. We used the PISA 2000 and the PISA 2003 cognitive data for this exercise. Two types of passage-related LID were distinguished. The first was the global context dependence that can occur when the issue treated in the stimulus influences the response to each item that composes the unit. The second was the specific pairwise local dependence that occurs when two items are embedded or if the information required for answering both items is linked in the stimulus.
Using Yen’s Q3 statistic, we detected moderate but clear global context dependencies in a large number of the units in both reading and mathematics. Several reading and mathematics units also showed substantial LID, mainly due to the manifestation of specific pairwise local dependencies. However, mathematics passages seemed to engender higher LID than reading texts.
We furthermore found LID impacts on some important PISA indicators. Passage- and context-related LID, in combination with a test-taker speed effect observed in 2000 test data, influenced the variability of the student proficiencies. The range of the shifts in the standard deviation of proficiency estimates can reach about 10 points on the PISA scales. This represents 0.10 of the international standard deviation. In addition, as highlighted in this study, the bias in the variability estimate strongly correlates with the average country performance. The relative variability of low-performing countries is thus overestimated, while the relative variability of high-performing countries is underestimated.
In summary, the main conclusions of the research are (a) moderate LID due to the use of common passages in reading units but substantial LID due to a speed effect, (b) LID in several mathematics units, and (c) a bias in the performance variability that closely correlates with country performance.
The moderate global context dependencies in PISA reading and mathematics units support Lee’s (2004) analysis of student performance data from an English as a foreign language reading comprehension test. Our results also agree with the “testlet effects” that Cai (2010) detected when modeling a subset of mathematics and reading PISA 2000 data (Booklet 8), using a random effect approach.
The dependence identified in several mathematics units could result from similarities in the cognitive processes involved in several items or from the specificity of the context. In this particular domain, prior knowledge about the stimulus or the interrelation of the information required to answer different items are certainly major sources of LID.
In addition to the slight general LID due to a common text, we found several reading passages marked by a rather high pairwise item dependence that could result, as in mathematics, from interrelated response indications. In PISA, these cases of pairwise dependence are quite limited because test developers carefully construct units to avoid such dependencies. Nevertheless, LID detection could be useful in the pre-test step for flagging item pairs exhibiting extreme LID. That, in turn, would achieve a better understanding of its sources.
As a number of authors have already reported (see, for example, Junker, 1991; Scott & Ip, 2002), LID can bias the variance estimate of student ability. Our research has shown a strong relationship between the bias in the standard deviation due to LID and country performance. This link certainly contributes to the well-known interactions between the measurement instrument and the countries.
The results of this research highlight the importance of LID analyses on the field trial data. The cost/benefit ratio of clustered items needs to be discussed, as correlated items conditional on student proficiency generate a loss of information. A mathematics unit of the kind shown in Figure 2 perfectly illustrates the inefficiency of correlated items that are conditional on the latent trait. The results also emphasize the importance of interpreting survey indicators in their methodological contexts, and they provide a reminder of the relative character of such indicators. After all, a change in the standard deviation will automatically affect percentages of students in the lowest and highest proficiency levels. Furthermore, because the variability of student proficiencies is one of the indicators used to evaluate the equity of education systems, a country can appear more or less equitable depending on the scaling model. Our study has several limitations, however. First, we consider it would be worthwhile, as a confirmatory activity, to check the presence of LID due to reading passages in other international surveys such as IEA’s Progress in International Reading Literacy Study (PIRLS) (Foy & Kennedy, 2008). Preliminary analyses performed on PIRLS 2006 data seem to show similar findings (Quittre & Monseur, 2010). Nevertheless, the apparently slight degree of LID in the PISA reading material is somewhat counterintuitive and therefore deserves cross-validation. In addition, it would be useful to construct the sampling distribution of the Q3 statistic using simulation of the type proposed by Chen and Wang (2007). This approach would enable the significance level of the LID coefficients to be computed. Finally, we advocate not only extending these analyses to non-OECD countries, which usually have lower achievement levels than OECD countries, but also further investigating potential interactions between LID and certain country or student characteristics.
References
Adams, R., & Wu, M. (2002). PISA 2000 technical report. Paris, France: Organisation for Economic Co-operation and Development.
Andrich, D. (1978). A rating formulation for ordered response categories. Psychometrika, 43, 561–573.
Andrich, D. (1985). A latent trait model for items with response dependencies: Implications for test construction and analysis. In S. E. Embretson (Ed.), Test design: Developments in psychology and psychometrics (pp. 245–275). New York, NY: Academic Press.
Balazs, K., & De Boeck, P. (2006). Detecting local item dependence stemming from minor dimensions: Interuniversity Attraction Pole statistics network [technical report]. Retrieved from http://www.stat.ucl.ac.be/IAP
Bao, H., Gotwals, A. W., & Mislevy, R. J. (2006). Assessing local item dependence in building explanation tasks (PADI Technical Report 14). Menlo Park, CA: SRI International. Bradlow, E. T., Wainer, H., & Wang, X. (1999). A Bayesian random effects model for testlets. Psychometrika, 64, 153–168.
Brandt, S. (2008). Estimation of a Rasch model including subdimensions. In M. von Davier & D. Hastedt (Eds.), IERI monograph series: Issues and methodologies in large-scale assessments (Vol. 1, pp. 51–70). Princeton, NJ: IEA-ETS Research Institute.
Cai, L. (2010). A two-tier full-information item factor analysis model with applications. Psychometrika, 75, 581–612.
Chen, C. T., & Wang, W. C. (2007). Effects of ignoring item interaction on item parameter estimation and detection of interacting items. Applied Psychological Measurement, 31, 388–410.
Chen, W. H., & Thissen, D. (1997). Local dependence index for item pairs using item response theory. Journal of Educational and Behavioral Statistics, 22, 265–289.
Elley, W. B. (1994). The IEA study of reading literacy: Achievement and instruction in thirty-two school systems. Oxford, UK: Pergamon Press.
Embretson, S. E., & Reise, S. P. (2000). Item response theory for psychologists. Mahwah, NJ: Lawrence Erlbaum Associates.
Fay, R. E. (1989). Theory and application of replicate weighting for variance calculations. Proceedings of the Survey Research Methods Section, ASA, 212–217.
Foy, P., & Kennedy, A. M. (2008). PIRLS 2006 user guide for the international database. Chestnut Hill, MA: Boston College.
Haberman, S. J. (2007). The interaction model. In M. von Davier & C. H. Carstensen (Eds.), Multivariate and mixture distribution Rasch models (pp. 201–216). New York, NY: Springer. Hoskens, M., & De Boeck, P. (1997). A parametric model for local dependencies among test items. Psychological Methods, 2, 261–277.
Judkins, D. (1990). Fay’s method for variance estimation. Journal of Official Statistics, 6(3), 223–239.
Junker, B. W. (1991). Essential independence and likelihood-based ability estimation for polytomous items. Psychometrika, 56, 255–278.
Lee, Y.-W. (2004). Examining passage-related local item dependence (LID) and measurement construct using Q3 statistics in an EFL reading comprehension test. Language Testing, 21, 74–100.
Lord, F. M., & Novick, M. (1968). Statistical theories of mental test scores. Reading, MA: Addison-Wesley.
Mullis, I. V. S., Martin, M. O., Ruddock, G. J., O’Sullivan, C. Y., Arora, A., & Erberber, E. (2007). TIMSS 2007 assessment frameworks. Chestnut Hill, MA: Boston College.
Mullis, I. V. S., Martin, M. O., Smith, T. A., Garden, R. A., Gregory, K. D., Gonzalez, E. J., … O’Connor, K. M. (2003). TIMSS assessment frameworks and specifications 2003 (2nd ed.). Chestnut Hill, MA: Boston College.
Organisation for Economic Co-operation and Development (OECD). (1999). Measuring student knowledge and skills: A new framework for assessment. Paris, France: Author. Organisation for Economic Co-operation and Development (OECD). (2002). PISA 2000 technical report. Paris, France: Author.
Organisation for Economic Co-operation and Development (OECD). (2003). The PISA 2003 assessment framework. Paris, France: Author.
Organisation for Economic Co-operation and Development (OECD). (2005). PISA 2003 technical report. Paris, France: Author.
Organisation for Economic Co-operation and Development (OECD). (2006). Assessing scientific, reading and mathematical literacy: A framework for PISA 2006. Paris, France: Author.
Organisation for Economic Co-operation and Development (OECD). (2009). PISA 2009 assessment framework. Paris, France: Author.
Quittre, V., & Monseur, C. (2010, July). Exploring local item dependency for items clustered around common reading passage in PIRLS data. Paper presented at the fourth IEA International Research Conference, Gothenburg, Sweden. Retrieved from http:// www.iea-irc.org
Rasch, G. (1960). Probabilistic models for some intelligence and attainment tests. Copenhagen, Denmark: Danish Institute for Educational Research.
Rijmen, F. (2009, July). A hierarchical factor IRT model for items that are clustered at multiple levels. Paper presented at the 74th Annual Meeting of the Psychometric Society, Cambridge, England.
Rijmen, F., & De Boeck, P. (2002). The random weights linear logistic test model. Applied Psychological Measurement, 26, 271–285.
Rose, N., von Davier, M., & Xu, X. (2010). Modeling non-ignorable missing data with IRT (ETS Research Report No. RR-10-10). Princeton, NJ: ETS.
Rust, K. F., & Rao, J. N. K. (1996). Variance estimation for complex surveys using replication techniques. Survey Methods in Medical Research, 5, 283–310.
Samejima, F. (1969). Estimation of latent ability using a response pattern of graded scores. Psychometrika Monograph Supplement, 17, 1–100.
Schafer, J. L., & Graham, J. W. (2002). Missing data: Our view of the state of the art. Psychological Methods, 7, 147–177.
Scott, S. L., & Ip, E. H. (2002). Empirical Bayes and item clustering effects in a latent variable hierarchical model: A case study from the National Assessment of Educational Progress. Journal of the American Statistical Association, 97, 409–419.
Sireci, S. G., Thissen, D., & Wainer, H. (1991). On the reliability of testlet-based tests. Journal of Educational Measurement, 28, 237–247.
Smits, D. J. M., De Boeck, P., & Verhelst, N. (2003). Estimation of the MIRID: A program and a SAS-based approach. Behavior Research Methods, Instruments, & Computers, 35, 537–549.
Stout, W. (2002). Psychometrics: From practice to theory and back. Psychometrika, 67, 485–518.
Stout, W., Habing, B., Douglas, J., Kim, H. R., Roussos, L., & Zhang, J. (1996). Conditional covariance-based nonparametric multidimensionality assessment. Applied Psychological Measurement, 20, 331–354.
Thissen, D., Steinberg, L., & Mooney, J. A. (1989). Trace lines for testlets: A use of multiple-categorical-response models. Journal of Educational Measurement, 26, 247–260. Tuerlinckx, F., & De Boeck, P. (1998). Modeling local item dependencies in item response theory. Psychologica Belgica, 38, 61–82.
Tuerlinckx, F., & De Boeck, P. (2001). The effect of ignoring item interactions on the estimated discrimination parameters in item response theory. Psychological Methods, 6, 181–195.
Wainer, H., & Kiely, G. L. (1987). Item clusters and computerized adaptive testing: A case for testlets. Journal of Educational Measurement, 24, 185–201.
Walker, D. (1976). The IEA Six Subject Survey: An empirical study of education in twenty-one countries. Stockholm, Sweden: Almqvist & Wiksell.
Wang, X., Bradlow, E. T., & Wainer, H. (2002). A general Bayesian model for testlets: Theory and applications. Applied Psychological Measurement, 29, 109–128.
Wang, W.-C., Cheng, Y.-Y., & Wilson, M. R. (2005). Local item dependence for items across tests connected by common stimuli. Educational and Psychological Measurement, 65, 5–27.
Wang, W.-C., & Wilson, M. R. (2005a). The Rasch testlet model. Applied Psychological Measurement, 29, 126–149.
Wang, W.-C., & Wilson, M. R. (2005b). Exploring local item dependence using a random-effects facet model. Applied Psychological Measurement, 29, 296–318.
Wilson, M., & Adams, R. J. (1995). Rasch models for item bundles. Psychometrika, 60, 181–198.
Wolf, R. M. (1995). The IEA Reading Literacy Study: Technical report. The Hague, the Netherlands: International Association for the Evaluation of Educational Achievement (IEA).
Wright, B. D., & Masters, G. N. (1982). Rating scale analysis. Chicago, IL: MESA Press. Wu, M. L., Adams, R. J., Wilson, M. R., & Haldane, S. A. (2007). ACER ConQuest version 2.0: Generalised item response modelling software [computer program]. Camberwell, Victoria, Australia: ACER Press.
Yamamoto, K., & Everson, H. (1997). Modeling the effects of test length and test time on parameter estimation using the HYBRID model. In J. Rost & R. Langeheine (Eds.), Applications of latent trait and latent class models in the social sciences (pp. 89–98). New York, NY: Waxman.
Yan, J. (1997, March). Examining local item dependence effects in a large-scale science assessment by a Rasch partial credit model. Paper presented at the Annual Meeting of the American Educational Research Association, Chicago, IL.
Yen, W. M. (1984). Effects of local item dependence on the fit and equation performance of the three-parameter logistic model. Applied Psychological Measurement, 2, 125–145. Yen, W. M. (1993). Scaling performance assessments: Strategies for managing local item dependence. Journal of Educational Measurement, 30, 187–213.