HAL Id: hal-00421819
https://hal.archives-ouvertes.fr/hal-00421819
Submitted on 11 May 2010
HAL is a multi-disciplinary open access
archive for the deposit and dissemination of
sci-entific research documents, whether they are
pub-lished or not. The documents may come from
teaching and research institutions in France or
abroad, or from public or private research centers.
L’archive ouverte pluridisciplinaire HAL, est
destinée au dépôt et à la diffusion de documents
scientifiques de niveau recherche, publiés ou non,
émanant des établissements d’enseignement et de
recherche français ou étrangers, des laboratoires
publics ou privés.
Domain Driven Data Mining to Improve Promotional
Campaign ROI and Select Marketing Channels
Thomas Piton, Julien Blanchard, Henri Briand, Fabrice Guillet
To cite this version:
Thomas Piton, Julien Blanchard, Henri Briand, Fabrice Guillet. Domain Driven Data Mining to
Improve Promotional Campaign ROI and Select Marketing Channels. The 18th ACM Conference on
Information and Knowledge Management, 2009, Hong Kong SAR China. pp.1057-1066. �hal-00421819�
Domain Driven Data Mining to Improve Promotional
Campaign ROI and Select Marketing Channels
Thomas Piton
∗, Julien Blanchard, Henri Briand and Fabrice Guillet
KnOwledge & Decision Team
LINA UMR CNRS 6241, Computer Science Laboratory of Nantes-Atlantique Polytechnic School of Nantes University, France
{thomas.piton, julien.blanchard, henri.briand, fabrice.guillet}@univ-nantes.fr
ABSTRACT
The trading activities of materials retail is concerned with an extremely competitive market. However, business people are not well informed about how to proceed and what to do during marketing activities. Data mining methods could be interesting to generate substantial profits for decision makers and to optimize the choice of different marketing activities. In this paper, we propose an actionable knowledge discov-ery methodology, for one-to-one marketing, which allows to contact the right customer through the right communica-tion channel. This methodology first requires a measure-ment of the tendency for the customers to purchase a given item, and second requires an optimization of the Return On Investment by selecting the most effective communication channels for attracting these customers. Our methodology has been applied to the VM Mat´eriaux company. Thanks to the collaboration between data miners and decision mak-ers, we present a domain-driven view of knowledge discovery satisfying real business needs to improve the efficiency and outcome of several promotional marketing campaigns.
Categories and Subject Descriptors
H.2.8 [Database Applications]: Data mining; I.2.6 [Learning]: Knowledge acquisition; J.1 [Administrative Data Pro-cessing]: Marketing
General Terms
Performance, Management, Experimentation
Keywords
Actionable knowledge discovery, domain-driven data min-ing, customer relationship management
∗Thomas Piton is a CIFRE PhD student of the LINA labo-ratory and VM Mat´eriaux company, 85260 L’herbergement, France.
1.
INTRODUCTION
Knowledge Discovery in Databases is the non-trivial pro-cess of identifying valid, novel, potentially useful, and ulti-mately understandable patterns in data [16]. Domain Driven Data Mining [10, 4, 8] targets the development of next gen-eration data mining methodologies, frameworks, algorithms, evaluation systems, tools and decision support. It aims at promoting the paradigm shift from data-centered hidden pattern mining to domain-driven actionable knowledge dis-covery. Cao [5] proposes a methodology of Domain Driven Data Mining to narrow down the gap between academia and business. Moreover, Cao and Zhang [9] propose a practi-cal perspective in Australian Stock Exchange data, referred to as domain-driven in-depth pattern discovery (DDID-PD), presenting a domain-driven view of discovering knowledge satisfying real business needs.
In the last 10 years, applications of data mining and knowl-edge discovery have been increasingly undergoing enormous transformation [27], influenced by seismic external forces such as the enormous growth of web/e-commerce, tremen-dous progress in biology, and frequently controversial use of data mining for homeland security [30]. Other domains of applications are financial data mining [28], actionable trad-ing agents in capital markets [6], actionable tradtrad-ing strate-gies and exceptional market microstructure behavior pat-terns [7]. Moreover, in the social security area, the concept of activity mining [11] and combined mining [37] have been proposed. New algorithms suggest actions to change cus-tomers from an undesired status (such as attritors) to a de-sired one (such as loyal) while maximizing the expected net profit [35]. It is asserted that data mining should not only increase understanding, but should also assist managers to solve problems and reach decisions [17].
In recent years, data mining [12] has found numerous applications in industry and commerce [25] [26], many of which fall within the framework of Customer Relationship Management (CRM), i.e. mining customer data to cre-ate, develop and maintain profitable relationships with cus-tomers [29]. Methods such as regression analysis, decision trees, clustering, or association rules have been used in this context [1]. They are generally complemented with postpro-cessing methods such as visualization [24] [15] and interest ranking [36] [20] [18].
However, data mining has been applied to CRM in many industries with limited success [21]. In large organizations, it is not very straightforward to collect and transform data to create systems that will support CRM [31]. Consequently, there is a consequent strong limitation in the number of cus-tomers that the company can take on. For each customer, there may be a large number of possible actions that can be applied [35]. But actions, such as emailing, direct mail-ing and salespersons’ visits cost the company money [34]. To overcome this drawback, marketing managers need to acquire relevant knowledge on a one-to-one basis to decide which are the most effective communication channels to use for each customer, while avoiding flooding customers with messages. Although finding customer patterns and trends is useful, formulating marketing, sales and customer support strategies requires knowledge that business experts can ap-ply directly (”actionable knowledge” paradigm [4]).
This paper contributes to the latter task by proposing an actionable knowledge discovery methodology, for one-to-one marketing, which allows to contact the right customer through the right communication channel. The methodol-ogy reported in this paper focuses on the practical frame-work, called domain-driven in-depth pattern discovery [9]. DDID-PD highlights a process that discovers in-depth pat-terns from constraint-based context with the involvement of domain experts. Its main ideas include constraint min-ing [22], in-depth minmin-ing, human-cooperated minmin-ing [2], and loop-closed mining. Our methodology for CRM requires firstly to measure the tendency of customers to purchase an item, and secondly to optimize the Return On Investment (ROI) by selecting the most effective communication chan-nels for attracting these customers. Our methodology has been applied to the company VM Mat´eriaux1
, within the context of a wholesaler, for building materials retail. We were able to improve several promotional campaigns thanks to the use of the data mining software program KXEN2
and the involvement of business experts.
The rest of the paper is organized as follows: Section 2 describes our actionable knowledge discovery methodology for CRM. Then, in Section 3, an application of the method-ology for improving a VM Mat´eriaux promotional campaign with KXEN program is presented. Finally, conclusions and future work are summarized in Section 4.
2.
ACTIONABLE KNOWLEDGE
DISCOV-ERY FOR CRM
This section presents our methodology which will be in-stantiated according to a concrete application in section 5 with KXEN program. KXEN program uses Vapnik’s Struc-tural Risk Minimization [33] for optimal accuracy and ro-bustness compromisation. The dataset is divided into three subsets for training, validation and the test to measure the performance of the final model [14]. The proposed method-ology consists of four steps: scoring customers for purchases (Section 2.1), scoring customers for net margin3
(Section 2.2), choosing marketing channels (Section 2.3) and the Return
1
http://www.vm-materiaux.com
2
http://www.kxen.com
3
Net margin is gross margin minus all the costs of running the business
On Investment model (Section 2.4). Let us consider an array (Table 1) of customers for whom the binary target variable means the purchase in a promotional campaign (1 for pur-chase, 0 otherwise) and the continuous target variable means net margin generated by the visiting customer.
Table 1: Available data
Customers Binary target Continuous target (Purchase) (Net margin in =C) PR00001 1 555.20 PR00002 0 NULL PR00003 1 269.25
... ... ...
2.1
Scoring customers for purchases
To predict the binary target for purchases, we choose to calculate a tendency score with a ridge regression.
2.1.1
Ridge regression
Ridge regression has the advantage of placing a penalty in the size of the coefficients and has the privilege of be-ing insensitive to correlations. When predictors are corre-lated least squares may use this correlation to balance out the effects of each predictor. Ridge regression can provide the contribution, i.e. a polynome weight Wx, that is used
to show the relative importance Cx of a variable x in the
model [32]:
Cx= Wx/
X
x
Wx (1)
In our work, the purpose of ridge regression is to provide the potential buyers for a promotional campaign in a population. Given a threshold s, we predicted that a customer i is a buyer if the score sicalculated by the model is greater than
s (Table 2). Let u(s) be the proportion of customers whose score calculated by the model is greater than s:
u(s) = P (si≥ s) (2)
Let v(s) be the real proportion of buyers identified by the model:
v(s) = P (si≥ s | i = buyer) (3)
Table 2: Confusion matrix Actual Buyer Non Buyer Buyer True False (score ≥ s) Positive Positive Non Buyer False True Predicted
(score < s) Negative Negative Finally, ridge regression allows us to obtain a score func-tion siin decreasing order for each customer i reflecting the
probability pi(obtained by normalization of si) to purchase
2.1.2
Accuracy and robustness
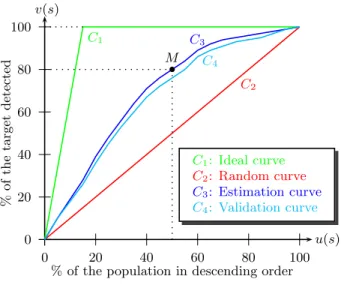
In order that decision makers can graphically visualize the accuracy and robustness of our models, we use lift curves (Curves C3 and C4 on Figure 1). A lift curve (variation of
ROC curve) is a parametric curve representing the propor-tion of buyers detected v(s) with relapropor-tion to the proporpropor-tion of customers selected u(s) [19]. The accuracy and robust-ness of a model can be measured by comparing the lift curve to random and ideal curves (Curves C2and C1on Figure 1).
The random curve is the curve y = x (we detect α % buy-ers selecting α % custombuy-ers). The ideal curve is the one in which all buyers are selected first. From the lift curve, two indexes can be calculated. The first index is the Gini index [13], named KI in KXEN program. It corresponds to the area between the validation curve and the random curve, and measures the accuracy of the model, i.e. the ability of input variables to explain the target. The second indicator, named KR in KXEN program, corresponds to the difference in area between the estimation and the validation lift curves. It measures the robustness of the model, i.e. its ability to provide the same level of quality on a new dataset, typically the validation dataset.
0 20 40 60 80 100 0 20 40 60 80 100 b M u(s) v(s)
% of the population in descending order
% o f th e ta rg et d et ec te d C1 C2 C3 C4 C1: Ideal curve C2: Random curve C3: Estimation curve C4: Validation curve
Figure 1: Lift curves.
This part of our methodology allows us to get a lift curve which is related to the quality of the model using the two indexes KI and KR (referred to in-depth pattern mining [9]). The naive profit curve in the next part allows us to introduce economic constraints in customer targeting.
2.1.3
Naive profit curve
In order to help decision makers estimate the ROI gener-ated by a model on a promotional campaign, we use naive profit curves on training or validation datasets. A naive profit curve is the transformation of a lift curve with a cost matrix (Figure 3) defined by the decision makers. The naive profit of the promotional campaign can therefore be defined as follows: the net margin achieved by contacting u(s) % customers. Let N be the number of customers in the sample studied, G the average net margin per customer and H the
average spending communication per customer (Table 3).
naiveP rof it(s) = N ∗ [P (i = buyer|s(i) ≥ s) ∗ (G − H) −P (i = non buyer|s(i) ≥ s) ∗ H]
(4) The theoretical maximum profit, prof itM AX, is obtained with the model where all buyers are selected first. Thus, a naive profit curve (Figure 2) is a parametric curve represent-ing the profit rate (naiveP rof it(s)/prof itM AX) accordrepresent-ing to the proportion of u(s) selected customers. This curve presents a different Y-axis of the lift curve with the percent-age of maximum profit in order to graphically measure the ROI of the promotional campaign. For example, the point N (Figure 2) means that on the validation dataset, we contact 48 % of the population to achieve a maximum profit equal to 82 % of maximum theoretical profit. Therefore, this part of our methodology allows us to obtain the optimal point (maximum Y-axis) on the curve indicating the proportion of the population to be contacted.
Table 3: Cost matrix Actual Buyer Non Buyer Buyer G − H 0 − H (score ≥ s) Non Buyer 0 0 Predicted (score < s) 0 20 40 60 80 100 0 20 40 60 80 100 u(s) b N
% of the population in descending order
p ro fi t ra te C1 C2 C4 C1: Ideal curve C2: Random curve C4: Validation curve
Figure 2: Naive profit curve.
2.2
Scoring customers for net margin
To predict net margin giper customer i, we choose to use
a second ridge regression.
2.2.1
Change of target
Often the score generated by the ridge regression can be very ambiguous for an interpretation of decision makers. This restriction is solved by using a second result: the esti-mation of net margin generated per customer. We consider
a continuous target variable representing the amount of net margin gi during the promotional campaign. The purpose
of this second ridge regression is to provide the approximate net margin giper visiting customer. The training dataset is
less important than in the case of a regression with a binary target variable. Moreover, important customers represent a small dataset and therefore it is more difficult to determine their purchasing behavior. Therefore, the model generated is less precise and constitutes a secondary opinion to sort the list. Using a ridge regression with a continuous target variable implies the absence of lift and naive profit curves (Figures 1 and 2).
2.2.2
Merging lists of routing
We can combine the results of the two ridge regressions to optimize the routing of customers. The scores generated by the first regression are discretized (10−4
after decimal point) and allow us to classify customers in descending or-der. Then, we complete this classification with the result of the second regression, i.e. the net margin. For customers with very close scores, the classification is altered according to their estimated net margin. For merging lists of rout-ing, the marketing manager and the purchasing director of VM Mat´eriaux decided to attach more importance to a new customer (i.e. pivalue) towards the development of the net
margin per customer (i.e. givalue).
2.3
Choice of marketing channels
2.3.1
Channel diversification
Despite the emerging challenge from new media, tradi-tional channels of salesperson sales, for example visit, phone, mail, and mass media remain strongly in use [3]. The use of too many, or inadapted, channels may end up having a contrary effect on the promotional campaign. Which chan-nels are most effective in eliciting response (in our case to purchase)? The purpose of our methodology is to address all these issues to optimize the use of marketing channels according to scoring. In materials retail, customers are not willing to communicate through all channels. Therefore, we chose the following channels:
1. Visit: a salesperson sales visit to the customer to in-vite him to the promotional campaign (on average 20 visits per week).
2. Mail: a letter is designed by an external company and sent by an external mail service to customers. 3. E-mail: a message is designed by an external company
and sent to customers via the Internet with statistical returns.
4. Phone: arguments are prepared by an external com-pany and are used during phone conversations. 5. SMS: an SMS is designed by VM Mat´eriaux and sent
by an external SMS provider to customers with statis-tical returns.
6. Fax: a fax is designed by an external company and sent by an external router to customers with statistical returns.
2.3.2
Channel costs
In Tables 4 and 5, we distinguish fixed and variable costs for each marketing channel. These costs were defined by the marketing manager, the purchasing director of VM Mat´eri-aux company and two external communication companies. As an example: the creation (fixed costs) of an e-mail will cost much more than sending (variable costs), depending on the number of customers n. Therefore, we can generalize the cost of using a marketing channel j as follows:
Cost(j) = F Cj+ (V Cj∗ nj) (5)
with, F Cj the fixed costs for channel j, V Cj the variable
costs per customer for channel j and njthe number of
cus-tomers contacted through channel j.
Table 4: Fixed channel costs Channel Fixed Justification
costs
Visit 0 =C independent of the campaign Mail 1 500 =C design, editing, customization E-mail 1 000 =C design, customization
Phone 1 500 =C argument, phoning, coaching SMS ' 0 =C internal development
Fax 1 000 =C design, customization
Table 5: Variable channel costs Channel Variable Justification
costs V Cj
Visit 250 =C salary, car, bonus Mail 0,81 =C printing, enveloping, postage E-mail 0,01 =C price of external company Phone 3 =C telecommunications charges
SMS 0,08 =C price of external company Fax 0,028 =C price of external company
2.3.3
Channel capacity
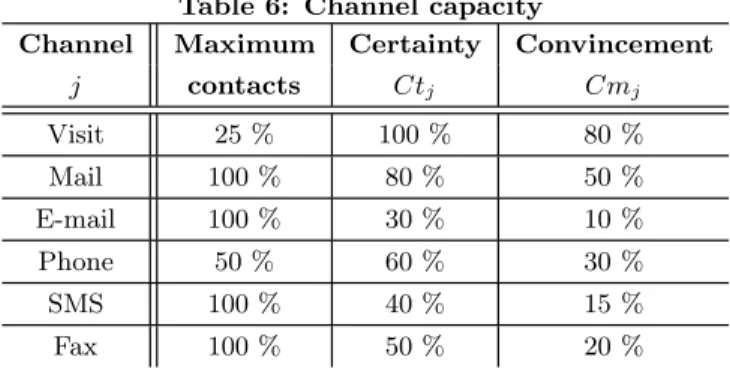
Considering that our customers contact information is complete and current, we measure three different criteria for estimating the customers’ response rate for each marketing channel j (Table 6).
• Maximum contact: the maximum proportion of cus-tomers that can be contacted with j using the re-sources assigned.
• Certainty Ctj: the proportion of customers actually
contacted when channel j is used.
• Convincement Cmj: the proportion of customers
convinced of the promotional campaign interest, among those actually contacted by channel j.
These results are the findings of survey conducted inter-nally at VM Mat´eriaux with the trading director, purchas-ing director and sales force teams. They can be adapted for
other kinds of business domains. In in-depth mining, more attention should be paid to business requirements, domain knowledge and qualitative intelligence of domain experts for their impact on mining deep patterns [9].
Table 6: Channel capacity
Channel Maximum Certainty Convincement j contacts Ctj Cmj Visit 25 % 100 % 80 % Mail 100 % 80 % 50 % E-mail 100 % 30 % 10 % Phone 50 % 60 % 30 % SMS 100 % 40 % 15 % Fax 100 % 50 % 20 %
2.3.4
Channel classes
Let C be a channel class, i.e. a set of different compat-ible marketing channels. Using several channels improves the chance of reaching the different types of customers and convincing them. The channel class might be {Visit, Mail, SMS}. However, it is not desirable to over communicate with the customers. In order to choose the best channel class to use, we try to maximize the estimated profit per customer. If the channel class C is used, a profit estimation per customer i is:
CustomerP rof it(i, C) = pi∗gi∗ max
j∈C(Ctj∗Cmj)−
X
j∈C
V Cj
(6) The maximum max
j∈C(Ctj∗Cmj) is a simplifying model since
we do not take into account interactions between different marketing channels on the same customer. Then, for each customer i, we choose Ci which maximizes the previous
equation:
Ci= arg max
C (CustomerP rof it(i, C)) (7)
Since the desire of VM Mat´eriaux is to use all marketing channels, the fixed costs F Cjwill be paid anyway.
2.4
Return On Investment model
The methodology presented above allows us to propose an equation to calculate the expected ROI for our promotional campaign assuming that for each customer i, class Ci has
been decided (Equation 7).
ROI =X i Ci− X j F Cj− W where W = X + Y − Z (8)
• X: operation fixed costs (communication, gifts, meals, advertising, etc.).
• Y : data mining costs: time for preprocessing and mod-eling, software program license and services.
• Z: cost reduction due to gain time spent in the mar-keting department to establish the lists.
The average cost of data mining depends on the number of promotional campaigns processed with our methodology. In contrast, the marginal cost of a new campaign will be lower. The average cost decreases when the marginal cost is below the average cost. This example illustrates the ”scale-up” and demonstrates the interest in increasing our production models to reduce our average cost [23].
3.
APPLICATION ON REAL DATA
3.1
Context
The VM Mat´eriaux trading group organizes two promo-tional days to promote all products in its material retail-ing. This promotional campaign is reserved for professional building workers and allows to obtain various gifts subject to their achievement of a limit net margin. Previously, sales force teams approached all customers, who had achieved a net margin above a certain threshold, by one or several mar-keting channels. Now, we apply our methodology presented in section 2 to our promotional campaigns. Finally, we cre-ated a work cell consisting of decision makers and data min-ers. This cell was a synergy to find the business question: ”Understanding and providing customer routing list for the next promotional campaign, and optimizing the use of mar-keting channels”.
3.2
The interacting roles of decision makers
The involvement of domain experts and their knowledge can reduce the complexity of the knowledge discovery pro-cess in the constrained world. This section highlights the im-portance of the decision makers during the knowledge data discovery process. The retail director, the marketing man-ager, the purchasing director and the sales force team of VM Mat´eriaux company turn data into information and informa-tion into knowledge. These stages correspond to the concept ”Human Cooperated Mining” proposed in the paper [9]:
• Problem definition: business question.
• Data understanding: validate quality and confidential-ity.
• Data integration and sampling: creation and selection of variables.
• Business modeling and learning to the evaluation. • Refinement and interpretation: variable contributions. • Resulting outcomes: to confirm the relevance of the extraction of customers and compare lists of routing. • To choice marketing channels communication. • To calculate the return on investment.
3.3
Preprocessing
3.3.1
Data preparation
We decided to collect data from our datawarehouse com-posed of approximately 61 000 mega-bytes and 140 tables. We created three distinct datasets: binary target training dataset, continuous target training dataset and application dataset.
• Firstly, the binary target training dataset is the set of all active professional customers. The binary tar-get variable is 1 for customers who came to the last promotional campaign and who exceeded 1 500 =Cof turnover, 0 otherwise.
• Secondly, the continuous target training dataset is the set of all active professionals who participated in the last campaign, other customers being removed. The continuous target variable is the net margin of the last campaign.
• Third, the application dataset is based on professional customers filtered by the purchasing director and sales force teams: customers whose account is active (which realized a minimal turnover) and which are not im-portant accounts (city councils, government agencies, etc.). Consequently, by taking this knowledge into ac-count, the work done by the sales force team can be simplified and automated.
The binary target training dataset contains 12 170 ob-servations (15.35 % with value 1). The continuous target training dataset contains 3 677 observations. The applica-tion dataset contains 16 500 observaapplica-tions.
3.3.2
Creation and selection of variables
Real world business problems and requirements are often tightly embedded in domain-specific business rules and pro-cesses with expertise (referred to constraint mining in [9]). Therefore, customers are described by three kinds of vari-ables.
• Internal variables (in the datawarehouse): address, busi-ness, loyalty, main salesperson, main store, authorized outstanding, etc.
• External variables (obtained from a Coface file): num-ber of employees, professional category, etc.
• Aggregates (computed from the datawarehouse for each customer):
– Sum of net margins of the last similar campaigns. – Sum of turnovers and number of command lines for six periods of one month before the campaign. – Sum of net margins for each product family (wood,
metal ceilings, tools, etc.) in the year before the campaign.
This preprocessing of data produces a model with 173 variables (Table 7).
Table 7: Types of variables Category Number Type
Internal 13 nominal, ordinal External 15 spread-sheets, non structured Aggregates 144 continuous
Target 1 binary or continuous
3.4
Model generation
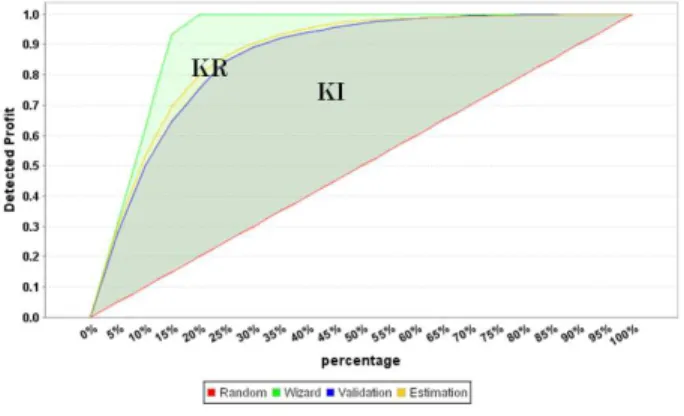
The binary target model is accurate and robust with KI = 0.857 and KR = 0.975. 155 of 173 variables have been se-lected preserving the accuracy and robustness of the model. The two curves on Figures 3 and 4 allow us to judge the quality of the model.
Figure 3: Lift curve of binary target model.
Figure 4: ROC curve of binary target model. The continuous target model is less accurate and less ro-bust than the first model with KI = 0.717 and KR = 0.968. In the following interpretation, we focus on the binary target model.
3.5
Model interpretation
Let us visualize the contribution of variables (Section 2.1.1) to indicate the variables contributing to the purchase (binary target) during the promotional campaign (Figure 5).
Figures 6 and 7 represent the significance of the values of the variables. Y-axis indicates whether the value has a positive or a negative influence on the binary target variable. • Figure 6 shows the significance of the variable ”turnover”
(Aggregate 6M8B SUM 5 in Figure 5). Most of the customers who achieved a high turnover two months prior to the promotional campaign are more likely to increase their purchases.
Figure 6: Significance of variable ”turnover” for the month 5 (two months before the campaign).
• Figure 7 shows the significance of the variable ”sales-persons” (Figure 5). Some salespeople contribute very positively to the purchase during the campaign. On the contrary, we found that 35.1 % of salespeople con-tribute negatively to the campaign. Consequently, we decided to enhance the salesperson table in the dataware-house, by adding new variables (number of customers, proportion of active customers, number of visits, port-folio turnover, etc.) in order to better understand the salesperson’ behaviors (referred to loop-closed min-ing [9]). Also, we decided to balance the salespersons’ portfolios.
Figure 7: Significance of variable ”salespersons”.
3.6
Model application
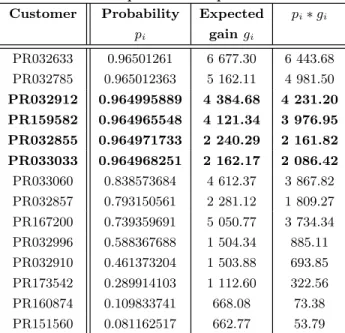
The application of the model is done on the application dataset (16 500 observations). We obtain two variables pi
and gi allowing us to sort customers (Section 2.2.2). For
example, customers PR032912, PR032855, PR033033 and PR159582 have the same probability pi(10−4after decimal
point) but PR032912 and PR159582 are higher in the list because their expected net margins giare twice as high
(Fig-ure 8). The combination of the two ridge regressions allows us to reach the two objectives of the campaign: to increase sales and to improve the ROI.
Table 8: A salesperson’s sample list of clients Customer Probability Expected pi∗ gi
pi gain gi PR032633 0.96501261 6 677.30 6 443.68 PR032785 0.965012363 5 162.11 4 981.50 PR032912 0.964995889 4 384.68 4 231.20 PR159582 0.964965548 4 121.34 3 976.95 PR032855 0.964971733 2 240.29 2 161.82 PR033033 0.964968251 2 162.17 2 086.42 PR033060 0.838573684 4 612.37 3 867.82 PR032857 0.793150561 2 281.12 1 809.27 PR167200 0.739359691 5 050.77 3 734.34 PR032996 0.588367688 1 504.34 885.11 PR032910 0.461373204 1 503.88 693.85 PR173542 0.289914103 1 112.60 322.56 PR160874 0.109833741 668.08 73.38 PR151560 0.081162517 662.77 53.79
Let us generate a cost matrix to personalize naive profit curve (Section 2.1.3). To achieve this task, we must define the average net margin G achieved by a customer during the last campaign: about 1 500 =C. In the same way, we have to calculate the average spending communication H per customer: about 62.5 =C. The maximum of the naive profit curve on Figure 8 indicates the optimum proportion of customers to contact: 50.3 % with 88.14 % of the profit rate. Our routing list is composed of these 8 230 customers.
3.7
Model validation
The statistical validation of the model was verified in sec-tion 3.4 with two indexes KI and KR. However, we have to validate results by comparing sales force team list with our methodology list. Quantitatively, about 7 000 customers were common to both lists. Moreover, all customers present in sales force team list are in our list. However, 1 175 cus-tomers are not included in the sales force team list. They represent very interesting but hardly-to-find customers: very recent customers and customers whose turnover has just been growing.
3.8
Attribution of channel classes
The experience gained over ten years of routing during promotional campaigns led us to define three channel classes with sales management (Section 2.3.4) representing a strate-gic choice for VM Mat´eriaux company.
• Class 1: {Visit, Mail, Phone, SMS}. • Class 2: {Mail, Phone, Fax}. • Class 3: {SMS, E-mail}.
The sum of each variable costs, V Cj, per channel class,
C, was calculated using Table 5 and is expressed in Table 9. Moreover, the values for certainty, Ctj, and convincement,
Cmj, per channel j are taken from Table 6, and the values
for X, Y and Z are given in Table 10 (validated by VM Mat´eriaux sales force team). The assignment of a customer, i, to the best channel class, Ci, is obtained from
Equa-tion 7 (SecEqua-tion 2.3.4) and summarized in Table 11. Also, the assignment is limited (roughly) by the maximum con-tacts property in Table 6.
Table 9: Sum of variable costs of channel classes Channel class Sum of variable costs
1 253.89 =C 2 3.838 =C 3 0.09 =C
Table 10: Values for X, Y and Z Variables Values Justification
X 50 000 =C operation fixed costs Y 100 000 =C data mining costs Z 5 000 =C gain time
(5 man-day)
Table 11: Channel classes distribution Channel class Number of customers
1 2 091 customers 2 4 448 customers 3 1 691 customers
Note that for VM Mat´eriaux, a constraint coefficient, µij,
is introduced in Equation 6 to multiply the variable costs
V Cj. Indeed, µij is equal to 1 except for channel j = V isit
for which the value depends on the turnover of the customer i. The goal is to encourage salespeople to visit customers presenting a good potential but a small penetration rate.
3.9
Promotional campaign ROI
We applied the formula 8 of Section 2.4 to compute the ex-pected ROI. This estimation of profit was very good since it proved (after the campaign) to be equal to the effective profit (with less than 5 % of error margin). During the previous operation, the rate of buyers was 18 %. Whereas in the last one, by applying our methodology, the rate of buyers raised up to 22 %, the turnover was increased by 5 %, and 115 new customers participated, representing about 1 200 000 euros of additional turnover.
4.
CONCLUSION AND FUTURE WORK
To improve customer relationship, the company must know what actions to take to optimize its communication with customers. In this paper, we propose an actionable knowl-edge discovery methodology for one-to-one marketing which endeavours to contact the right customer through the right communication channel. This methodology is referred to as domain-driven in-depth pattern discovery. Our method-ology applied to CRM first requires a measurement of the tendency for the customers to purchase a given item, and second requires an optimization of the Return On Invest-ment by selecting the most effective communication chan-nels for attracting these customers. The application of ridge regression models built with KXEN has been able to high-light the richness of VM Mat´eriaux datawarehouse to predict customers’ tendency to purchase an item during promotional campaigns and to choose the most suitable marketing class channels. The ROI was improved, with 115 new customers, representing about 1 200 000 euros of additional turnover. The construction of datasets and the production of models were automated in VM Mat´eriaux company. We designed a prompt checking by decision makers and allowing to cre-ate datasets (Section 3.3.1) on the most active customers. Today, models are automated and results of the regressions are stored in the datawarehouse. The model is being gener-alized to three promotional marketing campaigns in April, September and November of each year.
From our experience, our methodology can be extensively used for any type of one-to-one multichannel promotional campaign. The actionable knowledge discovery was intro-duced in VM Mat´eriaux datawarehouse with the aim of in-tegration into a CRM software program. The results dis-cussed in this paper offer effective solutions to extract ac-tionable knowledge to intelligent CRM for companies. In our future work, we will try to combine other methods of data mining to improve our methodology (associations rules for instance) with customer purchasing potential, with a view of preventing customer ”churning” during promotional cam-paigns, and of suggesting high profit materials to customers with the highest tendency.
5.
ACKNOWLEDGMENTS
The authors would like to thank Pierrick Richard and Ga¨etan Blain (VM Mat´eriaux company) for supporting this work. They also thank Laurent Tessier (KXEN company) for his comments.
6.
REFERENCES
[1] R. Agrawal and R. Srikant. Fast Algorithms for Mining Association Rules in Large Databases. In Proceedings of the 20th International Conference on VLDB, pages 487–499, September 1994.
[2] M. Ankerst. Report on the SIGKDD-2002 panel the perfect data mining tool: interactive or automated? SIGKDD Explor. Newsl., 4(2):110–111, 2002. [3] P. Barwise and J. U. Farley. The State of Interactive
Marketing in Seven Countries: Interactive Marketing Comes of Age. Journal of Interactive Marketing, 19(3):67–80, 2005.
[4] L. Cao. Domain-Driven, Actionable Knowledge Discovery. IEEE Intelligent Systems, 22(4):78–89, 2007.
[5] L. Cao. Domain Driven Data Mining (D3M). In ICDMW ’08: Proceedings of the 2008 IEEE
International Conference on Data Mining Workshops, pages 74–76, Washington, DC, USA, 2008. IEEE Computer Society.
[6] L. Cao, C. Luo, and C. Zhang. Developing Actionable Trading Agents. Intelligent Agent Technology, IAT ’07. IEEE/WIC/ACM International Conference on, pages 72–75, November 2007.
[7] L. Cao and Y. Ou. Market Microstructure Patterns Powering Trading and Surveillance Agents. Journal of Universal Computer Science, 14(14):2288–2308, 2008. [8] L. Cao, P. Yu, C. Zhang, and H. Zhang. Data Mining
for Business Applications. Springer, 2009. [9] L. Cao and C. Zhang. Domain-Driven Actionable
Knowledge Discovery in the Real World. In PAKDD, pages 821–830, 2006.
[10] L. Cao and C. Zhang. Domain-Driven Data Mining: A Practical Methodology. In I. Global, editor,
International Journal of Data Warehousing and Mining (IJDDWM), volume 2, pages 49–65, 2006. [11] L. Cao and C. Zhang. Mining Impact-Targeted
Activity Patterns in Imbalanced Data. IEEE Trans. on Knowl. and Data Eng., 20(8):1053–1066, 2008. [12] H. M. David J. Hand and P. Smyth. Principles of
Data Mining. MIT Press, Cambridge, MA, USA, 2001. [13] C. Drummond and R. Holte. Cost Curves: An
Improved Method for Visualizing Classifier Performance. In S. Netherlands, editor, Machine Learning, volume 65, pages 95–130, October 2006. [14] F. Fogelman-Souli´e and E.Marcad´e. Industrial Mining
of Massive Data Sets. NATO Science for Peace and Security Series, Information and Communication Security, 19:44–61, 2008.
[15] U. Fayyad, G. Grinstein, and A. Wierse. Information Visualization in Data Mining and Knowledge Discovery. Morgan Kaufmann, 2001.
[16] U. M. Fayyad, G. Piatetsky-Shapiro, P. Smyth, and R. Uthurusamy. Advances in Knowledge Discovery and Data Mining. AAAI/MIT Press, 1996.
[17] W. Graco, T. Semenova, and E. Dussobarsky. Toward Knowledge-Driven Data Mining. In ACM SIGKDD Workshop on Domain Driven Data Mining, pages 49–54, 2007.
[18] R. Gras, E. Suzuki, F. Guillet, and Filippo. Statistical Implicative Analysis. Studies in Computational Intelligence 127, 2008, Springer, 2008.
[19] Q. Gu, L. Zhu, and Z. Cai. Study on Measure Criteria in Evaluating Classification Performance: Lift charts, ROC and Precision-Recall Curves. In Progress In Intelligence Computation and Applications, pages 488–492. China Univ Geosciences Press, 2007. [20] F. Guillet and H. Howard. Quality Measures in Data
Mining. Springer, 2007.
[21] S. H. Ha, S. M. Bae, and S. C. Park. Customer’s Time-Variant Purchase Behavior and Corresponding Marketing Strategies: an Online Retailer’s Case. Computers and Industrial Engineering, 43(4):801 – 820, 2002.
[22] J. Han, L. V. S. Lakshmanan, and R. T. Ng. Constraint-based, multidimensional data mining. Computer, 32(8):46–50, 1999.
[23] T. Highley and P. Reynolds. Marginal Cost-Benefit Analysis for Predictive File Prefetching. In Proc. of the 41st Annual ACM Southeast Conference, 2003. [24] D. A. Keim. Information Visualization and Visual
Data Mining. IEEE Transactions on Visualization and Computer Graphics, 8(1):1–8, 2002.
[25] A. Kusiak. Data mining: Manufacturing and Service Applications. International Journal of Production Research, 44:4175–4191, 2006.
[26] C. X. Ling and C. Li. Data mining for Direct
Marketing: Problems and Solutions. In Proceedings of the Fourth International Conference on Knowledge Discovery and Data Mining, pages 73–79. AAAI Press, 1998.
[27] M. Lobur, Y. Stekh, A. Kernytskyy, and F. Sardieh. Some Trends in Knowledge Discovery and Data Mining. In Perspective Technologies and Methods in MEMS Design 2008, number 95-97, May 2008. [28] O. Maimon and L. Rokach. Data Mining and
Knowledge Discovery Handbook. Computer Science, 2005.
[29] C. L. Ming Ren, Zuoliang Chen and G. Chen. An Evolving Information System Based on Data Mining Knowledge to Support Customer Relationship Management. In Advanced Management of Information for Globalized Enterprises, pages 1–5, September 2008.
[30] G. Piatetsky-Shapiro. Data mining and Knowledge Discovery 1996 to 2005: Overcoming the Hype and Moving from University to Business and Analytics. Data Min. Knowl. Discov., 15(1):99–105, 2007. [31] B. Rahul and Z. Yi. CRM Systems Used for Targeting
Market: A Case at Cisco Systems. In ICEBE ’05: Proceedings of the IEEE International Conference on e-Business Engineering, pages 183–186, Washington, DC, USA, 2005. IEEE Computer Society.
[32] R. T. Trevor Hastie and J. Friedman. The Elements of Statistical Learning: Data Mining, Inference and Prediction. Springer, 2 edition, February 2009. [33] V. Vapnik. The Nature of Statistical Learning Theory.
Springer-Verlag, 2 edition, 1999.
[34] Q. Yang, J. Yin, C. Ling, and T. Chen. Postprocessing Decision Trees to Extract Actionable Knowledge. In Third IEEE International Conference on Data Mining, pages 685–688. IEEE Computer Soc, 2003. [35] Q. Yang, J. Yin, C. Ling, and R. Pan. Extracting
Actionable Knowledge from Decision Trees. IEEE Transactions On Knowledge and Data Engineering, 19(1):43–56, Jan 2007.
[36] Y. Zhao, C. Zhang, and L. Cao. Post-Mining of Association Rules: Techniques for Effective Knowledge Extraction. IGI Global, 2009.
[37] Y. Zhao, H. Zhang, L. Cao, C. Zhang, and H. Bohlscheid. Combined Pattern Mining: From Learned Rules to Actionable Knowledge. In AI ’08: Proceedings of the 21st Australasian Joint Conference on Artificial Intelligence, pages 393–403, Berlin, Heidelberg, 2008. Springer-Verlag.