Momentum During a Running Competition: A Sequential Explanatory
Mixed-Methods Study
VINCENT G. BOUCHER†1, SANDRA PELAEZ‡2, ANDRÉE-ANNE PARENT‡3, JACQUES
PLOUFFE‡4, and ALAIN S. COMTOIS‡5
1Department of Psychology, University of Quebec-Montreal, Montreal, Quebec, CANADA; 2Department of Educational and Counselling Psychology, McGill University, Montreal, Quebec,
CANADA; 3Department of Nursing, University of Quebec-Rimouski, Rimouski, Quebec,
CANADA; 4Department of Health Sciences, University of Quebec-Chicoutimi, Chicoutimi,
Quebec, CANADA; 5Department of Physical Activity Sciences, University of Quebec-Montreal,
Montreal, Quebec, CANADA
†Denotes graduate student author, ‡Denotes professional author
ABSTRACT
International Journal of Exercise Science 13(5): 615-632, 2020. The purpose of this study was to better understand the psychological momentum (PM) in varsity cross-country competitive runners during a 3000 m selection trials. A sequential explanatory mixed methods design was used: recruitment trial race day (quantitative) and interview day (qualitative + maximal aerobic running speed [MARS]). Sample was consisted of fifteen university distance runners (n = six women [25.9 ± 7.0 years old; 22.2 ± 1.8 BMI] and nine men [23.2 ± 2.4 years old; 22.6 ± 1.6 BMI]). During the recruitment trial race, athletes’ MARS was measured and used to create a performance index (PERFI) relative to selected moments. Also, the recruitment trial race was filmed. During the interviews, the
recorded film was used to support athletes in the identification of key moments of the race, as well as to discuss positive and negative PM. PM was both defined by participants and devised by three themes: psychological, physiological and psychophysiological change. A significant PERFI difference (p < 0.001) was observed between
positive (97.04 ± 5.88%) and negative (108.46 ± 7.76%) moments of PM. The results of PERFI for men and women
athletes were not significantly different (p = 0.118). The PERFI standard deviation for women was not correlated (r2
= 0.26, p = 0.30) with the 3000 m time trial performance, but it was significantly correlated for men (r2 = 0.94, p <
0.001). The results of the present study could help developing interventions to focus on specific elements of the momentum such as race management/strategy, the attentiveness of the runner during the race and other elements of mental and physical preparation of the athletes.
KEY WORDS: Psychology; performance; cardiovascular; cardiorespiratory; assessment INTRODUCTION
The psychological momentum (PM) is a phenomenon that modifies an individual’s behavioral response and achievement (6) that was firstly defined as the momentum: “a state of dynamic intensity marked by an elevated or depressed rate in motion, grace, and success” (1). This psychological state of mind evolves according to the area of research. In the field of sports,
evidence indicates that it is the athlete’s perspective of his or her performance (goal or outcome) as being effective (e.g., passing a competitor during an endurance competition) or ineffective (e.g., slowing down during an endurance competition) in regard to the established goals or outcomes, that initiates the positive or negative cycle that in turn affects athletic performance (18).
The PM is a complex, non-linear, individual or team phenomenon (37) that largely depends on the combination of both cognitive and emotional perception, as well as past experience and expectation (8, 19). Thus, any performance that: (a) is perceived as a success (e.g., winning a race); (b) contributes to a fulfilling state of mind (e.g., enhanced self-confidence); and (c) leads to heightened expectations that exceed past experiences (e.g., improved performance) can be considered as a positive PM that will increase the probability of being followed by further favourable outcomes. A similar chain of events would occur during a negative PM: (a) perception of failure (e.g., never finish his training); (b) a dissatisfying state of mind (e.g., lost of motivation) ; and (c) increased expectations that fuel negative past experiences (e.g., rumination) (11). Previous studies demonstrated that the athlete’s PM has an impact on athletic performance (6, 29, 37). For this reason, the PM was used as a predictor of an athlete’s performance (18, 29). Despite the promising role the PM plays regarding athletic performance, current evidence is limited and leaves some questions unanswered. For example, not only have few studies analysed PM as a variable in a sporting context; but also, findings are inconsistent between studies (i.e., same study design with opposite results). In this vein, a study that assessed cyclists’ psychological responses (i.e., self-reported questionnaires) in conjunction with physiological responses (i.e., cycling power outputs measured in watts) in a simulated competition on a stationary bike found a correspondence between the variables (29, 37). However, later research using a similar simulated bike competition resulted in less consistent evidence, in terms of conjunction between PM perception and physiological responses (9). Therefore, a first question that requires exploration is whether psychological and physiological responses are connected to each other during specific situations in the time trial of each participant. Also, while some studies have suggested that physiological parameters such as the cardiorespiratory system and biomarkers (cortisol) change along a competition, as an athlete’s or team’s anxiety level does (12, 13, 28), the relationship between psychophysiological variables and an athlete’s performance is still poorly understood. Thus, a second question that needs to be addressed is whether psychophysiological responses are in turn responsive to an athlete’s PM. Finally, no study has used a mixed method approach to examine athletes’ perspective of the relationship between PM and performance along a competition. Hence, a third question calling for attention is whether athletes’ perception of their PM is related to their athletic performance. Thus, the aim of the present study was to better understand the PM in varsity cross-country competitive runners during a 3000 m time trial.
In sum, an understanding of the PM could provide insight into how to maximize athletic performance. Middle distance running is a unique sport regarding the effort exerted because it is typically independent of the context whether the athlete is within a competition or training session. Firstly, while either competing or training, the pacing strategy will set the runners into
two ‘mindsets’ being the physiological and the behavioral response. Secondly, middle-distance runners go through different phases during a race or training session that affect their perceived exertion of effort, the running speed performed, and fatigue points (36). In addition, the interrelation of psychophysiological variables surrounding the PM, as enacted and perceived by runners, has not been studied and could lead to novel aspects of competition preparedness. We hypothesized that the athlete’s perspective of the PM would be reflected in both their physiological response and performance. Therefore, these qualities made middle distance running the task of choice for examining PM to answer the research questions.
METHODS
Participants
The study was approved by the Institutional ethics committee of the hosting university. Students interested in being part of the cross-country varsity team for the 2015-2016 season were invited by the head coach of the team to participate in the recruitment trial race day that consisted of a 3000 m time trial. Twenty-five athletes were present at the recruitment trial race day. Before the try-out started, the study was presented and described by the first author. Athletes interested in participating in the study were encouraged to ask questions regarding the procedures and received specific information. Signed written informed consent was obtained from all participants and included the transmission of averaged and personal results of participants wishing to receive them.
Protocol
We designed a Sequential Explanatory Mixed-Method design (20) to explore the relationship between the athlete’s PM description, the associated physiological response, and the athletic performance during a race. This design implies that the quantitative data were collected and analysed prior to the qualitative data. The athlete’s physiological responses were quantitatively measured; whereas psychological perceptions of feelings and emotions during the race were qualitatively assessed. Qualitative data ensures to refine and define the physiological and psychological responses experienced by the athlete. Also, the interval of time between sessions helped optimize the awareness of what was experienced during the time trial and potentially helped the athlete’s retrospective recall on past events.Put together, this information was used to analyse and interpret the athlete’s overall PM experience during the race. The purpose of collecting this information in two different sessions was to gather information from the athletes about their performance during the recruitment trial race day. As well, following the interview, an incremental test was performed, assessing the MARS of the participant (details below). The time trial and the incremental test, two high-intensity tests, were done on two different days in order to reduce the effect of fatigue on athletes. Specificities regarding each of these sessions are described in the following paragraphs. This research was carried out fully in accordance to the ethical standards of the International Journal of Exercise Science (27).
Session 1. Recruitment Trial Race Day: Anthropometric measurements: Participants’ weight and height were taken with a standard scale and a stadiometer (Omron HBF-510W, Omron Healthcare Inc., Illinois, USA; SECA 217, United Kingdom, respectively).
Cardiorespiratory measurements: During the race, heart rate (beats per minute [bpm]), breathing rate (respiratory cycles per minute [rcpm]), and running speed were assessed using the BioHarness 3, a personal monitoring belt that measures heart rate and breathing rate in real time (Zephyrs Technology Corp., Annapolis, Md.) (24). Members of the research team helped the runners install the heart rate monitor. A period of twenty minutes was allocated for a dynamic warm up around the 400 m track.
Race time: The recruitment trial race, 3000 m time trial, consisted of completing the required distance in the shortest time possible, followed by a 10-minute cool down period. The running time was measured using a chronometer and the race was video-recorded with four cameras (Panasonic HC-V110) equidistantly placed on tripods around the track.
Environmental assessment: The external temperature and humidity were measured with a WBGT device (Wet- Bulb Globe Temperature, 3M Questemp R., RAECO-LTC, Illinois, USA) to ensure comparability between both assessments.
Session 2. Interview Day and Incremental test: Interview: The individual face-to-face semi-structured interview was held in a quiet room that allowed for a confidential conversation aiming to explore the athletes’ view and experience of the recruitment trial race day (15). The semi structured interviews were performed using a qualitative inquiry under an interpretative epistemological stance (33). This approach was used by a member of the research team (V.G.B.) to gather unbiased knowledge on the participant’s perspective of how the race was lived that may explain the physiological variations in line with PM swings. In fact, transparency in the description of the qualitative method is required at the epistemological and ontological level for authenticity of participant statements (34). To achieve this, participants were provided with an explanation of the study objectives prior to the interview. The interviewer had experience in varsity competitive running, in individual interviewing and knowledge of sport psychology. Thus, the interviewer's expertise allowed the participants to be led into more specific and profound discussion areas (e.g., on the emotions and feelings of the athlete). The conceptualization of the questions was achieved by taking into account the definition of the PM (8, 11, 19) in order to identify the different components found (e.g., emotional perception, expectations, negative and positive feelings, sensations and/or performance). Examples of open-ended questions asked to the participants were: how would you describe your performance during the race? How did you feel during the race? What were your negative and positive key moments? Can you identify these moments in the video? How would you describe them? How did you experience particular sensations during the race? To elicit the conversation, the participants were invited to discuss their overall performance. Also, participants watched the race recorded during the first session of data collection, which was used to enhance the discussion. The participants were interviewed for 21.0±4.4min. The interview was audio recorded (Olympus LS-14 Linear Pcm Recoder, Olympus Corporation of the Americas, Pennsylvania, USA) and transcribed verbatim.
Incremental Test: Following the interview, an incremental test was used to determine the MARS of participants on a treadmill test. Members of the research team helped the participants to
install the heart rate monitor (BioHarness 3; Zephyrs Technology Corp., Annapolis, Md). Participants began the test with a recording of baseline measurements at rest (five minutes sitting). The running portion of the MARS test began with a three-minute warm-up at a speed of 10 km/h that was then increased 1 km/h per minute. The test ended when the participant could no longer tolerate the running speed or needed to stop. The MARS test was followed by a five-minute recovery period.
Environmental assessment: The external temperature and humidity were measured with a WBGT device (Wet- Bulb Globe Temperature, 3M Questemp R., RAECO-LTC, Illinois, USA) to ensure the fidelity and comparability of the assessments.
Statistical Analysis
Quantitative Analysis: Results are presented as mean ± standard deviation. Statistical significance was set at p <0.05. Pearson correlations were used to analyse relationships between the PERFI standard deviation in relation with the trial time. ANOVA 1 factor (biological sexes)
was used to analyse PERFI and difference between PPM moments (positive vs. negative).
Analyses were performed using SPSS software (SPSS 21 software IBM, New York, USA) and graphics were plotted with a commercially available graphics software (Sigma Plot version 12.0., Systat Software, Inc.). Also, a performance index was created, as in similar studies (3, 39). The formula used to elaborate a performance index is based on quantification of effort during an event. It is the combination of a performance (running speed) and a physiological parameter in
order to obtain a performance index (PERFI) that could be linked to PM (perceptions of
performance). The following formula was used:
PERFI = [(4)**7 &'()*+,+,'-) / (4)**7 (01 23$4 +*5+)][(#$ &'()*+,+,'-) / (#$(01 23$4 +*5+)] • 100
where “HR competition” is the heart rate achieved during the 3000 m time trial for a distinct time point in the race, “HRmax MARS test” is the maximal heart rate achieved during the incremental test, “speed competition” is the speed achieved during the recruitment trial race for a distinct time point in the race and “speed max MARS test” is the maximal speed achieved during the incremental test on the treadmill.
Qualitative Analysis: Thematic analysis (4) was used to analyse participants’ perception of both the psychological and physiological responses and their recruitment trial race (3000 m) performance. The premise was that participant feedback of their perception during the time trial approach could be associated to physiological parameters. We assumed that participants would be able to recall their “feelings” and how they were adapting physically and mentally to make the cut for the varsity team. This deductive analytic strategy that requires the investigator to understand the context and environment in which the data is produced, builds on an existing theoretical perspective described in the previous section (1, 6). Data analysis was guided by a coding scheme that considered both Venhorst, Micklewright and Noakes framework and the research questions (40). The aforementioned framework provides a description of ‘physiological’ (e.g., physical sensations emerging from the time trial), ‘psychological’ (e.g., perceived mental strain), and ‘psychophysiological’ (e.g.,
psycho-neuro-physiological-endocrinological distress response, e.g., heart rate, respiratory rate) changes. The research questions were: 1) are psychological and physiological responses connected to each other during specific situations in the time trial? 2) are psychophysiological responses responsive to an athlete’s PM? and 3) is athletes’ perception of their PM related to their athletic performance? Qualitative analysis was performed manually by two authors (V.B.G. and A.-A. P) according to the reflexive and iterative 6 steps proposed by Halcomb and Davidson (16, 41): 1) Audiotaping of interviews and concurrent note taking, 2) Reflective journalizing immediately after an interview (review field notes and expand initial impression), 3) Listening to the audiotape and amending/revising field notes and observations, 4) Preliminary content analysis, 5) Secondary content analysis, and 6) Thematic review. The In Vivo coding was used during the content analysis to capture the behaviours and perspective from the participants to explain how they lived their time trial (examples of codes: psychological or physiological responses; positive or negative PM) (31). Following all these steps, the two coders compared and discussed their codes until consensus was achieved. There is no standard percentage of agreement among qualitative researchers, but a minimum percentage to initial agreement between coders for content analysis has been established at 70%, where eventually discussion leads to a group consensus (32). In cases where there was no agreement between coders, a third investigator from the research team acted as a third party (A.S.C.), decided and classified the sentence. The empirical saturation was achieved with the interviews (5).
Integration of qualitative and quantitative evidence: Using the video recording of the recruitment trial race as a thread for discussion, athlete’s perspective of the psychological and physiological changes experienced were paired with their time point in the race. Thus, quantitative and qualitative evidence were treated alternately to better depict athletes’ perspective of the PM.
RESULTS
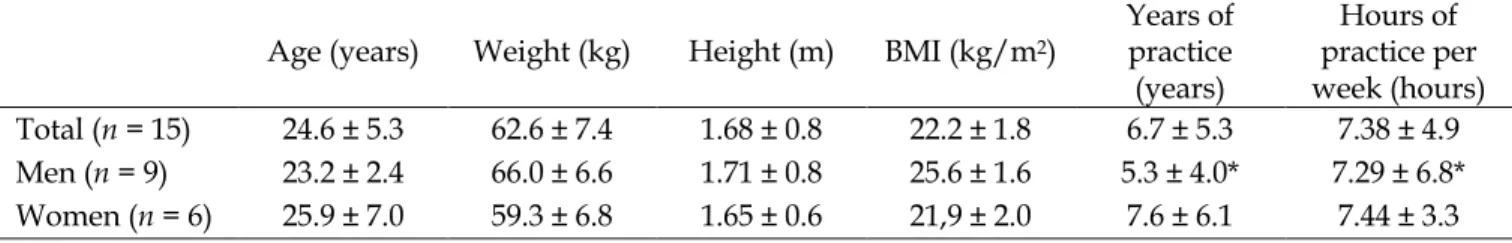
Participant characteristics: Fifteen athletes consented to participate and completed the two sessions (six women and nine men). Table 1 shows participants characteristics.
Table 1. Athlete Characteristics
Age (years) Weight (kg) Height (m) BMI (kg/m2)
Years of practice (years) Hours of practice per week (hours) Total (n = 15) 24.6 ± 5.3 62.6 ± 7.4 1.68 ± 0.8 22.2 ± 1.8 6.7 ± 5.3 7.38 ± 4.9 Men (n = 9) 23.2 ± 2.4 66.0 ± 6.6 1.71 ± 0.8 25.6 ± 1.6 5.3 ± 4.0* 7.29 ± 6.8* Women (n = 6) 25.9 ± 7.0 59.3 ± 6.8 1.65 ± 0.6 21,9 ± 2.0 7.6 ± 6.1 7.44 ± 3.3
Note: * information for 6 participants; BMI, body mass index; Kg, kilogram; m, meter
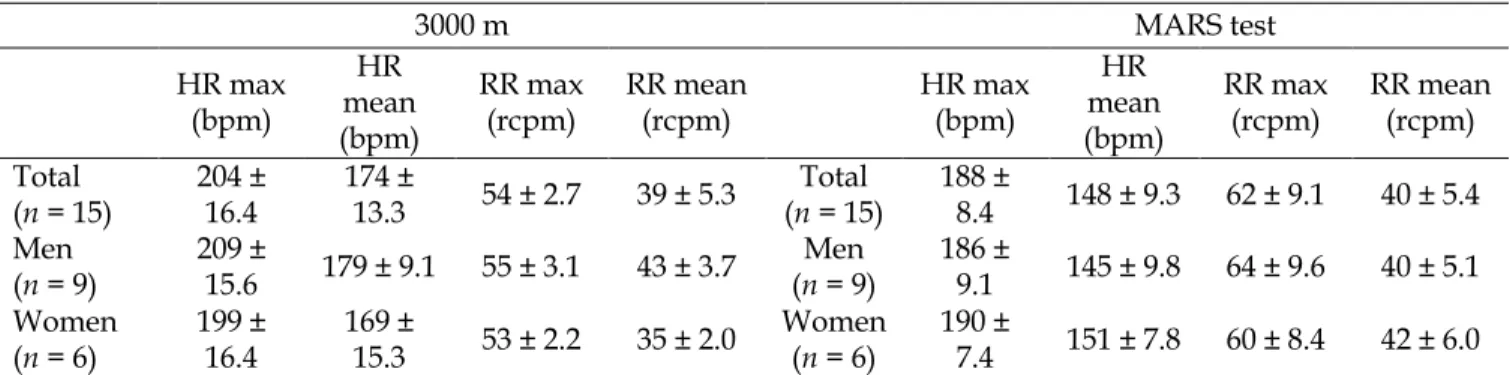
Physiological- and performance-related variables: Table 2 presents physiological parameters during the competition on the athletics’ track and data obtained during the MARS treadmill test. Mean values for the maximal respiratory rate (RRmax) were significantly lower on the MARS test than during the competition on the track and HRmax was significantly higher during the competition on track (53 ± 2.8 rcpm and 65 ± 12.0 rpm, p < 0.05; 195 ± 8.8 rcpm and 188 ± 8.7
rpm, p < 0.01, respectively). During these two sessions, the performance was measured over time during the 3000 m time trial (group average = 729.4 ± 114.6s) and the maximum aerobic running speed reached (group average) 16.1 ± 1.8 km/h. Sex-related significant differences (p < 0.01) regarding performance were identified between men and women for both the 3000 m time and MARS test, respectively, where Women reached 828.9 ± 79.3s and 14.4 ± 1.0 km / h, and men achieved 639.8 ± 43.3s; 17.3 ± 1.2 km/h.
Table 2. Cardiorespiratory parameters during the competition and MARS test.
3000 m MARS test HR max (bpm) HR mean (bpm) RR max (rcpm) RR mean (rcpm) HR max (bpm) HR mean (bpm) RR max (rcpm) RR mean (rcpm) Total (n = 15) 204 ± 16.4 174 ± 13.3 54 ± 2.7 39 ± 5.3 (n = 15) Total 188 ± 8.4 148 ± 9.3 62 ± 9.1 40 ± 5.4 Men (n = 9) 209 ± 15.6 179 ± 9.1 55 ± 3.1 43 ± 3.7 (n = 9) Men 186 ± 9.1 145 ± 9.8 64 ± 9.6 40 ± 5.1 Women (n = 6) 199 ± 16.4 169 ± 15.3 53 ± 2.2 35 ± 2.0 Women (n = 6) 190 ± 7.4 151 ± 7.8 60 ± 8.4 42 ± 6.0 Bpm, Beat per minute; HR, Heart rate; MARS, Maximal Aerobic Running Speed; rcpm, respiratory cycle per minute; RR, respiratory rate
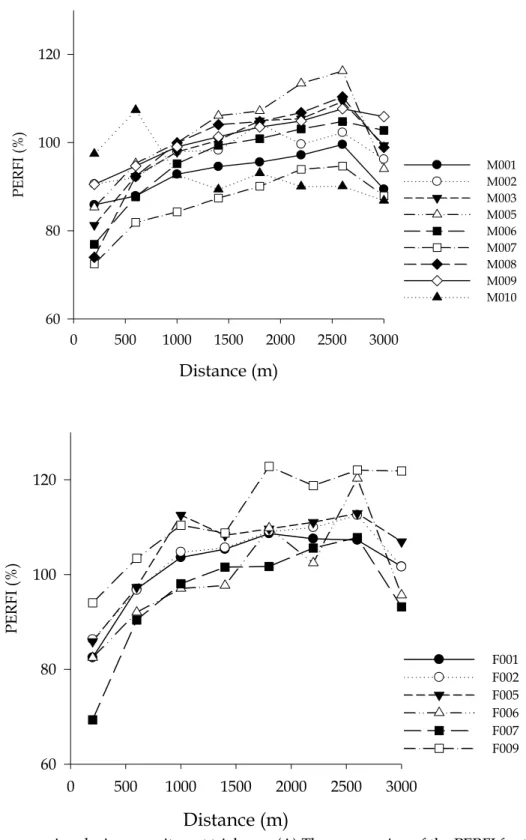
The PERFI was calculated for different split times at 200, 600, 1000, 1400, 1800, 2200, 2600 and
3000 m. Figure 1 shows the results of 15 participants during the recruitment trial race (Figure 1A). Each participant is shown in this figure and the continuous thick lines represent the group standard deviation. The average PERFI for women, men and all runners are presented in Table
3. The results for men and women runners were not significantly different (p = 0.118). The average PERFI for all runners were calculated for the eight different split times mentioned.
Figure 1B and 1C shows the performance indicators for the 3000 m selection trials for men and women, respectively.
A) Distance (m) 0 500 1000 1500 2000 2500 3000 PERFI (% ) 60 70 80 90 100 110 120 130 M001 M002 M003 M005 M006 M007 M008 M009 M010 F001 F002 F005 F006 F007 F009 SD group
B)
C)
Figure 1. PERFI progression during recruitment trial race. (A) The progression of the PERFI for the different paths to the finish line (every 400 m except the first 200 m). (B) The men runners’ progression of the PERFI for the different paths to finish line (every 400 m except the first 200 m). (C) The women runners’ progression of the PERFI for the different paths to finish line (every 400 m except the first 200 m). The values are means ± SD.
Distance (m) 0 500 1000 1500 2000 2500 3000 PERF I (% ) 60 80 100 120 M001 M002 M003 M005 M006 M007 M008 M009 M010 Distance (m) 0 500 1000 1500 2000 2500 3000 PERF I (% ) 60 80 100 120 F001 F002 F005 F006 F007 F009
Towards a better understanding of participants’ perspectives of PM: Participants reported their lived experiences during the race as related to both the goals they set for the competition and the perception of their performance as the competition was going through. We extracted representative quotes that were back translated from French into English. To preserve participants’ identities, we use pseudonyms when presenting the representative quotes.
Perception of the performance: All athletes interviewed in the present study seemed to have experienced a PM during the race, having perceived the race as: (a) either a success or a failure (e.g., goal achievement), (b) a contributor to a fulfilling or state of mind (e.g., fully aware of being in a race and their sensations), and (c) outcome that led to heightened or reduced expectations that exceed past experiences (e.g., physiological sensation). In the following paragraphs, we present participants’ experiences regarding the race.
Connection among psychological and physiological responses during the PM: There are some examples of connection among psychological and physiological responses during the PM lived in the recruitment trial race, negatively and positively. John’s responses would read as follows: "[...] at the end, I had really bad lungs [feeling]. I was at the end, not too much energy". Andrew said: "I felt my heartbeat and I was already tired before starting [...] my body was saying you can just slow down." Also, Donald’s responses would read as follows: "[...] I do not know if we can say that negative, but it is true that it is, when someone is in front [of you during a competition]. I think I slowed down because I did not know my pace [...] a little stressed. " Charlie said: " [...] when you have no external reference point, I think you'll hear more your internal sensations [...] but it was mentally, I set a barrier [...]" Another example, Bianca said: "I was very nervous [...] that… there… yeah, I had feelings, many thoughts that came to mind." Finally, Lisa said: "[...] when I had my cramp, I was a little frustrated because I was sure, I'm sure this is because of nutrition".
On the other hand, some athletes seemed to live positive connections. Jade said: "Yes that's motivating, all the girls were there to encourage you and when you passed, you had a boost of energy." Similarly, Kim’s responses would read as follows: "Well that pushed me to ... I did not really get angry, but it was like ... I could not catch her, and she was still at the same distance in front of me I was trying to speed up, but it looks like it did not help, maybe it was she who was accelerating, but it motivated me to push and she encouraged us. " Finally, example from Jeanne
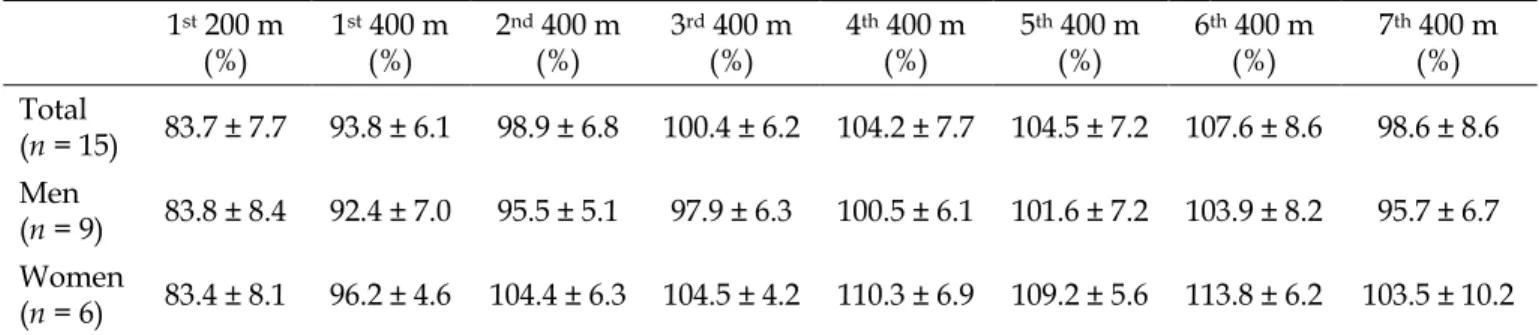
Table 3. The average PERFI for all runners.
1st 200 m (%) 1 st 400 m (%) 2 nd 400 m (%) 3 rd 400 m (%) 4 th 400 m (%) 5 th 400 m (%) 6 th 400 m (%) 7 th 400 m (%) Total (n = 15) 83.7 ± 7.7 93.8 ± 6.1 98.9 ± 6.8 100.4 ± 6.2 104.2 ± 7.7 104.5 ± 7.2 107.6 ± 8.6 98.6 ± 8.6 Men (n = 9) 83.8 ± 8.4 92.4 ± 7.0 95.5 ± 5.1 97.9 ± 6.3 100.5 ± 6.1 101.6 ± 7.2 103.9 ± 8.2 95.7 ± 6.7 Women (n = 6) 83.4 ± 8.1 96.2 ± 4.6 104.4 ± 6.3 104.5 ± 4.2 110.3 ± 6.9 109.2 ± 5.6 113.8 ± 6.2 103.5 ± 10.2
saying: "Basically my thoughts were trying to keep up the pace I wanted to have, so with my watch I looked, and I saw if I was slower, you're encouraging yourself."
Psychological responsiveness to PM: First, we reflect associations between PM psychological responsiveness and, some athletes set examples of goals to reach. It would read as follows for Alexandre: "[...] I had done my 10 km in 35 minutes 30 seconds by the end of May, I was thinking of doing that time, [...] what I was going for it was the time". Emily’s goal would read as follows: [...] Yeah, this is the medium-term objective [...] I wanted to be below 13 [minutes for the 3k] and I was in the 12 something [minutes]." Others, like Jade, lived this race with negative thoughts at the start: "I went there to take the test, but at the same time I said to myself: will I be in my place? So, there was a kind of ambivalence. " Thus, some athlete had no goals as may be reflected in this passage from Marie’s interview: "I knew I was in time, so it was not ... I did not have that performance stress that much, but I wanted to do well."
Athletes’ awareness of the PM: Some athletes described their awareness of positive and negative PM. First, there is awareness of the negative PM. Kim's description would read as follows: "I had a little cramp, but it shifted during the second kilometre [...] I lacked a bit of energy [...] you have the fatigue that sets in, you've have your legs beginning to be heavy". Also, Mark said: "I was impressed to see that the others ahead of me were far away, so I thought I'd have to give myself more and train more if I want to be able to follow them."
Second, awareness of the positive PM was described, like Jade’s responses in her interview: "It's sure that at the end of each of my races, in terms of my sprint, for me it's positive, maybe because I always keep the energy." Another example, Charlie said: "That's what it's motivating to see people giving themselves like that. Even if it's not a competition, we saw that they were still almost 100% there. It's a little motivating, you know so much that I'm going to give myself too." Psychophysiological- and performance-related variables: Participants reported their lived experience during 3000 m time trial and indicated if particular moments were effective (positive; e.g., passing a competitor during an endurance competition) or ineffective (negative; e.g., slowing down during an endurance competition). Consequently, the average PERFI during
periods of positive momentum was 97.03 ± 5.88% and the average for negative momentum was 108.45 ± 7.76% (p < 0.01). Figure 2A and 2B shows the relationships between PERFI scores and
different momentum moments for men (r2 = 0.040) and women (r2 = 0.041). Scores did not differ
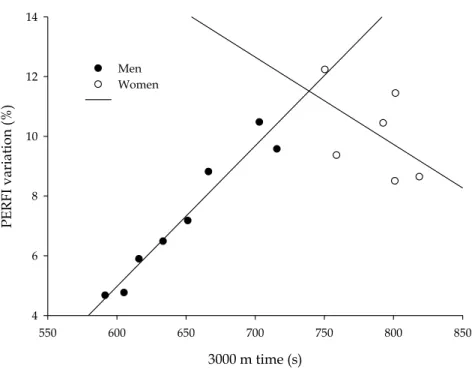
significantly between men and women. Figure 2C shows the standard deviation of the performance index (%) in relationship to the race time performance of each athlete. Women runners obtained a correlation coefficient of -0.51 (p = 0.30). Men runners, in contrast, had a correlation coefficient of 0.97 (p < 0.001), while for the whole group the correlation coefficient was equal to 0.78 (p < 0.001).
A)
B)
Different times of momentum
PM+1 PM+2 PM+3 NM+1 NM+2 NM+3 PERF I (% ) 80 100 120 140 M001 M005 M006 M008 M009
Different times of momentum
PM+1 PM+2 PM+3 NM+1 NM+2 NM+3 PERFI (% ) 60 80 100 120 140 F001 F002 F005 F006 F007
C)
Figure 2. PM-, negative psychological momentum; PM+, positive psychological momentum; Difference between sexes for PERFI and difference between negative momentum and positive momentum. The variation of negative
momentum and positive momentum in the men runners n = 5 (A) and women runners n = 5 (B). The difference between the athletes of the opposite sex is not significant (p = 0.12) (C) The PERFI standard deviation in relation
with the time for the athletes (p < 0.001). The man runners are represented by black circles (r = 0.97 p < 0.001) and the women runners are represented by white circles (r = -0.51 p = 0.30).
DISCUSSION
The present study examined the PM and the physiological links during a competition using a mixed method analysis. It is part of a major research initiative that aims to investigate psychological and physiological aspects related to running and other individual sports (swimming, triathlon and figure skating) with the purpose of developing training interventions tailored to the athletes’ needs. Additionally, there were three unanswered questions: 1) whether psychological and physiological responses are connected during the PM; 2) whether psychological responsiveness to an athlete’s PM; and 3) whether athletes’ own perception of their PM helps to make sense of the overall process and provides clues on how to tailor performance training.
One of the strengths of this study was the use of mixed-methods sequential explanatory design by giving the physiological and runners’ perspective of their recruitment trial race. To our knowledge, this study is the first to use this design to describe runner perceptions of living PM. The experimental approach used here gives more in-depth results by adding the point of view of the runners (e.g., "I had a little cramp, but it shifted during the second kilometre [...] I lacked
3000 m time (s) 550 600 650 700 750 800 850 PERFI v ar ia ti on (% ) 4 6 8 10 12 14 Men Women
a bit of energy") to the interpretation of the physiological results of each described moment (e.g., PERFI=100.5). Results indicated that PERFI linked with the PM were better in the positive
momentum outcome than in the negative momentum outcome, indicating a better performance during periods of positive momentum. Without the use of the individual interview after session 1, it would not have been possible to identify the different moments of PM, as it can be a subjective event for the athlete (e.g., losing motivation during the race because of a physiological sensation or an intrusive thought). Previous findings have shown that moving away or towards a goal will change the direction of PM (8, 29, 37). Thus, the PERFI, as an original new index of
performance, obtained with PM and cardiorespiratory parameters, adds a new objective index of psychophysiological perspective of an athlete’s perception of performance during a 3000 m time trial and potentially for endurance sports. Qualitative data from interviews, that cannot be done using a questionnaire (quantitative data), add concrete elements that only the athlete could have experienced and identified, as the following example illustrates well: "Yes that's motivating, all the girls were there to encourage you and when you passed, you had a boost of energy "(thoughts, feeling, motivation, self-confidence). Thus, our results are in line with other studies examining athletes or coaches (table tennis athletes, swimmers and handball coaches) that used qualitative methods to identify several dimensions (e.g., affect and emotions, cognitions) and themes (e.g., getting self-doubt , anticipation of negative scenario) in connection with the PM (7, 25).
The novel aspect of this study is the use of an actual situation of competition and mixed method with PM. As mentioned by the athletes during the semi-structured interview, they felt the same pressure and stress as in during championship competitions (cross-country or track and field). The perception of living a real competition was described by one of the participants: “I was very nervous [...] it is me; I always start to get stressed during [provincial] competition.” Thus, the annual selection trials established a competitive environment even if the opponents would become future teammates. Some studies have shown that athletes perceive training sessions differently than competition (7, 38), but in the current study, the recruitment trial race day was perceived as a competition.
In the present study, the PERFI of athletes represented the effectiveness of their
cardiorespiratory system in relationship to the speed reached at a specific time during the selection trials (Figures 1 and 2). On average, the runners began with a low PERFI (first 200 m:
83.7 ± 7.7%) that increased throughout the race (1800 m: 104.2 ± 7.7%) to typically finish with a lower index (last 400 m: 98.6 ± 8.6%). Recently, a study with recreational runners demonstrated that early running tactics changed significantly (p < 0.05) depending on whether the runners were in competition (16.8 ± 2.16 km/h) or in an individual (15.3 ± 2.45 km/h) situation (36). In the current study, the same average speed of 16.8 ± 1.85 km/h in the first 200 m was reached, as reported in the previous studies mentioned above (36), and strengthens the notion that we could create similar tactics that were adopted by this study’s participants as those seen during a true competitive event.
The PERFI variation appears to indicate that men runners perform better during a 3000 m time
have a greater variation in PERFI. However, another study reports that the difference depends
on the expertise of the athlete and the ability to perform as the main determinant (23). In the current study, we are the first to report that the important determinant for the choice of pacing strategy is the product of the ratio of competition running speed to MARS, and competition heart rate to maximum heart rate. Perhaps our proposed index of PERFI is a concept similar to
race economy (14, 26). In fact, assuggested by one study, during a 10 km time trial race, the predictors of pacing strategy were the transition behaviour between perception at the start of the muscular and physiological factors during the middle and last stages (2). For example, a runner described this association between perception and physiology: “you have the fatigue that sets in, you've got your legs beginning to be heavy”. Consequently, the PERFI could be a
marker of race tactics of the runners and may predict success outcomes during race days and training days.
Limitations: The limitations to our study could guide more detailed analyses in the future. First, many other factors may influence PM and potentially the race strategy of runners. Second, instead of an individual interview, the focus group could have been used to obtain deeper understanding of the PM and athletes’ performance (5). Nonetheless, the number of recruited participants (n = 15) is within range of other similar studies (7, 25). Future studies might also benefit from addressing psychological and physiological differences among runners based on sex (10, 35) or gender (17, 21).
Practical application: Pooling the physiological parameters of an athlete and putting them in relation to athletes’ perspective of an effort (e.g., during training or competition) is not always realized or easy to do. Nevertheless, the PERFi created in the present study would have the potential to help professionals (e.g., physical trainers, trainers, mental coaches) working with athletes to bring this qualitative perspective (e.g., expressing emotion, physical sensation) on the field of high-performance competitive athletes (national and international level). The PERFi would be a tool that can be used in any context (e.g., training, competition). During a performance or training, athlete monitoring using a heart rate monitor and measurement of different times is already done. Having these values could improve the feedback with the athlete to identify key important positive (e.g., good physical sensation during a competition) and negative (e.g., negative thoughts during training) moments. The addition made by this study is to include the athlete's perspective and make it very useful. Thus, the athlete may be included in his physical and mental preparation (e.g., effort load, fatigue, type of training, competition) and adding them in the decision would potentially help change the athlete's behavior (e.g., transtheoretical model of behavior change) (22, 30). The results of the present study could help developing intervention to focus on specific elements of the momentum such as race management/ strategy, the attentiveness of the runner during the race and other elements of mental and physical preparation of the athletes.
In conclusion, the present study aimed to better understand the PM, by using a sequential explanatory mixed method, in varsity cross-country competitive runners during a 3000 m time trial. The athletes’ perspective of the PM was successfully linked with both physiological response and performance by using the PERFI index. The PERFI index is an objective tool to
observe the evolution of physiological markers during training or a competition. The PERFI
integrates physiological parameters, as well as subjective components expressed by the runners, such as perceived exertion and PM, which could guide the development of tailored psychophysiological training. However, it seems that a significant difference between individual is present in the way of living a competition in elite athletes, suggesting that mental preparation should be athlete specific. Intervention and mental training could be structured around the problematic elements of runners. The techniques could be the progressive relaxation, meditation or biofeedback.
REFERENCES
1. Adler P. Momentum, a theory of social action. Thousand Oaks: Sage; 1981.
2. Bertuzzi R, Lima-Silva AE, Pires FO, Damasceno MV, Bueno S, Pasqua LA, et al. Pacing strategy determinants during a 10-km running time trial: contributions of perceived effort, physiological, and muscular parameters. J Strength Cond Res 28(6): 1688-1696, 2014.
3. Boudet G, Albuisson E, Bedu M, Chamoux A. Heart rate running speed relationships during exhaustive bouts in the laboratory. Can J Appl Physiol 29(6): 731-742, 2004.
4. Braun V, Clarke V. Using thematic analysis in psychology. Qual Res Psychol 3(2): 77-101, 2006. 5. Breen RL. A practical guide to focus-group research. J Geo High Educ 30(3): 463-475, 2006.
6. Briki W. Rethinking the relationship between momentum and sport performance: Toward an integrative perspective. Psychol Sport Exerc 30: 38-44, 2017.
7. Briki W, Den Hartigh RJ, Hauw D, Gernigon C. A qualitative exploration of the psychological contents and dynamics of momentum in sport. Int J Sport Psychol 43(5): 365-384, 2012.
8. Briki W, Den Hartigh RJR, Markman KD, Gernigon C. How do supporters perceive positive and negative psychological momentum changes during a simulated cycling competition? Psychol Sport Exerc 15(2): 216-221, 2014.
9. Briki W, Den Hartigh RJR, Markman KD, Micallef J-P, Gernigon C. How psychological momentum changes in athletes during a sport competition. Psychol Sport Exerc 14(3): 389-396, 2013.
10. Coast JR, Blevins JS, Wilson BA. Do gender differences in running performance disappear with distance? Can J Appl Physiol 29(2): 139-145, 2004.
11. Den Hartigh RJR, Gernigon C, Van Yperen NW, Marin L, Van Geert PLC. How psychological and behavioral team states change during positive and negative momentum. PLoS One 9(5): e97887-e, 2014.
12. Fernandez-Fernandez J, Boullosa DA, Sanz-Rivas D, Abreu L, Filaire E, Mendez-Villanueva A.
Psychophysiological stress responses during training and competition in young female competitive tennis players. Int J Sports Med 36(1): 22-28, 2015.
13. Filaire E, Sagnol M, Ferrand C, Maso F, Lac G. Psychophysiological stress in judo athletes during competitions. J Sport Med Phys Fit 41(2): 263-268, 2001.
14. Fuller JT, Thewlis D, Tsiros MD, Brown NA, Buckley JD. Effects of a minimalist shoe on running economy and 5-km running performance. J Sports Sci 34(18): 1740-1745, 2016.
15. Gill P, Stewart K, Treasure E, Chadwick B. Methods of data collection in qualitative research: interviews and focus groups. Br Dent J 204(6): 291-295, 2008.
16. Halcomb EJ, Davidson PM. Is verbatim transcription of interview data always necessary? Appl Nurs Res 19(1): 38-42, 2006.
17. Heggie V. Science, medicine, and sex tests in sports. Routledge handbook of sport, gender and sexuality. New York: Routledge; 2014.
18. Iso-Ahola SE, Dotson CO. Psychological momentum-A key to continued success. Front Psychol 7: 1328, 2016. 19. Iso-Ahola SE, Dotson CO. Momentum and elite performance. J Nature Sci 3(3): e325, 2017.
20. Ivankova NV, Creswell JW, Stick SL. Using mixed-methods sequential explanatory design: from theory to practice. Field Methods 18(1): 3-20, 2006.
21. Krane V. Gender nonconformity, sex variation, and sport. The psychology of sub-culture in sport and physical activity: a critical perspective. New York: Routledge; 2015.
22. Leffingwell TR, Rider SP, Williams JM. Application of the transtheoretical model to psychological skills training. Sport Psychol 15(2): 168-187, 2001.
23. Lima-Silva AE, Bertuzzi RC, Pires FO, Barros RV, Gagliardi JF, Hammond J, et al. Effect of performance level on pacing strategy during a 10-km running race. Eur J Appl Physiol 108(5): 1045-1053, 2010.
24. Kim J-H, Roberge R, Powell J, Shafer A, Williams WJ. Measurement accuracy of heart rate and respiratory rate during graded exercise and sustained exercise in the heat using the Zephyr BioHarnessTM. Int J Sports Med 34(6): 497-501, 2013.
25. Moesch K, Apitzsch E. How do coaches experience psychological momentum? A qualitative study of female elite handball teams. Sport Psychol 26(3): 435-453, 2012.
26. Morgan DW, Martin PE, Krahenbuhl GS. Factors affecting running economy. Sports Med 7(5): 310-330, 1989. 27. Navalta JW, Stone WJ, Lyons TS. Ethical issues relating to scientific discovery in exercise science. Int J Exerc Sci 12(1): 1-8, 2019.
28. Palazzolo J, Arnaud J. Anxiété et performance : de la théorie à la pratique. Ann Med Psychol 171(6): 382-388, 2013.
29. Perreault S, Vallerand RJ, Montgomery D, Provencher P. Coming from behind: On the effect of psychological momentum on sport performance. J Sport Exerc Psychol 20(4): 421-436, 1998.
30. Prochaska JO, Velicer WF. The Transtheoretical model of health behavior change. Am J Health Educ 12(1): 38-48, 1997.
31. Saldana J. An introduction to codes and coding. The coding manual for qualitative researchers. Thousand Oaks: Sage; 2009.
33. Schwandt TA. Three epistemological stances for qualitative inquiry: Interpretivism, hermeneutics, and social constructionism. The landscape of qualitative research. 2nd ed. Thousand Oaks: Sage; 2003.
34. Smith B, McGannon KR. Developing rigor in qualitative research: Problems and opportunities within sport and exercise psychology. Int Rev Sport Exerc Psychol 11(1): 101-121,2018.
35. Sparling PB, O'Donnell EM, Snow TK. The gender difference in distance running performance has plateaued: an analysis of world rankings from 1980 to 1996. Med Sci Sports Exerc 30(12): 1725-1729, 1998.
36. Tomazini F, Pasqua LA, Damasceno MV, Silva-Cavalcante MD, de Oliveira FR, Lima-Silva AE, et al. Head-to-head running race simulation alters pacing strategy, performance, and mood state. Physiol Behav 149: 39-44, 2015. 37. Vallerand RJ, Colavecchio PG, Pelletier LG. Psychological momentum and performance inferences: A
preliminary test of the antecedents-consequences psychological momentum model. J Sport Exerc Psychol 10(1): 92-108, 1988.
38. van de Pol PKC, Kavussanu M. Achievement motivation across training and competition in individual and team sports. Sport Exerc Perform Psychol 1(2): 91-105, 2012.
39. Vesterinen V, Hokka L, Hynynen E, Mikkola J, Hakkinen K, Nummela A. Heart rate-running speed index may be an efficient method of monitoring endurance training adaptation. J Strength Cond Res 28(4): 902-908, 2014.
40. Venhorst A, Micklewright DP, Noakes TD. The psychophysiological determinants of pacing behaviour and performance during prolonged endurance exercise: A performance level and competition outcome comparison. Sports Med 48(10): 2387-2400, 2018.
41. Wanlin P. L’analyse de contenu comme méthode d’analyse qualitative d’entretiens: une comparaison entre les traitements manuels et l’utilisation de logiciels. Recherches qualitatives 3(3): 243-272, 2007.