HAL Id: hal-00949945
https://hal.archives-ouvertes.fr/hal-00949945
Submitted on 20 Feb 2014
HAL is a multi-disciplinary open access
archive for the deposit and dissemination of
sci-entific research documents, whether they are
pub-lished or not. The documents may come from
teaching and research institutions in France or
abroad, or from public or private research centers.
L’archive ouverte pluridisciplinaire HAL, est
destinée au dépôt et à la diffusion de documents
scientifiques de niveau recherche, publiés ou non,
émanant des établissements d’enseignement et de
recherche français ou étrangers, des laboratoires
publics ou privés.
Measuring perceived depth in natural images and study
of its relation with monocular and binocular depth cues
Pierre Lebreton, Alexander Raake, Marcus Barkowsky, Patrick Le Callet
To cite this version:
Pierre Lebreton, Alexander Raake, Marcus Barkowsky, Patrick Le Callet. Measuring perceived depth
in natural images and study of its relation with monocular and binocular depth cues. SPIE Electronic
Imaging 2014, Feb 2014, san francisco, United States. pp.1-11. �hal-00949945�
Measuring perceived depth in natural images and study of its
relation with monocular and binocular depth cues
Pierre Lebreton
a, Alexander Raake
a, Marcus Barkowsky
band Patrick Le Callet
ba
Assessment of IP-Based Applications, Telekom Innovation Laboratories, TU Berlin
Ernst-Reuter-Platz 7, 10587 Berlin, Germany;
b
LUNAM Universit´
e, Universit´
e de Nantes, IRCCyN UMR CNRS 6597, Polytech Nantes
Rue Christian Pauc BP 50609 44306 Nantes Cedex 3, France
ABSTRACT
The perception of depth in images and video sequences is based on different depth cues. Studies have considered depth perception threshold as a function of viewing distance (Cutting & Vishton,1995), the combination of different monocular depth cues and their quantitative relation with binocular depth cues and their different possible type of interactions (Landy,1995). But these studies only consider artificial stimuli and none of them attempts to provide a quantitative contribution of monocular and binocular depth cues compared to each other in the specific context of natural images. This study targets this particular application case. The evaluation of the strength of different depth cues compared to each other using a carefully designed image database to cover as much as possible different combinations of monocular (linear perspective, texture gradient, relative size and defocus blur) and binocular depth cues. The 200 images were evaluated in two distinct subjective experiments to evaluate separately perceived depth and different monocular depth cues. The methodology and the description of the definition of the different scales will be detailed. The image database is also released for the scientific community.
Keywords: Depth perception, monocular, binocular, depth cues
1. INTRODUCTION
The perception of depth refers on different sources of information: the monocular and binocular depth cues. The evaluation and modeling of perceived depth as a function of these cues have received a lot of attention in the field on psychophysics. Considering the evaluation of depth as a function of depth cues, one can quote the work of B¨ulthoff and Mallot,1 Levell,2 evaluating the relation between binocular disparities and shape from shading, Ernst et al3regarding haptic and binocular disparities, Girshick and Banks,4Johnston et al,5Hillis et al6 regard-ing texture gradient and binocular disparities, Landy et al7regarding texture gradient and kinetic depth, Wang et al.,8 Held et al.9 regarding blur and binocular disparities. These studies focus either on slant perception or more generally on specifically designed signals rendered via computers such as boxes, disks, meshes, cylinders, spheres, etc. This is one of the restriction that this paper attempt to overcome. Coming from a different commu-nity, this paper will address the case of natural images and describe the limits of traditional subjective methods used in psychophysics to this particular study case.
Regarding the modeling, a key reference is the work of Landy et al10 which recall the two main types of models for depth cues fusion into the overall depth perception: the “weak ones” considering the independence of the different depth cues resulting in the linear combination of each individual depth cues and the “strong ones” which allows any types of interaction between depth cues. A new methods was also proposed: the “modified weak fusion” (MWF) which consists of a linear model allowing only one type of interaction: the cue promotion. The cue promotion is a scaling factor applied to one particular depth cue based on parameters determined from the other depth cues.11 Bayesian models are also very famous for the combination of sensory inputs.4 These
Further author information: (Send correspondence to Pierre Lebreton.)
models can be considered either as weak- or strong-fusion approaches depending on the hypothesis made during the definition of the model. In the current paper only linear models will be considered due to their popularity and their good performance in previous studies.
The paper is organized as follow: Section 2 provides information on traditional subjective methods for evaluating depth perception and the contribution of each individual depth cue to the overall depth. It will also provide information on the limits of such methods for the particular study case of natural images. Section 3 describes the different subjective experiments which have been conducted for answering to the proposed research question: evaluating subjectively depth cues and study how to combine them. This section will be divided into three subsections, one will cover the definition of the scales and the two other subsections will provide information on a different experiment to evaluate respectively the overall depth and the monocular depth cues. Section 4 provides information on the result of subjective experiments. Finally, Section 5 will conclude this paper.
2. SUBJECTIVE TEST METHODOLOGIES
2.1 State of the art methodologies
In order to be able to study the combination of different depth cues into the overall depth perception it is needed to have accurate methods for subjective evaluation. This subsection presents different measurement methods reported in the literature. A first method is proposed by Gogel.12 The idea behind the method is to evaluate the perceived position in depth in an indirect manner using parallax issues. Indeed, if the observer changes his position laterally the objects will appears to shift laterally. The shift is proportional to their distance in depth to the screen and direction of the shift will also be dependent of their position relatively to the display: the shift will be in the same direction as the observer if the object pops-out of the display and will be in the opposite direction if the object is in the zone behind the display. By measuring the displacement and considering the viewing distance it is possible to have a measurement of the position in depth of the objects.
An alternative is proposed by B¨ulthoff and Mallot.1 The idea of this methodology is to ask to the test participants to align several dots on the presented 3D image which is the result of the combination of different monocular and binocular depth cues. The test participant can only adapt the binocular disparity of these dots defining then equivalencies between binocular depth cues only from the dots and the combination of different depth cues on the image (binocular disparity and shadings1).
Another type of approach consists in matching the signal under study to another reference signal. This can be done for example by adapting depth position of markers using only the binocular depth cues and make them match to a surface under study depending on both monocular and binocular depth cues. Another alternative is described by Johnston13which is similar to the quality ruler14asking test participants to evaluate the test signal on a well controlled scale of other stimuli. Participant should then select which one of the reference stimulus corresponding best to the stimulus under evaluation. The references stimuli can be as described by Johnston13 different cylinder having continuous curved surface and having different range of depth and the test stimuli are different patterns of randot stereograms.
Other alternatives consist in comparing two different stimuli by a forced choice between different presenta-tions. The different presentation having different properties. These properties can be the larger expansion in depth as in Landy,10 or which is the tallest as in Ernst et al,3 or which has the biggest slope as in Girshick et al.,4 or which is the orientation of the rotation: clockwise or counter clockwise in Braunstein et al.15 In the work of Dosher et al16the task was a forced choice between two different options to explain their understanding of the scene: is the stimulus perceived as a cube or as a truncated pyramid? What is the first direction of the rotation they saw: left or right?
Another approach is to let test participants describe the normal vector to the surfaces as was studied by Stevens and Brook.17 The concept behind this methodology is to ask test participants to define the normal
vectors of the surface under study. Alternatively Van Ee18 let test participant adjust the orientation of lines to describe the slant of the stimulus (a 3D plane).
Another alternative letting more freedom to the test participant is proposed by Tittle and Braunstein19who asked the observers to report the depth-to-height ratio of the stimuli under study.
Rogers and Graham,20chose to increase gradually the amount of binocular disparity and let test participants report from which level of binocular disparity they can perceive depth in the proposed stimulus: randot dots describing an oscillating surface in depth.
Finally, another approach can be found in the litterature as presented by Bruno and Cutting21which consists in asking directly to the test participants to evaluate the perceived depth between objects on the rating scale. In the particular case of the study of Bruno and Cutting21 a scale from 0 to 100 was used, 0 meaning no distance between objects and 100 being the “maximal exocentric separation”.
2.2 Limitations in the context of the proposed study case
This study focuses on the evaluation of depth from monocular and binocular depth cues in natural images. The use of natural images makes the task particularly difficult since it becomes difficult to define the amount of each depth cue as usually done in psychophysics studies. It is then needed to evaluate how strong each considered depth cue are in order to enable the study of how they affect the overall perceived depth. This comes with a second difficulty: the fact that we may omit to evaluate depth cues which are in the pictures and used by the test participants to evaluate the perceived depth. To limit this, all the different depth cues described by Cutting and Vishton22 will be considered.
The evaluation of the monocular depth cues is challenging; most of the previously described methodologies were designed to evaluate the overall depth perception and not the individual depth cues. Indeed, these individual depth cues could be obtained thanks to the design of the experiment, and there was no need to evaluate these depth cues individually. The methodologies presented in the last subsection which enable the evaluation of the monocular depth cues are forced choice between a certain number of options and the evaluation on a numerical scale.
Unfortunately, to enable having a quantitative evaluation of particular scale through a forced choice approach, a large number of comparisons is required. Indeed either the Bradley-Terry model or the Thurstone-Mosteller model23 requires a full pair comparison matrix and then N ×(N −1)2 comparisons per scales with N the number of stimuli. Optimized approaches are possible using the square design approach24 and a well chosen square matrix.25 However, considering that natural images were chosen and then the difficulty to define precisely the quantitative amount of monocular depth cues in the stimuli, a large number of images was selected: 200. Then even using the square design approach, the number of required comparison is still too high to be done in a subjective test.
This paper restrict then the study to the evaluation on a scale using the absolute category rating (ACR26).
3. SUBJECTIVE TESTS
In this study three different subjective experiments have been conducted. One targeting the evaluation of the overall depth in stereoscopic still images, and one targeting the evaluation of monocular depth cues in 2D still images.
3.1 Image database
In order to evaluate the contribution of monocular depth cues to the overall depth perception in natural images it is necessary to select images having different intensity for each monocular depth cues.
3.1.1 Definition of the scales
Seven different depth cues were considered in this study. Each of them were explained to subjects by a written description, a schema, and several examples. Each of the scales will be described in this section.
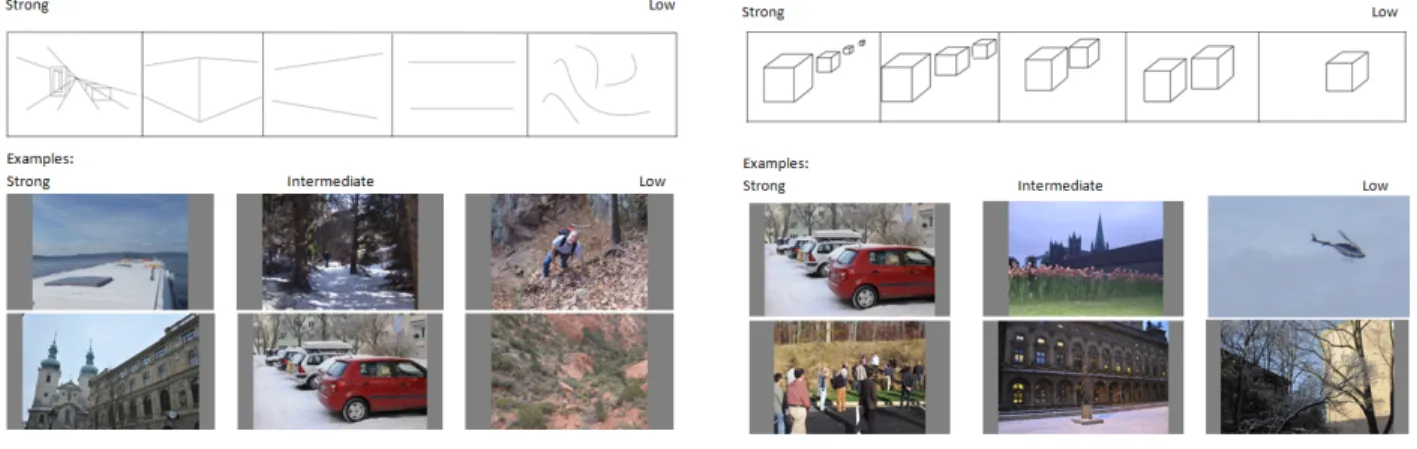
The linear perspective Please evaluate the linear perspective (Figure 1) taking into account if there are clear visible vanishing lines within the image and if these vanishing lines contributes to the perception of the different depth layers in the scenes. This depth cues is stronger as clear linear perspective is visible.
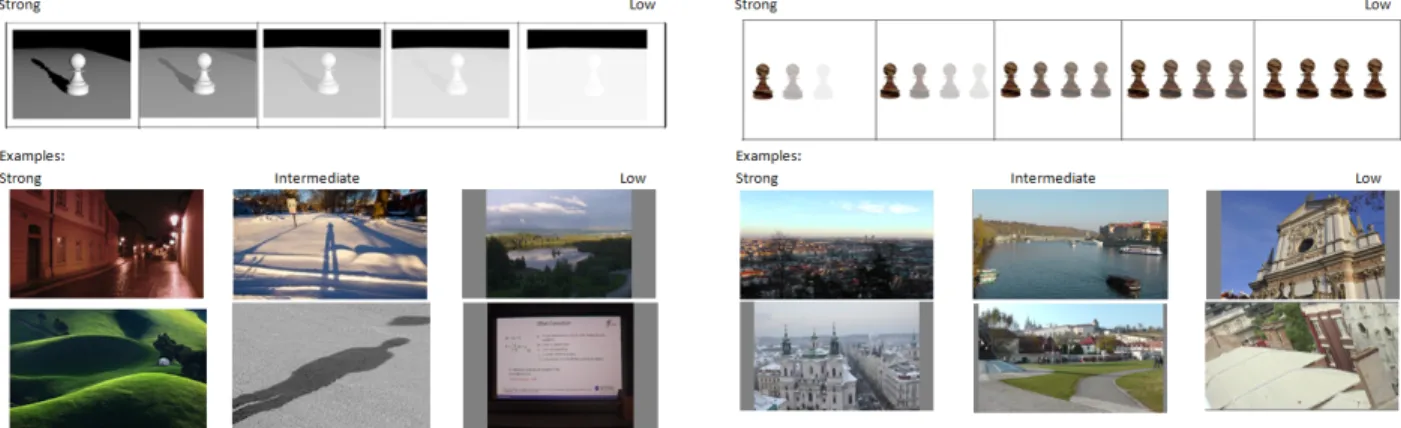
The relative size Please evaluate the relative size (Figure 2) by considering if there are repeating objects in the scene which appears with difference size. You should not use your knowledge about the size of the individual objects for the rating. The rate should depend on the number of occurrence an object appears with different size. This depth cue is stronger when objects are repeated with a lot of time at different size.
Figure 1. Linear perspective Figure 2. Relative size
The texture gradient Please evaluate the texture gradient (Figure 3) based on the fact that there is a texture within the image (more generally you can consider the repetition of patterns) which become finer when the distance to the camera increases. This depth cues is stronger when there is a strong variation of the granularity of the texture or pattern.
The interposition Please evaluate the interposition (Figure 4) based on the number of overlapping objects in the scenes. The overlapping of one object over another provides the ability to order the position in depth of the objects. Please evaluate the interposition considering how the number of overlapping object helps to be aware of the absolute position in depth of the objects using all the interpositions. This depth cues is stronger when there is a lot of objects overlapping at different absolute position in depth.
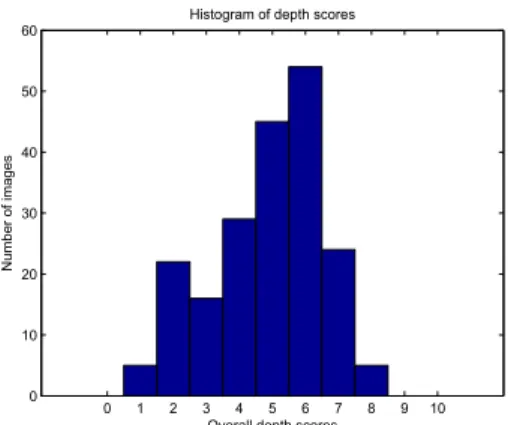
The light and shades Please evaluate the light and shades (Figure 5) based the presence of a light source and the resulting shades which helps to apprehend the shape of the objects. This depth cue is stronger when there is a light source which enables to see the real shape of the object which would have appeared flat otherwise.
The areal perspective Please evaluate the areal perspective (Figure 6) based on the effect of the atmosphere in the image. For example, objects which are far away will have a color close to the color of the sky. This depth cue is as strong as there is a smooth transition of the color of the sky to the elements in the background which usually do not have this particular color of the sky.
Figure 5. Light and shades Figure 6. Areal perspective
The defocus blur Please evaluate the defocus blur (Figure 7) based on the variation of the sharpness at different location of the image explicating variation of the distance of the object to the focal point of the camera. This depth cue is as strong as there are strong variations between the sharp and blurred area in the images.
Figure 7. Defocus blur
Increase of defocus blur
Increase of bin
ocular
depth
Figure 8. Example of matrix defocus blur / binocular depth
3.1.2 Image selection
To perform the image selection process, around 409 images with a large variety of content were evaluated by two expert observers on the 7 different scales as described in the previous subsection on a five grade category scales depicted in the Figures 1-7 and an evaluation of the binocular depth quantity on a five grade scale. The images were taken from different open source image and video database27–34and images extracted from newly shot video sequences using a Panasonic AG-3DA1E twin-lens Camera, and new images shot with a Fujifilm FinePix Real 3D. After being evaluated on the different scales, it was decided to select four depth cues which will be studied as independently as possible: the linear perspective, the relative size, the texture gradient and the defocus blur. For
each of these four depth cues the images were selected such that the score for the six other monocular depth cues was as small as possible and the values of the monocular and binocular depth cues range uniformly distributed from 1 to 5. This results in a matrix of five by five images as shown in Figure 8. Such matrix is then defined for the four previously mentioned depth cues. This results in selecting 100 different images. Considering that the pre-test phase used for the selection of images is only made with two expert observers, it was decided to add a repetition of each combination of monocular and binocular depth cue to increase the robustness of the image selection process and the likelihood to get the expected combination of monocular and binocular depth cues. This finally results in 200 images.
3.2 Evaluation of binocular depth
The evaluation of the binocular depth quantity was performed in a first subjective experiment. The 200 still images were used at the highest quality available and did not have any visible coding artefact. Multiple open image and video database, or new recorded content with a video camera or camera the images were used and have many different image formats; The images coming from the camera having an aspect ratio of 4:3 were downscaled from the resolution 3648x2736 to 1440x1080 and were inserted in a uniform gray frame of 1920x1080. The images coming from the database 3DIQA27, 28where slightly smaller than 1920x1080 and were then centered in a uniform gray frame of 1920x1080. The other images having natively the resolution of 1920x1080 were kept in their original format. The images were presented on a 3D stereoscopic display: Samsung UE46F6500, 46” smart TV with active glasses and a native resolution of 1920x1080. The viewing distance was set to 3H, and the test lab environment was according to the ITU-R BT.500-12 recommendation.35 Twenty observers attended the experiment; their vision was checked, and it was assured that they passed the color blindness test (Ishihara test) and the depth perception test (Randot stereo test). The observers were trained using five different images with different values of depth quantity. During the training phase the observers had the opportunity to ask questions. After the training had finished, the observers were asked to rate the 200 images on the amount of perceived depth. The methodology used was Absolute Category Rating (ACR). Perceived depth was rated on a discrete eleven grade scale from 0 to 10 with the labels “very high”, “high”, “medium”, “low” or “very low” - perceived depth respectively at the position 9, 7, 5, 3, 1 on the scale.
3.3 Evaluation of monocular depth
Following the discussion provided in Subsection 2.2 the evaluation of the monocular depth cues was performed using the Absolute Category Rating method on a five grade scales to evaluate the seven scales corresponding to each individual depth cue. The test participant were given the instructions described in Subsection 3.1.1, this includes the text describing the depth cues, the pictograms showing the different amount of depth cues and the examples images. The 200 images had the same HD resolution, as described in subsection 3.2 and were displayed on an 9.6 inches iPad 4 with a native resolution of 2048x1536. The images were presented on the top of the interface and were as large as possible and the different scales were represented as pictograms below the image under evaluation. Figure 9 shows the test interface of the application. Test participants evaluated each individual depth cue by selecting the pictograms. The application switched then automatically to the next scale. Test participants were able to edit a previous rating. Once all the seven scales were evaluated, a button appeared allowing the test participant to switch to the next image. For this test, no time constraint was given. The instructions were printed allowing the test participant to refer to them anytime they wanted. For this test, 8 experts in video or audio quality assessment participated to the test. The devices were given to the test participant and the test was performed in a non controlled environment. On average, the test requires 3 to 4 hours and was completed in several sessions within a week at the convenience of the test participants.
4. RESULTS
4.1 Analysis of vote distribution
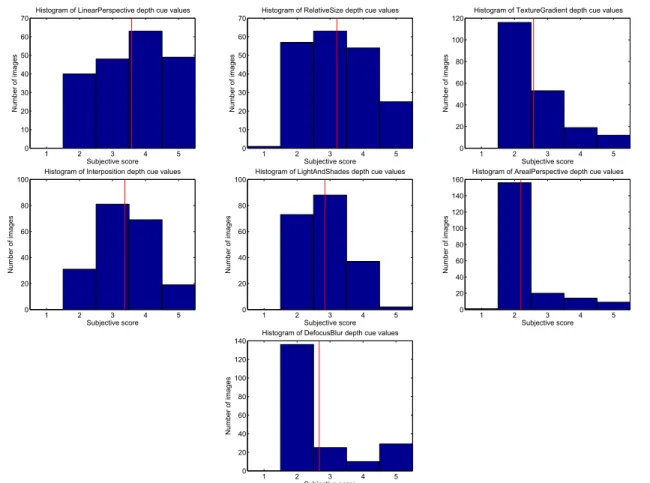
First, regarding the scores from the 3D viewing session for the 200 images, a histogram built by rounding the mean score over the observer per images to the closest integer value can be found in Figure 10. The purpose of this histogram was to have a view on the distribution of the scores. 50% of the images were rated with a score higher or equal than 5. A Jarque-Bera test shows that the distribution of the subjective scores is not normal at a
Figure 9. Subjective test interface 0 1 2 3 4 5 6 7 8 9 10 0 10 20 30 40 50 60 OverallHdepthHscores NumberHofHimages HistogramHofHdepthHscores
Figure 10. Histogram of depth scores from the 3D viewing session
95% confidence. Similarly, the histogram of the monocular depth cues scores is depict in Figure 11. The selection of the images was done such that the distribution of the monocular depth cues linear perspective, relative size, texture gradient and defocus blur were meant to cover the entire range. The minimum score for each depth was not frequently used, and the average scores for each depth cue span from 1.5 to 5. For a particular depth cue, it was expected by design that 160 images would have only small amount of this particular depth cues corresponding to the first bin, 10 images would be voted with slight, medium, advanced and strong depth cue respectively, filling the bins 2,3,4 and 5 with 10 samples each. This would have been one of the conditions of a good separation between the depth cues: one depth cue which change of value in a controlled manner from 1 to 5 while all the other depth cues are kept to a minimum value. This kind of result has been achieved for the defocus blur. The areal perspective depth cue shows also a similar pattern. The texture gradient follows this rule to a lower extent. Regarding the linear perspective and the relative size, the distribution is more uniform, this shows that the image selection did not succeed to decorrelate the increase of other depth cues and the increase of relative size or linear perspective. For example the selection of images increasing the amount of texture gradient may have resulted in images having higher amount of relative size. Figure 4.1 depicts the Spearman correlation between the monocular depth cue scores. The correlation values are low, and indicate that the depth cues scores have only little relation between each others. The correlation values however support the discussion about the unexpected distribution of the linear perspective and relative size scores which have a higher correlation between each other showing that these two and the texture gradient and interposition may have shared some images even though the correlation values are too low to be conclusive.
4.2 Relation between monocular depth cues and overall depth scores
One of the objectives of the study is to evaluate if in the context of the use of natural images it is possible to show the effect of monocular depth cues on the overall depth score values. One strong limitation of the study is due to the use of natural images which results in the absence of ground truth for the binocular depth cue. Indeed, the subjective data coming from the test in stereo mode described in Subsection 3.2 provides the results of the depth score rating resulting from the combination of monocular depth cues and binocular depth cues. And the test from the subjective test described in Subsection 3.3 only provides monocular depth cue scores. The binocular depth cues themselves could not be controlled as usually done in psychophysics studies since natural image content was used. It is then only possible to use statistics about depth maps and content characteristics as described in previous studies36 to retrieve information about the binocular depth cues.
To analyse the contribution of the monocular depth cue, for each depth cue, two categories are created: one with a low value of the particular depth cue and one with a high value of a depth cue. Let Ω be the set of all images. DCc,high is the set of images such that the depth cue c is high. And ∀I ∈ Ω, DCc(I) is the value of the depth cue c for the image I.
DCc,high= {I ∈ Ω|DCc(I) > 3} (1) DCc,low= {I ∈ Ω|DCc(I) ≤ 3} (2)
1 2 3 4 5 0 10 20 30 40 50 60 70 Subjectivedscore Numberdofdimages HistogramdofdLinearPerspectiveddepthdcuedvalues 1 2 3 4 5 0 10 20 30 40 50 60 70 Subjectivepscore Numberpofpimages HistogrampofpRelativeSizepdepthpcuepvalues 1 2 3 4 5 0 20 40 60 80 100 120 Subjectivenscore Numbernofnimages HistogramnofnTextureGradientndepthncuenvalues 1 2 3 4 5 0 20 40 60 80 100 Subjectivehscore Numberhofhimages HistogramhofhInterpositionhdepthhcuehvalues 1 2 3 4 5 0 20 40 60 80 100 Subjectivedscore Numberdofdimages HistogramdofdLightAndShadesddepthdcuedvalues 1 2 3 4 5 0 20 40 60 80 100 120 140 160 Subjectivedscore Numberdofdimages HistogramdofdArealPerspectiveddepthdcuedvalues 1 2 3 4 5 0 20 40 60 80 100 120 140 Subjectivepscore Numberpofpimages HistogrampofpDefocusBlurpdepthpcuepvalues
Figure 11. Histogram of monocular depth cues scores. The vertical line provides the average value of the depth cue.
LP RS TG I LS AP DB LP 1.00 0.42 0.26 0.054 0.074 -0.13 -0.17 RS 0.42 1.00 0.434 0.54 0.0081 0.27 -0.18 TG 0.26 0.48 1.00 0.22 0.024 0.24 -0.12 I 0.054 0.54 0.22 1.00 0.0016 0.24 -.010 LS 0.074 0.0081 0.024 0.0016 1.00 -.078 0.11 AP -0.13 0.27 0.24 0.24 -.078 1.00 0.10 DB -0.17 -0.18 -0.12 -.010 0.11 0.10 1.00
Figure 12. Spearman correlation between monocular depth cues; LP: Linear perspective, RS: relative size, TG: texture gradient, I: Interposition, LS: light and shade, AP: areal perspective, DB: defocus blur
To study the effect of a depth cue c on the overall depth, the differences between the overall depth score of the sets of images IS1(c) and IS2(c) are studied. IS1(c) is the set of images where the depth cue c is high and all the other depth cues are low. IS2(c) is the set of images where the depth cue c is low and all the other depth cues are low.
IS1(c) = DCc,high
\
i∈{0LP0,0RS0,0T G0,0I0,0LS0,0AP0,0DB0}\c
IS1(c) = DCc,low
\
i∈{0LP0,0RS0,0T G0,0I0,0LS0,0AP0,0DB0}\c
DCi,low (4)
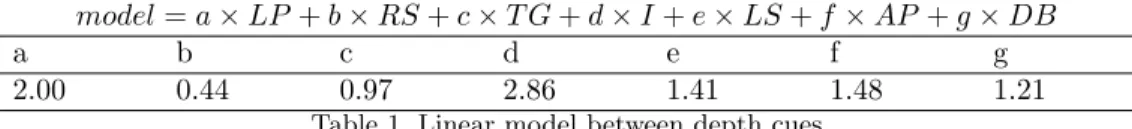
Unfortunatly, an ANOVA cannot be performed for each depth cue c in order to compare the depth scores be-tween the two set of images IS1(c) and IS2(c) because the residual of the linear model using only one factor does not fulfill the normality requirements. As shown in Figure 4.1 the correlation between the scales is low, a PCA applied to the data confirms this result and shows that the explained variance increases linearly with the number of support vectors. It is then difficult to decrease the dimensionality. A linear model using all the different variable with no interaction term is then suggested. Using a Jarque-Bera test, it is possible to confirm that the residual error of such model is normal. Table 1 lists the coefficient of the model. It is then possible to apply an N-Way ANOVA to explain the overall depth scores as a function of the monocular depth cue scores. Only the interposition (F=20.75,p < 0.01) and the defocus blur which is on the borderline was found to have a significant effect (F=3.92,p=0.049). Followed by the texture gradient (F=2.24,p=0.13) and “light and shade” (F=1.6,p = 0.20) which were not significant on a 95% confidence.
model = a × LP + b × RS + c × T G + d × I + e × LS + f × AP + g × DB
a b c d e f g
2.00 0.44 0.97 2.86 1.41 1.48 1.21 Table 1. Linear model between depth cues
4.3 Limitations
As mentioned previously, one limitation of the study is dependency to the binocular depth cues which can be hardly evaluated individually in natural images. During the design of the experiments, statistical analysis of the depth map characteristics were done36to have a high variety of content’s stereoscopic properties, but it remains a factor which needed to be mentioned. An extension of this issue is also the limitation of the study to the particular instantiation of the problem, even though it was targeted by design to cover as much as possible the different monocular depth cue scales. These are limitations that the authors are aware of but which could not be avoided in the targeted challenge.
5. CONCLUSION
The objective of this paper was to reproduce studies done in the field of psychophysics but in the particular case of the evaluation of monocular and binocular depth cues in natural images. These are preliminary results and details the methodology and questions which have been addressed to tackle this challenge. The different methodologies for the evaluation of depth were explained, but considering the type of stimuli used in psychophysics studies they were not adapted in the particular context of this paper. An alternative methodology was then used and a definition of different scales for the evaluation of monocular depth cues in images was proposed. Various analysis were performed to check the influence of monocular depth cues on the overall depth scores and to see if the methodology used could perform such task. Statistical differences could be seen for the particular case of the interposition and defocus blur depth cues, but not for the other depth cues. The image database including subjective scores will be made available on request to the first author, these can be used for example to study depth in 3D images, but can also be used for the investigation of other aspects such as the effect of coding on depth perception, the acceptance of 3D, the relation between monocular and binocular depth cues and depth quality issues, visual comfort and any other topics related to 3D quality of experience.
REFERENCES
[1] B¨ulthoff, H. H. and Mallot, H. A., “Integration of depth modules: stereo and shading,” Journal of the Optical Society of America 5, 1749–1758 (October 1988).
[2] Lovell, P. G., Bloj, M., and Harris, J. M., “Optimal integration of shading and binocular disparity for depth perception,” Journal of Vision 12, 1–18 (2012).
[3] Ernst, M. O. and Banks, M. S., “Humans integrate visual and haptic information in a statistically optimal fashion,” Nature 415, 429–433 (2002).
[4] Girshick, A. R. and Banks, M. S., “Probabilistic combination of slant information: weighted averaging and robustness as optimal percepts,” Journal of Vision 9, 1–20 (2009).
[5] Johnston, E. B., Cumming, B. G., and Parker, A. J., “Integration of depth modules: Stereopsis and texture,” Vision Research 33(5/6), 813–826 (1993).
[6] Hillis, J. M., Watt, S. J., Landy, M. S., and Banks, M. S., “Slant from texture and disparity cues: Optimal cue combination,” Journal of Vision 4, 967–992 (2004).
[7] Landy, M. S., Maloney, L. T., and Young, M. J., “Psychophysical estimation of the human depth combination rule,” Sensor fusion III: 3-D Perception and recognition, SPIE Proceedings 1383, 247–254 (1991).
[8] Wang, J., Barkowsky, M., Ricordel, V., and Callet, P. L., “Quantifying how the combination of blur and disparity affects the perceived depth,” in [Proceedings of the SPIE. Human Vision and Electronic Imaging XVI ], 7865, 78650K–78650K–10, Proceedings of the SPIE (2011).
[9] Held, R. T., Cooper, E. A., and Banks, M. S., “Blur and disparity are complementary cues to depth,” Current Biology 22, 426–431 (2012).
[10] Landy, M. S., Maloney, L. T., Johnston, E. B., and Young, M., “Measurement and modeling of depth cue combination: in defense of weak fusion,” Vision Research 35(3), 389–412 (1995).
[11] Young, M. J., Landy, M. S., and Maloney, L. T., “A perturbation analysis of depth perception from combinations of texture and motion cues,” Vision Research 33(18), 26852696 (1993).
[12] Gogel, W. C., “An indirect method of measuring perceived distance from familiar size,” Perception & Psychophysics 20(6), 419–429 (1976).
[13] Johnston, E. B., “Systematic distortion of shape from stereopsis,” Vision Research 31(7/8), 1351–1360 (1991).
[14] Jin, E. W., Keelana, B. W., Chen, J., Phillips, J. B., and Chen, Y., “Softcopy quality ruler method: Implementation and validation,” in [Proceeding of SPIE-IS&T Electronic Imaging ], 7242 (2009).
[15] Braunstein, M. L., Andersen, G. J., and Riefer, D. M., “The use of occlusion to resolve ambiguity in parallel projections,” Perception & Psychophysics 31(3), 261–267 (1982).
[16] Dosher, B. A., Sperling, G., and Wurst, S. A., “Tradeoffs between stereopsis and proximity luminance covariance as determinants of perceived 3D structure,” Vision Research 26(6), 973–990 (1986).
[17] Stevens, K. A. and Brook, A., “Integrating stereopsis with monocular interpretations of planar surfaces,” Vision Research 28(3), 371–386 (1988).
[18] van Ee, R., Adams, W. J., and Mamassian, P., “Bayesian modeling of cue interaction: bistability in stereo-scopic slant perception,” Journal of the Optical Society of America A 20(7), 1398–1406 (2003).
[19] Tittle, J. S. and Braunstein, M. L., “Recovery of 3-D shape from binocular disparity and structure from motion,” Perception & Psychophysics 54(2), 157–169 (1993).
[20] Rogers, B. J. and Graham, M., “Similarities between motion parallax and stereopsis in human depth perception,” Vision Research 22, 261–270 (1981).
[21] Bruno, N. and Cutting, J. E., “Minimodularity and the perception of layout,” Journal of Experimental Psychology: General 17(2), 161–170 (1988).
[22] Cutting, J. E. and Vishton, P. M., [Perceiving layout and knowing distance: The integration, relative potency and contextual use of different information about depth ], New York: Academic Press (1995).
[23] Handley, J. C., “Comparative analysis of Bradley-Terry and Thurstone-Mosteller model of paired com-parisons for image quality assessment,” in [Proc. IS&Ts Image Processing, Image Quality, Image Capture, Systems Conference ], (April 2001).
[24] Otto Dykstra, J., “Rank analysis of incomplete block designs: A method of paired comparisons employing unequal repetitions on pairs,” Biometrics 16, 176–188 (June 1960).
[25] Li, J., Barkowsky, M., and Callet, P. L., “Analysis and improvement of a paired comparison method in the application of 3DTV subjective experiment,” in [ICIP ], (October 2012).
[26] ITU-T Recommendation P.910, “Subjective video quality assessment methods for multimedia applications,” (2008).
[27] Goldmann, L., Simone, F. D., and Ebrahimi, T., “Impact of acquisition distortions on the quality of stereoscopic images,” in [5th International Workshop on Video Processing and Quality Metrics for Consumer Electronics (VPQM) ], (2010).
[28] homepage of, “http://mmspg.epfl.ch/3diqa,” (last access in Januray 2014).
[29] Fliegel, K., V´ıtek, S., Kl´ıma, M., and P´ata, P., “Open source database of images DEIMOS: high dynamic range and stereoscopic content,” in [Proc. SPIE 8135, Applications of Digital Image Processing XXXIV, 81351T ], (September 2011).
[30] homepage of, “http://www.deimos-project.cz/tag/stereo,” (last access in Januray 2014).
[31] Cheng, E., Burton, P., Burton, J., Joseski, A., and Burnett, I., “RMIT3DV: Pre-announcement of a cre-ative commons uncompressed hd 3D video database,” in [Proc. 4th International Workshop on Quality of Multimedia Experience (QoMEX 2012) ], (2012).
[32] homepage of, “http://www.rmit3dv.com/download.php,” (last access in Januray 2014).
[33] Urvoy, M., Barkowsky, M., Cousseau, R., Koudota, Y., Ricordel, V., Callet, P. L., Guti´errez, J., and Garc´ıa, N., “Characterization of NAMA3DS1: a freely available dataset of 3D stereoscopic video sequences,” (2011). [34] homepage of, “http://www.elephantsdream.org/,” (last access in Januray 2014).
[35] ITU-R Recommendation BT.500-13, “Methodology for the subjective assessment of the quality of television pictures,” (2012).
[36] Lebreton, P., Raake, A., Barkowsky, M., and Callet, P. L., “Evaluating depth perception of 3D stereoscopic videos,” IEEE Journal of Selected Topics in Signal Processing 6, 710–720 (October 2012).