HAL Id: hal-00955276
https://hal.archives-ouvertes.fr/hal-00955276
Preprint submitted on 19 Mar 2014
HAL is a multi-disciplinary open access archive for the deposit and dissemination of sci-entific research documents, whether they are pub-lished or not. The documents may come from
L’archive ouverte pluridisciplinaire HAL, est destinée au dépôt et à la diffusion de documents scientifiques de niveau recherche, publiés ou non, émanant des établissements d’enseignement et de
Mixing text mining analysis and agent based modelling
methodologies.
Alexandre Delanoë, Serge Galam
To cite this version:
Alexandre Delanoë, Serge Galam. Mixing text mining analysis and agent based modelling method-ologies.: A case study to analyze a controversy. 2014. �hal-00955276�
Mixing text mining analysis and agent based modelling
methodologies. A case study to analyze a controversy
Alexandre Delano¨e
CNRS1 / EHESS 2 / CAMS 3 et Mines ParisTech / CSI 4 , France5
Serge Galam
Mixing text mining analysis and agent based modelling
methodologies. A case study to analyze a controversy
Alexandre Delano¨e
CNRS1 / EHESS 2 / CAMS 3 et Mines ParisTech / CSI 4 , France5
Serge Galam
CNRS / Sciences Po / CEVIPOF 6, France7
Abstract
This paper starts from methodological issues dealing with sociological and quantitative interpretation of qualitative and discontinued data when analyzing controversies from a large press corpus. Then authors offer a new approach mixing text mining analysis and agent based modeling. The study case dealing with the controversy of abnormal disappearance of honey bees (apis mellifera) among French speaking journalistic during 13 years is mobi-lized to describe the different steps of this heuristic framework. First articles are tagged with three stances to report the problematic phenomenon, a uni-factor cause, i.e. the use of pesticides, a multi-uni-factor cause, i.e. including one other factor different than pesticides at least, or the absence of understand-ing. Second, variations of the proportions of agents explaining the issue either with unifactor or multifactor causes are obtained with modeling. Assuming agents follow dispositional or positional social influence in their interactions to report the facts, their associated networks are extracted from the data ap-plying a network randomized model of opinion dynamics. Third, from those distributions the possible topology of actor networks can be questioned back with others qualitative methods, either ethnographic or interviews.
Keywords:
Mixed methodology, interdisciplinary, text-mining, sociophysics, agents based simulation, opinion dynamics, daily press, precautionary principle, bees colony collapse disorder
1. Introduction
Analyzing data produced by the actors in an open (and textual) space without any introductory questions or actions from sociologists poses a com-plex methodological issue. Starting from text-mining and sociological prac-tices 2 main problems arise. The first one is a discursive paradox, as a denotation issue dealing with the non transitivity of the addition as math-ematical operation on qualitative textual data. As a corollary, the second problem is a continuum issue on time and space scale of the social field an-alyzed. The two issues are linked but we separate them to understand why actor networks matter and cannot be supposed a priori but only at the end of an inquiry process. Besides, a controversy is a complex phenomena in which the meaning of data is part of the process. Hence such methodology becomes questionable.
1.1. The discursive paradox
Let be more explicit on the first issue which is not only a linguistic issue but also a discursive and logical paradox. If we consider the text addition 1 + 1 or 1 and 1 (Frege, 1884) which enables occurrences (or cooccurrences) calculations (1 being the same word) how can we infer that 1 and 1 denote the same meaning in the same context ?
The practical consequences of such issue are very problematic for soci-ological interpretation of text-mining analysis. To understand the previous issue we focus on one example. We first assume that complexity of the con-troversies implies an epistemic dependence (Hardwig, 1985). The experts (and journalists) are specialized but they have to understand (or report) a complex phenomena: the death’s bees in our specific case. In such case, we do not infer the power of one domain, one speciality such as epidemiolo-gists(Suryanarayanan et Kleinman, 2013) 8.
Let consider an expert committee that has to prepare a report on the honey bees’ health consequences of insecticides used in agriculture, especially pollution by particles at the level of 3 PPM (Parts Per Million) for example. The experts have to decide the validity of the following propositions:
• Premiss 1 (p): the average insecticides pollution level exceeds 3 PPM ;
8
Such analysis should lead to an exhaustive analysis of scientific publications which will published in another paper
• Premiss 2 (p → q): if the average particle pollution level exceeds 3 PPM, then honey bees have a significantly increased risk of death; • Conclusion (q): honey bees have a significantly risk of death.
Since, these propositions may lead to a disagreement among scientists (Doucet-Personeni et al., 2003) we select a configuration to illustrate the fact. Let’s imagine a formal vote among experts to exhibit the discursive paradox which happens in the controversy. The tabular shows the decision of each expert on each part of the reasoning, the premisses and the conclusions. First expert agrees with the two first premisses and then agrees with the conclusion (True). Second expert disagrees only with the second premiss and therefore disagrees with the conclusion (False). The third expert disagrees with the first premiss only and therefore disagrees with the conclusion (False).
Premisses Issue
p p→ q q
Expert 1 True True True
Expert 2 True False False
Expert 3 False True False
Majority Vote True True False
The key point is the following: the sum of individual judgments is not transitive, i.e. majority agrees with the premisses whereas it disagrees with the conclusion. The majority vote, as a result of sum of individual votes, unveils the paradox : the result of the sum is not transitive or no-logic. In sum, epistemic dependence has to take into account this discursive dilemma (List et Pettit, 2005) which can be a good reason enough for the actors implied in the controversy to gather external stakeholders to make public (or not) some interpretations and then to redefine the public problem(Gilbert et Henry, 2012).
In fact, this formal example shows the two main trends happening during the public debate: problem focused on the issue or problem focused on the premisses which can be considered each as a public problem (Gusfield, 1981) according to each public motives (Burke, 1969) that can be described with text mining methods . Indeed, working with the data, we will show in next section that during the first phase, between 1998 and 2004 years, the debate is mainly centered on the issue whereas between 2005 and 2010 years the debate is mainly centered on the premisses. Each phase will be studied in more details before the modelling.
The methodological consequence of the previous result is that one can do textual analysis on the discontinued phases of the controversy. Because addition does not apply on the reasoning but on the subject of the debate (conclusion or premisses) in each phase. But another (big) issue appears immediately.
1.2. The problem of discontinuity
Between two points of data represented in a bi-dimensional frame (in time and space), how can we infer the continuity ? That is the main issue we are confronted with: the issue of the completeness of the dataset which is different than representativity as statistics issue. With text-mining (Callon et al., 1991; Lebart et Salem, 1994) analysis sociologists can describe evolutions of data, even big data, but between two points in time axis many curves can join them depending on the dynamics of the social process. Then the question arises: where to stop the exploration ? The risk of regression ad infinitum such as the Zenon Paradox (Carroll, 1895) is one logical issue that can not only be smoothed with statistics method.
The Gutman Effect used in textual statistics to analyze text evolution in time (Salem, 1988, 1994) infer a continuum in the evolution of words in time, years after years, especially from 1998 to 2004 in our case (Delano¨e, 2010), because of a quadratic correlation between words and time. As a con-sequence, if “series” can be supposed (and noticed) it can also be interpreted in a sociological framework (Chateauraynaud et Torny, 1999; Bertrand et al., 2007). But the point is data are structurally discontinuous. Then sociological interpretation needs to infer a kind of memory or sociological influence (like the strength of arguments or of the proof) to conceptualize emergence from events and actions. The term “percolation” is sometimes used to describe a process with the support of a physicist comparison. But from the data how to rebuild the actor networks in a second step ?
Controversies deal with spokesmen : if bees are silently dying, one’s has to translate their burden and translations happen in the flow of media com-munications. Then the sociological issue arises : who, when, where are the whistle-blowers and their spokesmen ? Which networks are involved ? The relation between variables and sociological explanation has already been stud-ied in order to show the weight of simulation (Edling, 1998; Manzo, 2005) but here we face the issue of large qualitative datasets. Questioning the simulations is also asking the topology of the network itself and its inherent mechanisms.
Social influence modeling has a long history but here are some key point we need to highlight. Katz and Lazarsfeld (Katz et Lazarsfeld, 1955) framed the bottom-up communication process which needed to be conceptualized in a two step communication process. Later Katz’ works lead to a model which suppose actors identities a priori as if identity would infer a dynamics of the process (they are leaders or followers). From another perspective, the threshold model would be an efficient way to model collective phenomena but Granovetter recognized that he has been confronted with some mathematical issue: “Modeling the effects of spatial and temporal dispersion on equilibrium outcomes presents greater mathematical difficulties than those described in the previous sections, and progress has been slower. A few simple results will suggest, however, that interesting possibilities arise.(Granovetter et Soong, 1983, p. 1431)”. This mathematical issue prevents an analytic solution which in turn would allow to question back the data as it is done in this paper. Granovetters model would rather be a formal approach of collective phenomena. More recently importance of networks topology has been shown for social influence processes : “changing the connectivity and topology of the influence network can have important implications both for the scale of cascades that may propagate throughout a population and also the manner in which those cascades may be seed ed” (Watts et Dodds, 2009, p. 492). But the key point is not to show implications of networks only but also to find back topology of networks as scenario hypothesis for sociological inquiry from aggregated data.
Here is a heuristic framework which does not suppose actor networks a priori. With a randomized model of networks topology simulation confronted to the empirical data, this framework enable to extract scenarii of actor networks. The point addressed in this paper is the following: if statistics approximation can produce error estimation with tendencies, how modeling of dynamics opinion can produce networks estimations from the data ? This heuristics also test our interpretation of the controversy with neworks sce-narii. Indeed, the trick is in defining series of continuity in the discontinuity of the controversy.
2. From empirical data dealing with the Precautionary Principle application
A good deal of works has already been devoted to the theoretical study of threshold collective phenomena (Watts et Dodds, 2009) and also within
the frame of sociophysics (Castellano et al., 2009; Galam, 2008, 2012). But not many real cases have been investigated using real empirical data. Yet stands the challenge to compare descriptive text-mining analysis with the-oretical modeling. On this basis, this paper presents a case study with a subject dealing with controversial environmental risks. In this case, public problems treatment in media makes the understanding of the public opin-ion mechanisms a great challenge. In our peculiar context, applicatopin-ion of the precautionary principle 9 is a sensitive issue which can mobilize public
opinion and let us gather data enough to be modeled (Delano¨e et Galam, 2014).
Empirical data used for this paper deals with the abnormal bees’ death, also called colony collapse disorder (CCD) in some countries including the US. This controversy is emblematic of the question of risks connected to the burden of making eventual mandatory arbitrage to ban the use of some specific chemical products. Moreover real implementing of innovation leads to public debates which are inevitably driven by incomplete scientific data. The question arises on how possible risks are translated (Callon, 1986) into solid T¨onnies (1922) facts during the ongoing associated public debate (Dewey, 1927) in France during the period 1998 - 2010. Then, the social fact of the the bees disappearing is studied among French speaking journalists using a corpus of 1467 articles published in newspapers.
From a systematic textual analysis, each article is tagged to either one of three stances to explain the phenomenon, a uni-factor cause, namely the use of pesticides, a multi-factor cause, or the absence of clear understanding. On this basis, the evolution of the respective proportions of each category is obtained over the 13 consecutive years. Then, data are confronted to a model(Galam et Jacobs, 2007; Galam, 2005) to question back the social meaning of the dynamics. Our hypothesis asserts the evolution over the years of reports among journalists for each view results from social interactions we have to find out.
Assuming journalists may change their way to report the facts according to their dispositional or positional (Bourdieu, 1973) influence, their associ-ated proportions are extracted from the data applying an agent based model
9
The precautionary principle states that if a given policy is suspected of a possible harm to either the public or the environment, in the absence of a scientific consensus about its risk status, implementing that policy is questionable and should be held on.
of opinion dynamic. The variations exhibited by the data suggest that the number of dispositional agents (who hardly change their mind) vary from year to year. Those varying numbers of agents are inferred applying the model. From these distributions the possible social interactions among jour-nalists and other externalities can be questioned. Applying the model to the empirical data built from a corpus of published articles in newspapers provides a frame to go back to the data (with interview or ethnography) and question their social meaning with the eventual social mechanisms behind them.
The rest of the paper is structured as follows. The problem is set in the second Section where the dynamics opinion is quantitatively evaluated from empirical data. Third Section highlights the newspaper level to show the dispositional or the positional agents profile. The model is adapted to the problem in Section four to extract dispositional agents proportions as a func-tion of time in Secfunc-tion five. The social meaning behind the data is addressed in Section six enlightening the determinant role of social interactions and other externalities. The results are discussed in the last Section.
2.1. Behind the dynamics many hypothesis
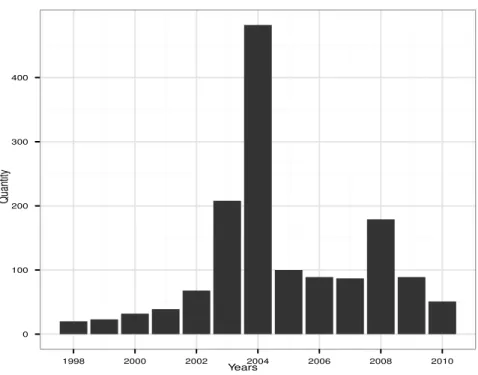
A boolean equation dealing with the abnormal death of bees in France during the period 1998-2010 has lead to extract a corpus of almost 1500 French articles from Lexis-Nexis and Factiva complementary databases. The collection of papers is taken from daily, weekly and monthly French speaking press. The annual distribution of the number of articles is shown in (Fig. 1). A systematic textual analysis of all the collected papers, shows that within the articles dealing with the question of the abnormal bee deaths some pointed towards peculiar scientific results suggesting a single cause identi-fied as the use of pesticides (Chateauraynaud, 2004) (Delano¨e, 2004) , while others were emphasizing other peculiar results suggesting the combination of several different causes (Chiron et Hattenberger, 2008) Maxim et van der Sluijs (2010). Accordingly, a combination of words has been established to categorize each view in order to assign respectively the articles.
1. Articles containing words as “pesticides” or “insecticides” or “chemi-cals” and without referencing others factors are categorized in the uni-factor class;
2. Articles containing at least one word as below are put in the class of the multi-factors cause:
Years Quantity 0 100 200 300 400 1998 2000 2002 2004 2006 2008 2010
Figure 1: Number of articles published each year by French daily, weekly and monthly press dealing with the bee deaths from 1998 till 2010. Over the thirteen years the total amounts to 1467.
• “Foulbrood” (it is a bacteria);
• “Nosema” or “Nosemose” (it is a mushroom); • “Varroa” (it is a parasite);
• “Virus” (it represents mainly the Israel acute paralysis virus); • “Predators” or “galleria mellonella” or “aethina tumida” or “Asian
predatory wasp”;
• “Monoculture” or “natural toxin of sunflower” (which refer to agri-cultural practices);
• “Pollution” or “climate change” or “meteorology” (which repre-sent the external or environmental causes);
• “Multi-factors” or “many factors”;
3. Articles containing sentences as below are assigned to the class claiming there exists no understanding yet:
• “While it would be impossible to formally accuse the pesticide and exclusively responsible for the fall of the hive population”; • “It is no element of new evidence of anything”;
• “All data analyzed does not criminalize formally and exclusively the treatment of sunflower seeds”;
• “The pesticide was evaluated on two occasions over the last three years, and we believe that there is no cause and effect relationship between our product and the problems of orientation of bees”. Semi-automatic textual analysis tools combined with 3 human readings for validation has enabled to tag 84% of the corpus articles, leaving 16% of the articles untagged. We have restricted the corpus to the tagged articles shown in Figure (2).
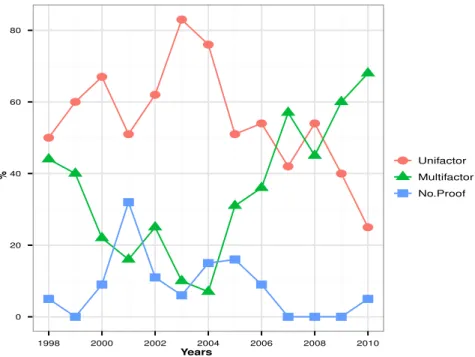
According to the discursive paradox previously defined, one can make the observation that each premiss or conclusion reasoning corresponds to a public debate (Gusfield, 1981) phase during the same controversy. The premisses focus on the causes of the bees disappearing from 2005 to 2010 whereas the conclusion focuses on the fact that bees are disappearing (and precautionary principle is needed) from 1998 to 2004. The two periods are separated with an event in 2004: the application of Precautionary Principle.
Years are numbered from T = 0 for 1998 to T = 12 for 2010. The corresponding proportions of articles for the uni-factor class denoted by PT
Years % 0 20 40 60 80 1998 2000 2002 2004 2006 2008 2010 Unifactor Multifactor No.Proof
Figure 2: Proportions of articles published each year by daily press dealing with uni-factor, multi-factors or no-proof categories. 84% of the corpus, i.e. 1233 articles, have been tagged.
are respectively 0.500, 0.60, 0.677, 0.513, 0.627, 0.831, 0.769, 0.517, 0.540, 0.422, 0.544, 0.40, 0.255 with T = 0, 1, . . . , 12. A indicates the opinion of journalists who belong to the uni-factor class. Simultaneously, the opinion of journalists belonging to either one of both other two classes, the multi-factors and the no-proof ones, is noted B.
3. The newspapers publications in time highlight the main profiles types
In his seminal critics of public opinion (Bourdieu, 1973), Bourdieu high-lighted theoretical warnings that can be used to deconstruct public opinion. Indeed, the author mentioned 2 effects that could produce opinion: a dis-positional effect and a dis-positional effect. The disdis-positional effect highlights the fact that some agents do not always follow the opinion because of their own habitus whereas some other agents can follow social influence because of their position in their respective social field. Then, we use this distinction to question the data supposing agents may have dispositional or positional good reasons 10 to change or not their opinion. We test this hypothesis at
the newspaper level to know if it is robust enough for the modeling is the step after.
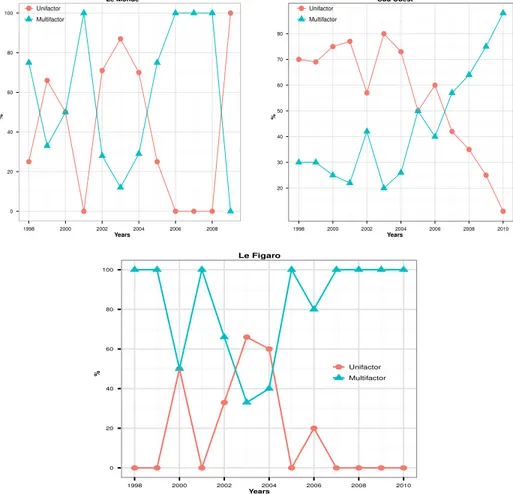
The corpus of selected articles is sourced from almost 60 different news-papers. Then to model dynamics of opinion we need to check if journal con-tributions exhibit different profiles. Looking at the concon-tributions from “Le Monde” (Figure 3) shows large variations. Indeed, some years present 0% of the articles for either A or B as respectively in 2001, 2006, 2007, 2008, 2009. Such facts mean that during those years all journalists were either all dis-positional agents or dis-positional agents with some disdis-positional agents present only on the opinion side which has been advocated at 100%. In other words a 0% support for one opinion implies the absence of dispositional agents on this side. Years for which the dynamics did not reach 100% for one opinion, dispositional agents may have been present on both sides.
While 4 years 2001, 2006, 2007, 2008 are characterized by zero disposi-tional agents for the uni-factor cause, only 1 year, 2009, feature zero dis-positional agents for the multi-factors cause. When the year contributions does not reach 100% and split over support of A and B, we can infer about
10
We use here a formal sociological frame first initiated by Simmel(Boudon, 1984, p. 2008).
a possible existence of dispositional agents on one or two sides like for 1998, 1999, 2000, 2002, 2003, 2004.
The contributions from newspaper Sud Ouest (Figure 3) reveals the pos-sible presence of dispositional agents on each side every year. Contributions from newspaper “Le Figaro” (Figure 3) exhibit as “Le Monde” several years with 100% polarization, namely 1998, 1999, 2001, 2005, 2007, 2008, 2009, 2010. These years are characterized by zero dispositional agents for the uni-factor cause (while for “Le Monde” it occurs for both sides). This position was modified in 2000 and really reversed in 2002-2004, with a slight surge in 2006.
The results of Figure 3 hint at a key role played by dispositional agents in the making of the data of Figure 2. Such a fact would question the social meaning of those results. Accordingly, it is of importance to extract the values of the proportions of dispositional agents present at each year. Specifically the successive brutal changes of trends as exhibited by Figure 2 indicate a change of proportions of the dispositional agents.
Since the goal is to build back the actor networks from the dynamics, implementing the GUF model appears appropriate as it does not infer struc-tures of network a priori. Indeed, this model incorporates only the effect of dispositional agents on the dynamics of opinion among positional agents (Galam, 2010; Galam et Jacobs, 2007; Galam, 2005). Moreover, it has been shown that the size of the local update groups does not modify the main re-sults since increasing the group size reduces the number of updates required to reach the attractors. To keep the equations solvable analytically group updates of size 3 have been used.
4. Using a model to reinterpret the problem
4.1. The framework of basic GUF which depends on the group size distribu-tion
The GUF model investigates the competition between two opposite opin-ions within a population of inflexible and flexible agents, that are respectively our dispositional and positional agents. In that heuristic social space, each agent has only one opinion, i.e. one way to report the facts in the case of journalists. Rules of diffusions assert positional agents can shift opinion. In-deed, within a group of agents, a positional agent gets the opinion which has the majority since the positional effect lead him to adapt his position whatever are his “good” reasons to follow it. Then dynamics is implemented
Le Monde Years % 0 20 40 60 80 100 1998 2000 2002 2004 2006 2008 Unifactor Multifactor Sud Ouest Years % 20 30 40 50 60 70 80 1998 2000 2002 2004 2006 2008 2010 Unifactor Multifactor Le Figaro Years % 0 20 40 60 80 100 1998 2000 2002 2004 2006 2008 2010 Unifactor Multifactor
Figure 3: Proportions of articles published each year by Le Monde (total of 67 tagged articles), Sud Ouest (total of 209 tagged articles) and Figaro (total of 62 tagged articles) newspapers dealing with uni-factor and not-unifactors which includes both multi-factors and no proof papers.
via repeated random meeting of agents within small groups of various sizes in a randomized network. At each distribution, agents’ opinions are locally updated according to the respective local majorities in its own group. For even size groups in case of equality, agents preserve their current position towards the way to describe the facts.
In real life people meet and discuss in groups of different sizes. However these groups are made of small sizes. In the case of journalists treated here, those meetings occur within the social network of journalists in which they can interact. To account for this reality the model can be extended to include a distribution of sizes leading to the general update expression,
pt+1 = L X i=1 ai{ i X j=[i 2+1] Cjipjt(1 − pt)(i−j)+ 1 2k(i)C i i 2 p i 2 t(1 − pt) i 2}, (1)
where L is the size of the largest group, Ci
j ≡ (i−j)!j!i! , [ i 2+1] ≡ Integer Part of (i 2 + 1), and k(i) ≡ [ i
2] − [i−12 ] yielding V (i) = 1 for i even and V (i) = 0
for i odd. The proportion of groups of size i is defined by the probability distribution ai under the constraint PLi=1ai = 1. Including groups of size
one accounts for the fact that not all agents discuss at the same time in local groups.
Although an infinite number of size distribution {ai} is possible in
prin-ciple, it happens that the dynamics is qualitatively unchanged with the two attractors pA = 1, pB = 0 and the tipping point pt= 12 being always
invari-ant. The only and main difference is the number of required iterations to reach either attractor. Larger groups contribute to accelerate the polariza-tion effect. Nevertheless, analytic solving of Eq. (1) is possible only up to L = 4, otherwise for L > 4 numerical solving is required. On this basis, to keep calculations simple and tractable we restrict the group sizes to 3 in the following of the paper.
4.2. Series of continuity in discontinuity
The uni-factor distributions in Figure 2 reveal a series of brutal variations at years 2000, 2001, 2003, 2005, 2006, 2007, 2008. In parallel, according to the model ( Eq. 1) when opinion reaching the majority is even more dominating, which is incoherent with the empirical data evolutions. This point reveals a discontinuity point after a series of continuity in the dynamics. To counter
this systematic increasing trend external parameters must be integrated in order to enable a topological modification in dynamics.
It is worth to stress that, in the model, dispositional agents do not have more powerful arguments, they still have each one vote alike positional agents. They do obey one person one vote (i.e. a pressure to describe the facts in one way) in a group discussion. However once every agent in the local group has written, they do not follow the local majority rule in case they are minority. In the present work we consider a population which is a mixture of positional and dispositional agents. The proportions of dispo-sitional agents are external parameters while the respective proportions of positional agents in favor of A or B are internal parameters driven by the dynamics of local discussions. The possibility to make dispositional agents an internal parameter has been studied in (Martins et Galam, 20013) but is not introduced here. Accordingly equation becomes,
pt+1 = −2p3t + (3 + a + b)p 2
t − 2apt+ a, (2)
where a and b denote respective proportions of A and B dispositional agents. Associated dynamics has been extensively studied in (Galam et Ja-cobs, 2007; Galam, 2005).
4.3. Fitting the modeling to the empirical data
Proportions of dispositional agents can be modified every year as a result of the activation of external pressures in favor of either one opinion. Then each year a positional agent may turn to an dispositional status and vice versa. During each year, dispositional agents proportions are kept fixed for each successive updates.
Then dynamics of opinion is implemented in two steps. First, some fixed proportions of dispositional agents are given. And in a second step, n con-secutive updates of positional agents are implemented keeping unchanged the dispositional agents proportions. Then the proportions of dispositional agents are modified before n new updates are performed. This two steps dynamics is implemented by modifying Eq. (2) into
pT,t+1 = −2p3T,t+ (3 + aT + bT)p2T,t− 2aTpT,t+ aT, (3)
where pT,t and (1 − pT,t) denote the proportions of journalists in favor
proportions of dispositional agents aT and bT are independent of the
intra-time. They depend only on the year T . Given pT,t, the model determines
pT,t+1 obtained after one update of opinions for fixed values of aT and bT.
To account for the interplay between the two timescales we notice that since T = 0, ..., 12 for the years and t = 1, 2.., n for the intermediate intra-time within a year, we have the congruence (T, n) = (T + 1, 0).
In addition, we note that only the fraction pT,t− aT have a positional
influence, i.e., able to shift opinion under convincing local arguments. The same holds for opinion B. We thus have pT,t ≥ aT and 1 − pT,t ≥ bT ⇐⇒
pT,t≤ 1 − bT, which combine to,
aT ≤ pT,t≤ 1 − bT, (4)
with the constraints 0 ≤ aT ≤ 1, 0 ≤ bT ≤ 1 and 0 ≤ aT + bT ≤ 1. A
detailed study of the properties of Eq. (3) has been performed in (Galam, 2010; Galam et Jacobs, 2007).
4.4. Implementing model to rediscover the data
It is worth to emphasize that we do not aim at reproducing the data exhibited in Figure (2). The methodology aims at evaluating the minimum values of both the respective proportions of dispositional agents aT and bT
and the intra-time n, which are compatible with the data for every pair of successive years. Given a pair of values PT and PT+1 we determine the
minimum values aT, bT and n, which starting from pT,0 = PT reaches pT,n=
PT+1 within a precision of 10−3 after n successive iterations of Eq. (3). In a
second step, writing pT,n = pT+1,0 we evaluate the minimum values of aT+1
and bT+1 which allow to get pT+1,n = PT+2 starting from pT+1,0.
More precisely, we start form p0,0 = P0 to evaluate a0 and b0 such that
p0,n= p1,0 = P1. Then we evaluate a1 and b1 such that p1,n = p2,0 = P2. And
so on and so forth up to the evaluation a11 and b11 such that p11,n= p12,0=
P12.
To determine which value n to use, we notice that the number of articles for each year period is distributed within 3 different groups with respectively less than 100 (10), between 100 and 300 (2), and more than 300 (1) as seen in Table (1). For each group we determine what is the minimum value of n which allows to implement pT,n = PT+1 starting from pT,0 for all cases of
each group. We found respectively, n = 3, 5, 8 as reported in Table (1). From Table (1) it is seen that for each year given n, only one fitting parameter is used since always either aT or bT is equal to zero. The variation
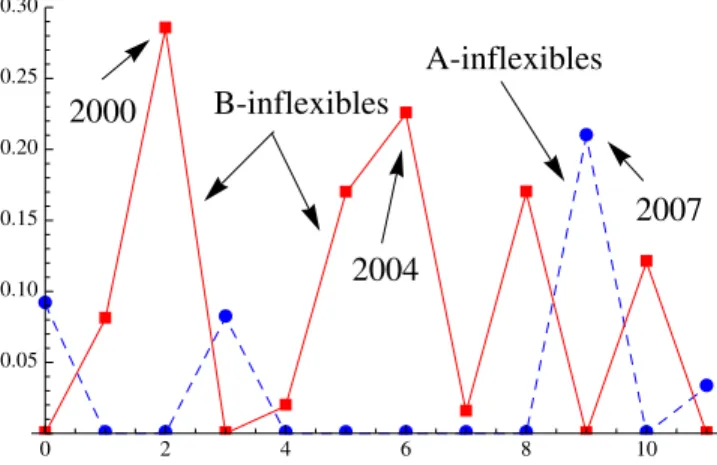
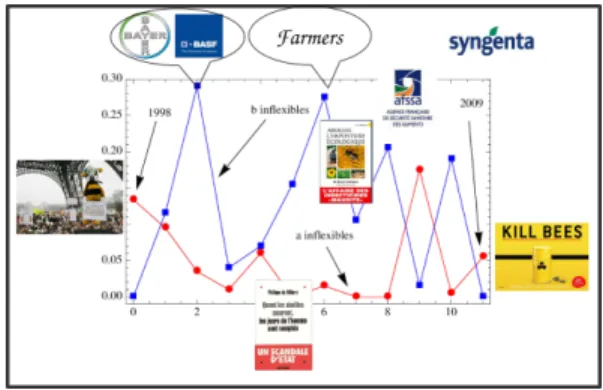
Year T anT bnT pT,0 → pT,n Nb ∆PT n 1998 0 0.091 0 0.500 → 0.600 18 0.118 3 1999 1 0 0.080 0.600 → 0.677 20 0.109 3 2000 2 0 0.285 0.677 → 0.513 31 0.084 3 2001 3 0.081 0 0.513 → 0.627 37 0.082 3 2002 4 0 0.019 0.627 → 0.831 59 0.063 3 2003 5 0 0.169 0.831 → 0.769 178 0.028 5 2004 6 0 0.225 0.769 → 0.518 368 0.022 8 2005 7 0 0.015 0.518 → 0.541 85 0.054 3 2006 8 0 0.169 0.541 → 0.422 61 0.064 3 2007 9 0.209 0 0.422 → 0.544 71 0.059 3 2008 10 0 0.121 0.544 → 0.400 169 0.038 5 2009 11 0.033 0 0.400 → 0.251 85 0.053 3 2010 12 0.251 51 0.061
Table 1: Dispositional agents proportions at each year to reach the following one covering 12 annual intervals.
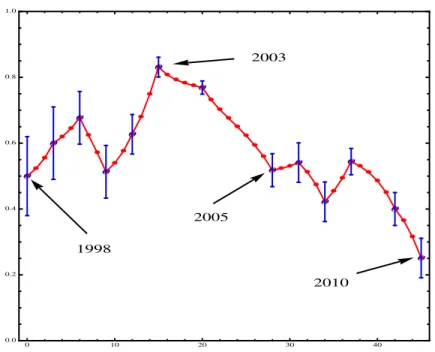
of pT,n as a function of successive iterations are shown in Figure 4. The error
bars are also reported in the Figure although GUF values of the series of pT,n
recover perfectly the data values PT for all the 13 years. Figure 5 exhibits
the simultaneous variations of aT and bT as a function of T .
5. Behind the data another sight on the networks
The picture drawn from this heuristic framework leads to a reverse conclu-sion of what would have been expected a priori. Proportions of categorized articles follow different evolutions than proportions of dispositional agents. As a consequence, one can not interpret evolution of text occurrences infer-ring actors behavior without questioning actor network topologies.
Starting from a balance in 1998, till the year 2010, the public debate around the controversy can be sliced in two phases. The first phase focuses on the disappearing of the bees and the second one focuses on the multi-factor causes. These two phases are separated by the precautionary principle which was applied in 2004. The first phase is a conclusion period focused on the bees hazard (from environment to human risks). The second phase is a premiss phase focused on the causes (from pesticides only to other factors maybe).
æ æ æ æ æ æ æ æ æ æ æ æ æ æ æ æ æ æ æææ æ æ æ æ æ æ æ æ æ ææ æ æ æ æ æ æ æ æ æ æ æ æ æ æ O O O O O O O O O O O O O 1998 2003 2005 2010 0 10 20 30 40 0.0 0.2 0.4 0.6 0.8 1.0
Figure 4: Evolution of the proportion of journalists advocating the uni-factor cause as a function of updates using Eq. (1) with 9 × 3 + 2 × 5 + 1 × 8 = 45 updates. Circles show the overlap with the data calculated per year and vertical lines indicate error approximation using the variance of a binomial generator.
If at the first year of the public controversy proportions of words in pa-pers are equally distributed (P0 = 0.50) the uni-factor agents appear to have
dispositional supporters (beekeepers and their local networks) on their side while none was present on the other side. Indeed, as multiple interviews with industrialists11 unveil it: at this period industrialists did not consider
bee-keepers’ alert as a threat for their business. This result highlights the deter-minant advantage made by the first whistle-blowers about a new controversy and the importance of taking into account possible negative externalities of commercial products.
Once the controversy was launched by an ”anti-gaucho” collective, indus-trialist tried to communicate on the bias of scientific studies accusing pesti-cides while beekeepers side turned down its pressure. But, with the threshold nature of the dynamics (Galam et Jacobs, 2007; ?) , the next years brought
11
æ æ æ æ æ æ æ æ æ æ æ æ à à à à à à à à à à à à B-inflexibles A-inflexibles 2000 2004 2007 0 2 4 6 8 10 0.05 0.10 0.15 0.20 0.25 0.30
Figure 5: Variation of dispositional agents proportions aT and bT as a function of year.
back the uni-factor side to rather high values in 2002 and 2003. Indeed, beekeepers view has been translated into public media through experts or political spokesmen during 2004 regional and European elections. Indeed, pesticides have been banned from sell that year.
After 2005, another kind of whistle-blower focuses on other causes. In-deed, new scientific studies and lobbying of industrialist can be questioned: focus is made on many other factors different than pesticides. With new sci-entific studies the years after, the multi-factor side is relaunching the debate in the media the years after. Finally, from empirical dynamics we are lead to question the possible existence of interactions between journalists and the involved actors who intervene in the public debate.
6. Conclusion
This paper shows how empirical text-mining descriptive analysis and the-oretical modeling can together produce a heuristic framework.
First a text-mining analysis of published articles has been performed in order to categorize articles. Facts reported dealing with the causes of the critical phenomenon have been used to nest the papers. On one category, papers advocate that the cause is uni-factor, namely the exclusive use of pesticides. On the other category, the causes are discussed with multi-factors causes or the absence of an identified cause yet. In such approach, we do not consider the risks of chemicals only but focus on the honey bees harm and
Figure 6: Variation of dispositional agents proportions aT and bT as a function of year
with sociological interpretation.
how actors are translating the context of the issue in public debate. The axis of the public problem has been highlighted with the discursive paradox showing a possible disagreement among experts and the difficulty of simple addition on qualitative reasoning. However, quantitative data analysis reveal two phases during the 13 years of the controversy: one public debate focused on the conclusion (i.e. the honey bees are dying because of a single cause, the pesticides) and one public debate focused on the premisses (i.e. many factors are implied in this phenomena). Despite this result, discontinuity of the data hardly enable any sociological induction. That is why data have been confronted with another complementary approach.
Second, the evolution of each proportions of categorized articles is as-sumed to be rebuilt with dynamics of interactions among journalists. Two types of agents are considered. Some never change their mind with a dis-positional behavior depending on their social anchorage (habitus or “good reasons” or other explanations). Some have a positional behavior since they may shift their opinion according to their related networks. The respective proportions of agents follow a function of time and vary only on a year time scale. Between each pair of consecutive years, the fraction of journalist in each class is inferred from the distribution of opinions using a model of opin-ion diffusopin-ion. The evolutopin-ion of respective proportopin-ions of dispositopin-ional agents is thus obtained for each year. With its randomized network modeling and with its analytical solution, the model does not suppose any network a pri-ori in order to question quantitative text mining evolutions with the results of the simulation. In that context, actor networks can be questioned with
scenarii which include external pressure, social structure and frame of the debate around the non human actants.
Third, those proportions of dispositional agents extracted from the model, are turned back towards the empirical data to question the interactions be-tween agents and the topology of networks. Finally, these results are con-fronted to qualitative analysis and/or interviews. Moreover we could question possible pressure on the journalists from the various involved parties in order to keep on exploring the controversy.
As a conclusion, starting from non human actants (i.e. bees, pesticides, mushrooms and others factors) mentioned in published articles, this frame-work offers methodology to question back actor netframe-works (i.e. journalists, whistle-blowers, spokesman) implied in a controversy dealing with contro-versial innovations.
References
Bertrand, A., Chateauraynaud, F. et Torny, D.. Processus d’alerte et dis-positifs d’expertise dans les dossiers sanitaires et environnementaux. Ex-primentation d’un observatoire informatis de veille sociologique partir du cas des pesticides. Rap. tech., EHESS, GSPR, Paris, 2007.
Boudon, R., 1984. La place du d´esordre. PUF Paris.
Bourdieu, P., 1973. L’opinion publique n’existe pas. Temps modernes, (318):1292–1309.
Burke, K., 1969. A grammar of motives. University of California Pr.
Callon, M.. J. Law, Power, action and belief: a new sociology of knowl-edge?, chap. Some elements of a sociology of translation: domestication of the scallops and the fishermen of St Brieuc Bay, p. 196–223. Routledge, London, 1986.
Callon, M., Courtial, J.-P. et Laville, F., 1991. Co-word analysis as a tool for describing the network of interactions between basic and technological research: The case of polymer chemsitry. Scientometrics, 22(1):155–205. Carroll, Lewis, 1895. What the tortoise said to achilles. Mind, 4(14):pp. 278–
280. ISSN 00264423. URL https://acces-distant.sciences-po.fr: 443/http/www.jstor.org/stable/2248015.
Castellano, C., Fortunato, S. et Vittorio Loreto, C., 2009. Statistical physics of social dynamic. Reviews of Modern Physics, (81):591–646.
Chateauraynaud, F.. La croyance et l’enquˆete, vol. XV, chap. L’´epreuve du tangible. Exp´eriences de l’enquˆete et surgissements de la preuve. Raisons pratiques, Paris, 2004.
Chateauraynaud, F. et Torny, D., 1999. Les sombres pr´ecurseurs. Une so-ciologie pragmatique de l’alerte et du risque. ´Ecole des Hautes ´Etudes en sciences sociales, Paris.
Chiron, J. et Hattenberger, A.-M.. Mortalit´es, effondrements et affaiblisse-ments des colonies d’abeilles. Rap. tech., AFSSA, Novembre 2008.
Delano¨e, A., 2004. Quand les abeilles meurent les articles sont compt´es, g´en´ealogie et analyse s´emantique d’une crise m´ediatique. VSST, Veille Strat´egique Scientifique et Technologique.
Delano¨e, A., 2010. Statistique textuelle et s´eries chronologiques sur un cor-pus de presse ´ecrite. Le cas de la mise en application du principe de pr´ecaution. JADT, Journ´ees internationales d’Analyses statistiques des donn´ees Textuelles.
Delano¨e, Alexandre et Galam, Serge, 2014. Modeling a controversy in the press: The case of abnormal bee deaths. Physica A: Statistical Mechanics and its Applications, 402:93–103.
Dewey, J., 1927. The public and its problems. Holt, New York.
Doucet-Personeni, C., Halm, MP., Touffet, F., Rortais, A. et Arnold, G.. Imi-daclopride utilis en enrobage de semences (gaucho) et troubles des abeilles. Rap. tech., Comit Scientifique et Technique de l’Etude Multifactorielle des Troubles des Abeilles, 2003.
Edling, C., 1998. Essays on social dynamics. Department of sociology Stock-olm University, StockStock-olm (Sweden).
Frege, G., 1884. Les fondements de l’arithm´etique. ´Editions du Seuil. Tra-duction et introTra-duction de Claude Imbert publie en 1969.
Galam, S., 2005. Local dynamics vs. social mechanisms: a unifying frame. Eur. Phys. Lett., 70:705–711.
Galam, S., 2008. Sociophysics: a review of galam models. International Journal of Modern Physics, (C 19):409–440.
Galam, S., 2010. Public debates driven by incomplete scientific data: The cases of evolution theory, global warming and h1n1 pandemic influenza. Physica A, (389):36193631.
Galam, S., 2012. Sociophysics, A Physicist’s Modeling of Psycho-political Phenomena. Springer, New-York.
Galam, S. et Jacobs, F., 2007. The role of inflexible minorities in the breaking of democratic opinion dynamics. Physica A, (381):366–376.
Gilbert, C. et Henry, E., 2012. La dfinition des problmes publics: entre publicit et discrtion. Revue franaise de sociologie, 53(1):35–59.
Granovetter, Mark et Soong, Roland, 1983. Threshold models of diffusion and collective behaviour. Journal of Mathematical Sociology, 9(3):165. ISSN 0022250X. URL https://acces-distant.sciences-po.fr: 443/http/search.ebscohost.com/login.aspx?direct=true&db=sih& AN=9674102&site=ehost-live.
Gusfield, J.-R., 1981. Drinking-driving and the symbolic order. The culture of public problems. The University of Chicago Press.
Hardwig, J., Jul 1985. Epistemic dependence. The Journal of Philosphy, 82 (7):335–349.
Katz, E. et Lazarsfeld, P., 1955. Personal influence. The part played by people in the flow of Mass Communications. Transaction Publishers, New Brunswick, New Jersey.
Lebart, L. et Salem, A., 1994. Statistique Textuelle. Dunod. 216 p.
List, Christian et Pettit, Philip, 2005. On the many as one: A reply to kornhauser and sager. Philosophy & Public Affairs, 33(4):pp. 377– 390. ISSN 00483915. URL https://acces-distant.sciences-po.fr: 443/http/www.jstor.org/stable/3558028.
Manzo, Gianluca, 2005. Variables, mcanismes et simulations: une synthse des trois mthodes est-elle possible? une analyse critique de la littra-ture. Revue franaise de sociologie, 46(1):pp. 37–74. ISSN 00352969.
URL https://acces-distant.sciences-po.fr:443/http/www.jstor. org/stable/25046510.
Martins, ACR. et Galam, S., 20013. Building up of individual inflexibility in opinion dynamics. Physical Review E, 87(042807).
Maxim, L. et van der Sluijs, J. P., 2010. Expert explanations of honey-bee losses in areas of extensive agriculture in france: Gaucho compared with other supposed causal factors. Environmental Research Letters, 5 (1):014006. URL http://stacks.iop.org/1748-9326/5/i=1/a=014006. Salem, A., 1988. Approches du temps lexical, statistique textuelle et sries
chronologiques. Mots, 17.
Salem, A.. La lexicomtrie chronologique. l’exemple du pre duchesne d’hbert. In Langages de la rvolution, p. 1770–1815. 4me Colloque de lexicologie politique, 1994.
Suryanarayanan, Sainath et Kleinman, Daniel Lee, 2013. Be (e) coming experts: The controversy over insecticides in the honey bee colony collapse disorder. Social Studies of Science, 43(2):215–240.
T¨onnies, F., 1922. Kritik des ¨offentlichen Meinung. Springer, Berlin Heidel-berg.
Watts, D.-J. et Dodds, PS. Threshold models of social influence processes. Oxford Handbook of Analytical Sociology, 2009.