HAL Id: hal-01593329
https://hal.archives-ouvertes.fr/hal-01593329
Submitted on 26 Apr 2019
HAL is a multi-disciplinary open access
archive for the deposit and dissemination of
sci-entific research documents, whether they are
pub-lished or not. The documents may come from
teaching and research institutions in France or
abroad, or from public or private research centers.
L’archive ouverte pluridisciplinaire HAL, est
destinée au dépôt et à la diffusion de documents
scientifiques de niveau recherche, publiés ou non,
émanant des établissements d’enseignement et de
recherche français ou étrangers, des laboratoires
publics ou privés.
Composition gradient from surface to core in dairy
powders: Agglomeration effect
Ingrid Murrieta-Pazos, C. Gaiani, Laurence Galet, J. Scher
To cite this version:
Ingrid Murrieta-Pazos, C. Gaiani, Laurence Galet, J. Scher. Composition gradient from surface to
core in dairy powders: Agglomeration effect. Food Hydrocolloids, Elsevier, 2012, 26 (1), pp.149-158.
�10.1016/j.foodhyd.2011.05.003�. �hal-01593329�
Composition gradient from surface to core in dairy powders: Agglomeration effect
I. Murrieta-Pazos
a, C. Gaiani
a,*, L. Galet
b, J. Scher
aaUniversité de Lorraine, ENSAIA e LIBio (Laboratoire d’Ingénierie des Biomolécules), 2 Avenue de la forêt de Haye, B.P. 172, 54505 Vandœuvre-lès-Nancy Cedex, France bUniversité de Toulouse, Mines Albi, CNRS, Centre RAPSODEE, Campus Jarlard, 81013 Albi Cedex 09, France
Keywords: Dairy powder Surface gradient Agglomeration XPS EDX
a b s t r a c t
Gradient compositions in standard and agglomerated industrial milk powders were studied. X-ray Photoelectron Spectroscopy (XPS) coupled with Energy Dispersive X-ray (EDX) analyses were used to investigate respectively the first 5 nm and the first micrometer of the particle surface. From these results, two models were proposed concerning the distribution of milk components (lactose, lipids, proteins and minerals) from the particle surface to the core. Concurrently, different milk fat fractions (total, encap-sulated and free fat) were extracted from standard and agglomerated powders and analyzed by Differ-ential Scanning Calorimetry (DSC) as well as Gas Chromatography (GC). Similar thermal characteristics but variable fatty acid profiles were found between these fractions. No difference between standard and agglomerated powders was observed in both gradient composition and fat fractions properties, sug-gesting that agglomeration process don’t change the particle surface properties.
1. Introduction
Milk powders are produced by spray drying assuming that milk components (lipids, proteins, lactose and minerals) are distributed uniformly in the solution feed. Nevertheless, during the drying process, these components will be redistributed in the droplet resulting in an heterogeneity between the surface and the core of the particle (Briggs, 1994; Gaiani et al., 2006; Kim, Chen, & Pearce, 2002; Nijdam & Langrish, 2006). The surface distribution of the components was found to vary accordingly to a multitude of factors related to the process (Gaiani et al., 2010) and/or the initial liquid properties (Kim, Chen, & Pearce, 2009; Millqvist-Fureby, Elofsson, & Bergenståhl, 2001). Factors influencing the process are variable and may concern the physical configuration of the dryer, the feed characteristics or also the operation conditions. The initial prop-erties of the spray-drying liquid are principally linked with the chemical composition of the liquid, the state of the components or the size of the fat globules. Consequently, powder surface distribution of the components has a strong influence on powder functionality (reconstitution properties, stickiness, flowability,
floodability, oxidation.) and the surface is determinant for the final attributes of the powder (handling, processing and final application).
Two types of powders are industrially produced: standard (S) or agglomerated powders (A). Standard powders present a fine dusty structure, making the powder difficult to rehydrate in water. This is the main reason why agglomerated powders were devel-oped. The use of agglomerated powders improved some functional properties mainly related to the handling and reconstitution properties (Forny, Marabi, & Palzer, 2011; Gaiani, Schuck, Scher, Desobry, & Banon, 2007). The manufacture of these powders follows the standard process of drying. However, during spray drying, small particles of powder leaving the drier are recuperated in cyclones and injected to the drying chamber close to the atomizer. The wet droplets produced by the nozzle could collide with the fines and stick together, forming larger and irregular shaped called agglomerates. The reconstitution of agglomerated powders was already described by Forny et al. (2011)through several steps including: i) wetting of the agglom-erate followed by the penetration of the liquid into the pore matrix; ii) immersion of the agglomerate into the liquid; iii) dissolution of the agglomerate’s solid bridges followed by dispersion of the primary particles within the liquid volume; iv) dissolution of soluble primary particles. The first step (i.e. wetting step) was mainly related to the presence of inter-particle pores available for capillary rise and allowing a quicker wetting time. It was also already shown that the composition of the powder surface may influence this step (Gaiani et al., 2006; Kim et al.,
Abbreviations: XPS, X-ray Photoelectron Spectroscopy; SEM/EDX, Scanning Electron Microscopy/Energy Dispersive X-ray; DSC, Differential Scanning Calorim-etry; GC, Gas Chromatography; S, Standard; A, Agglomerated; WMP, Whole Milk Powder; SMP, Skim Milk Powder.
*Corresponding author.
2002). Indeed, carbohydrates (mainly lactose) and minerals were mostly hydrophilic components whereas lipids are more hydro-phobic since their carbon chain structures are non-polar. Depending on their localization at the surface of the particles the wetting properties may be variable.
During the last decade, variable analytical techniques have been developed to better investigate the surface of a dairy powder. XPS provides elemental (atomic percentages) and chemical (binding percentages) information of the first five to 10 nm of the powder (Fäldt, 1995). From the atomic values, the determinations of the principal components percentages (protein, lactose and lipids) present at the powder surface were done with the help of a matrix formula (Fäldt, 1995; Gaiani et al., 2006; Kim et al., 2002). Some authors applied this data treatment with success and correlated the results with variable functional properties (Briggs, 1994; Gaiani et al., 2007; Kim et al., 2002; Nijdam & Langrish, 2006). Surface investigations were also possible by solvent extraction. Several techniques have been adapted in order to extract fat fractions (Kim, Chen, & Pearce, 2005a; Kim, Chen, & Pearce, 2005b; Vignolles et al., 2009). From these extractions, it was possible to separate free, inner, encapsulated and total fat. It was observed that the surface of the particle was mostly governed by the free and inner fat (Gaiani et al., 2010; Kim et al., 2002, 2005a, 2005b; Millqvist-Fureby et al., 2001). Another classical way to characterize the surface of a dairy powder is the use of Scanning Electron Microscopy (SEM). Different surface content in lactose, lipids and/or protein were related to the surface topography: powder more or less shriveled, smooth, dents (Mistry, Hassan, & Robinson, 1992). Nevertheless, any quantification with this technique was impossible. The powders surface investigation at a depth of 1
m
m is also possible with the help of EDX. This technique has been only performed for inorganic and pharmaceutical powders (Huang, Yang, & Cao, 2010; Thibert & Hancock, 2001). The field of food powders was never reported up to now.Despite these already well-developed techniques, information concerning the gradient of composition from the surface to the core for classical milk powders such as whole milk powders and skim milk powders are lacking. Furthermore, while the surface compo-sition of standard powders had been widely studied (Gaiani et al., 2006; 2010; Kim et al., 2002; 2005a), the surface of agglomerated powders had not been explored intensively up to now. This is the reason why this paper is focused on the gradients comparison in agglomerated and standard powders. The concurrent use of surface atomic techniques (SEM, EDX, XPS) and chemical extractions (free and encapsulated fat extractions) allowed the development of gradient composition models for whole and skim milk powders agglomerated or not.
2. Materials and methods 2.1. Materials
Four industrial milk powders obtained from Lactalis (Laval, France) were studied. Skim and whole milk powders are under standard (S) and agglomerated (A) form. The following composi-tions (g 100 g!1) were measured respectively for skim milk
powders (SMP): water (3.8), proteins (37.1), lactose (52.0), lipids (1.4) and ashes (5.7) and whole milk powders (WMP): water (3.9), proteins (26.2), lactose (36.7), lipids (27.3) and ashes (5.9). Total proteins were determined from Kjeldahl and lactose with an enzymatic kit. Water content was measured by weight loss after drying at 105 "C and ashes after incineration at 550 "C. Finally,
lipids were calculated according to the Röse-Gottlieb method. Similar compositions were measured for standard and agglomer-ated powders.
2.2. Fat extraction 2.2.1. Free fat extraction
The free fat was defined as the fat that was not entirely coated and stabilized by surface-active elements or a matrix conformed by proteins and lactose (Buma, 1971; Vignolles et al., 2009). It is located both at the surface and inner parts of a powder surface particle (Vignolles, Jeantet, Lopez, & Schuck, 2007). Free fat was extracted followingVignolles et al. (2009)with some adaptations. The powder (10 g) was first weighed in a beaker previously dried and weighted. Petroleum ether was added as solvent in a 1:5 (p:p) proportion. Then, the mix was shaken with a magnetic stirrer (Variomag poly 15) at 300 rpm. After 5 min, the solvent was separated by filtration and recuperated in a round-bottom boiling flask. After 5 extractions, the powder was dried under fume cupboard and the solvent containing the surface fat was removed with a rotary vacuum evaporator (Heidloph laboratora 4000) at 40"C and 40 rpm. The boiling flask without solvent was dried in an
oven to 100"C for 1 h. Finally, the free fat percentage was calculated
by difference of weight. Samples were stored at 4"C and kept away
from light.
2.2.2. Encapsulated fat extraction
Encapsulated fat was defined as the fraction still present in the particle after the free fat extraction. Surface-active elements or a matrix of proteins and amorphous lactose protects this fat (Vignolles et al., 2007, 2009). The quantification of this fat was made with the Röse-Gottlieb method (IDF, 1987) using the powder recuperated after the free fat extraction.
2.2.3. Total fat extraction
Total fat was extracted and quantified with the Röse-Gottlieb method (IDF, 1987) using the initial powder.
2.3. Thermal properties by DSC
Differential scanning calorimetry (DSC 204 F1, Netzch, Phoenix) was used to determine the thermal properties of three fat fractions (free, encapsulated and total). The fractions were extracted only from WMP (standard and agglomerated). Cell calibration was achieved with indium. About 10 mg of sample was placed in an aluminum pan manually sealed and perforated. The melting profiles of fat fractions were first studied on heating from 20"C to
70"C at 5"C min!1 to eliminate the crystals. Then, the overall
thermal profiles were registered on cooling from 70"C to !80"C
and on subsequent heating from !80"C to 100"C at 5"C min!1.
Each sample was performed in duplicate. 2.4. Fatty acid profile by Gas Chromatography
Fatty acid composition of milk fat fractions was determined by GC after conversion of fatty acids into the corresponding methyl-esters. Each fat fraction (0.1 g) was dissolved in 10 mL of hexane. One ml of this solution was then transferred to a screw-cap reaction tube. Hexane was evaporated under nitrogen. Then, 1 mL of toluene and 1 ml of boron trifluorideemethanol (14%) were added. The mix was shacked in a vortex and reacted at 100"C for 45 min. After
cooling at room temperature, 1 ml of water was added to stop the reaction, followed by a further 1 ml of cyclohexane. Finally, 1
m
l of the organic phase was injected in a Perichrom! 2000 Gas Chro-matography (Perichrom, Saulx-les-chartreux, France). The separa-tion was done on a fused capillary column of silica 50 m in length and 0.25 mm of internal diameter (CP7419 VARIAN, North Amer-ica). The program comprised an initial period at 120"C (2 min),at 180"C (8 min). The injector and detector were both maintained
at 260"C.
2.5. e Microscopy techniques 2.5.1. SEM
The powders were examined with a Hitachi SEM S2500 instrument operating at 10 kV. They were spread at the surface of a sticky plastic circle fixed on a support. The samples were then covered with gold particles by sputtering (Bio-Rad type SC 502). 2.5.2. EDX/SEM
Samples were also characterized with an EDX analyzer coupled to a ESEM XL30 (Philips CM20) microscope instrument operating at 20 kV and equipped with an EDAX detector. Samples analyzed by this technique were not metalized. EDX is a technique coupled to SEM able to analyze the atomic composition of a sample. It works in a depth of approximately 1
m
m. This technique presents the advantage to permit the observation of the sample by SEM before making the analysis.2.6. Particles size
The size distribution was measured with a laser light diffusion granulometer at a wavelength of 632.8 nm (Mastersizer S, Malvern instruments, UK) in a liquid phase (ethanol was used as dispersant medium). Around 1 g of powder was added in 100 ml of ethanol to obtain a correct obscuration. The powders were analyzed before and after free fat extraction. Three measurements were conducted with each powder sample.
2.7. X-ray photolectron spectroscopy (XPS)
XPS provides elemental and chemical state data in solid samples. When the electron binding energy (Eb) is lower than the
photon energy (h
y
), the electron is emitted from the atom with a kinetic energy (Ek) equal to the difference between the photonenergy and the binding energy minus the spectrometer work function V (Briggs, 1994).
Ek ¼ h
y
! Eb!F
(1)XPS is performed in ultra high vacuum (10!8kPa), which may
limit the technique for liquid foods. Nevertheless, in the case of food powders it is not an inconvenient. The use of XPS was extended for the last 10 years to the surface composition of dairy powders.Fäldt (1995)was the first to develop a matrix formula to obtain the percentages of the different components (lactose, lipids and proteins) from the C, O and N atomic percentages. The elemental composition in the sample was assumed to be a linear combination of pure components forming the sample. The theo-retical matrices used to obtain the percentages in proteins, lactose, lipids and minerals were already developed by others (Gaiani et al., 2006).
The XPS analyses were carried out with a Kratos Axis Ultra (Kratos Analytical, Manchester, UK) photoelectron spectrometer.
The instrument uses a monochromatic Al K
a
X-ray source. The powder samples were attached to the sample holder with a double side conductive tape. There were then keep overnight under vacuum prior analyses. The analyzed area was currently about 700 $ 300m
m. Spectra were analyzed using the Vision software from Kratos (Vision 2.2.0). Quantification was performed using the photoemission cross-sections and the transmission coefficients given in the Vision package.2.8. Statistical analyses
Statistical analysis was carried out by using the software KyPlot version 2.0. The significance level was: ***P <0.001,**P <0.01, *P <0.05 andNSP >0.05.
3. Results and discussion
3.1. Milk fat fractions characterization 3.1.1. Quantification
Table 1 presents the fat fractions percentages obtained for SWMP and AWMP. The free fat was found higher for AWMP in comparison with SWMP. As already noticed by Vignolles et al. (2007), the porosity and the powder structure may influence the
Table 1
Percentages (g 100 g!1powder) of the three different fat fractions (total,
encapsu-lated and free fat) in whole milk powders.
Powdera Total fat Encapsulated fat Free fat
SWMP 23.7 % 0.1 21.7 % 2.5 2.1 % 0.3
AWMP 25.2 % 0.0 20.6 % 0.0 3.0 % 0.1
aSWMP: Standard Whole Milk Powder; AWMP: Agglomerated Whole Milk
Powder. Free fat Encapsulated fat Total fat -40 -30 -20 -10 0 10 20 30 40 50 Heat Flow exothermic ---> Temperature (˚C)
Fig. 1. DSC melting curves of three different fat fractions (free, encapsulated and total) in standard whole milk powder.
Free fat
Encapsulated fat
Total fat
-40 -30 -20 -10 0 10 20 30 40 50
Heat Flow Exothermic --->
Temperature (˚C)
Fig. 2. DSC melting curves of three different fat fractions (free, encapsulated and total) in agglomerated whole milk powder.
quantity of free fat. Furthermore, it was reasonable to find more surface fat for agglomerated powders certainly due to the structure of the agglomerate allowing a better penetration of the solvent in the matrix. The total of the free fat and the encapsulated fat was supposed to be equal to the total fat. It is the case for SWMP. However, a difference was observed for AWMP and could be attributed to the inexactitude of the methods (Buma, 1971). 3.1.2. Thermal properties
Thermal properties of the three precedent fat fractions were determined by DSC. The melting profiles of SWMP and AWMP are respectively presented inFigs. 1 and 2. Three endothermic peaks (1, 2 and 3) are observed with a typical melting behavior starting around !40"C and finishing at 40"C. These melting peaks (1, 2, 3)
may be related to low, intermediate and high melting fat on the basis of their melting points. The independent melting of these three fractions was assumed to be the reason for the three endo-thermic peaks in the heating curve of milk. This aspect was
supported byDeffense (1993)andKim et al. (2005a). Additional interpretations were developed byten Grotenhuis, van Aken, van Malssen, and Schenk (1999). Variable fat fractions (low, medium and high) and also variable polymorphic forms of fat were taken into account to explain the presence of these three melting peaks. Consequently, the first endothermic effect in the DSC curves (peak 1) could be explained by the melting of the first amount of
a
-crystals (mainly composed of low and intermediate meltingtriglycerides). This peak was only observed after cooling at high cooling rates (ten Grotenhuis et al., 1999). Around 7e8"C, a part of
the
a
-crystals transforms intob
0-crystals, which leads to the smallexothermic effect between peaks 1 and 2. The second endothermic peak (2) has a maximum around 15e16 "C and is the result of
further melting crystals of higher melting triglycerides (mainly in the
a
-form). The last peak (3) may be caused by meltingb
0-crystalsof high melting species. Because milk fat has many different triglycerides, they do not form pure crystals but tend to crystallize in groups of similar size and structure. So, it is not just the poly-morphic forms that are important but also the composition of these mixed crystals. Detailed data of melting and crystallization are summarized inTable 2for the three fractions and also for the two powders (agglomerated and standard). These observations are in agreement with Kim et al., (2005a) which observed a similar behavior in fractions of cream and whole milk powders. They explained the similarity of results by the fact that the thermal behavior may present differences only when important variations in the fatty acid composition occurred. For example, differences were observed after fragmentation of milk fat (Bhaskar, Rizvi, Bertoli, Fay, & Hug, 1998). The agglomeration process did not affect the thermal properties of the different fat fractions obtained from A and S powders.
3.1.3. Fatty acid composition
The three fat fractions were finally analyzed by GC to obtain the fatty acid profiles (Table 3). Milk fatty acids can be classified in short chains (4e8 carbon atoms), medium chains (10e12 carbon atoms) and long chains (14e18 carbon atoms). In addition, they can also be
Table 2
Temperature and enthalpy transition of crystallization and melting of variable milk fat fractions.
Powder Fat fraction Peaks temperature
("C)
Peaks area enthalpy (J g!1)
First Second Third
Crystallization SWMP Free 12.6 7.6 e 60.5 Encapsulated 14.9 7.6 e 67.9 Total 12.9 7.4 e 62.8 AWMP Free 14.3 5.9 e 63.1 Encapsulated 13.2 7.0 e 59.4 Total 13.0 7.9 e 63.6 Melting SWMP Free 5.3 15.5 32.2 !69.8 Encapsulated 4.9 15.7 32.1 !82.1 Total 5.5 16.1 31.4 !74.0 AWMP Free 0.2 16.6 30.4 !72.1 Encapsulated 3.4 15.2 29.5 !74.0 Total 6.8 16.6 32.6 !74.9 Table 3
Fatty acid composition determined by Gas Chromatography for standard and agglomerated whole milk powder.
Powder Fatty acid composition Total fat (area %) Encapsulated fat
(area %) Free fat (area %)
Standard Whole
Milk Powder C8C10 CaprylicCapric 1.1 % 0.03.7 % 0.8 1.1 % 0.03.6 % 1.8 3.4 % 0.11.3 % 0.1
C12 Lauric 3.4 % 0.2 3.2 % 0.0 4.5 % 0.1 C14 Mystiric 12.1 % 0.3 12.6 % 0.2 13.0 % 0.6 C15 Pentadecylic 0.4 % 0.0 0.4 % 0.0 0.5 % 0.1 C16 Palmitic 37.0 % 0.4 37.6 % 0.4 37.5 % 0.3 C16.1 Stearic 1.7 % 0.0 1.7 % 0.0 1.6 % 0.3 C17 Margaric 0.7 % 0.0 0.8 % 0.0 0.7 % 0.0 C18 Stearic 12.1 % 0.2 12.4 % 0.2 11.7 % 0.4 C18.1 Oleic 24.9 % 0.9 24.3 % 0.1 23.6 % 0.1 C18.2 Linoleic 2.4 % 0.4 1.7 % 0.0 1.9 % 0.3 C18.3 Lionlenic 0.6 % 0.0 0.5 % 0.0 0.4 % 0.0 Agglomerated Whole Milk Powder C8 Caprylic 5.2 % 0.7 5.1 % 3.0 6.8 % 3.5 C10 Capric 3.4 % 0.1 3.2 % 0.2 3.4 % 0.1 C12 Lauric 4.0 % 0.4 4.2 % 0.1 4.3 % 0.2 C14 Mystiric 12.2 % 0.3 12.8 % 0.5 12.9 % 0.5 C15 Pentadecylic 0.5 % 0.0 0.4 % 0.0 0.4 % 0.1 C16 Palmitic 34.5 % 0.5 35.2 % 1.2 34.8 % 1.2 C16.1 Stearic 1.5 % 0.1 1.5 % 0.0 1.5 % 0.1 C17 Margaric 0.9 % 0.1 0.8 % 0.0 0.8 % 0.1 C18 Stearic 11.9 % 0.9 12.9 % 1.6 11.7 % 0.5 C18.1 Oleic 22.6 % 0.2 21.2 % 1.0 20.8 % 0.9 C18.2 Linoleic 2.5 % 0.1 2.2 % 0.1 2.1 % 0.2 C18.3 Lionlenic 0.8 % 0.1 0.5 % 0.2 0.5 % 0.0
saturated and unsaturated. Whatever the powder size (agglomer-ated or standard), fatty acids with long chains (>14 carbons) were more present in the encapsulated fat fractions. Concurrently, fatty acids with short and medium chains (<14 carbons) were more present in the free fat fractions. Gray colors were used inTable 3to better visualize the differences. Even if the differences were small, there were repeatable and observable for each powder. Similar results were also obtained byKim et al. (2005a, 2005b)for whole milk powders. Nevertheless, they proposed a distribution of high melting fatty acid species at the surface of the particle, whereas the longer of the chain was not taken into account by these authors.
3.1.4. Milk fat fractions distribution within the particles
From quantification, thermal properties and composition of the fat fractions, the process of agglomeration did not affect the fatty acid distribution in the different fractions. Similar results were obtained for agglomerated and standard powders presenting the same chemical composition. But differences were observed between the fat fractions. From GC results, it may be possible that fatty acids with long chains were less prone to attain the surface of the particle at classical spray-drying temperatures resulting to the presence of more fatty acid with short chain at the surface (free fat) of the particles. Indeed, at classical spray-drying temperatures all
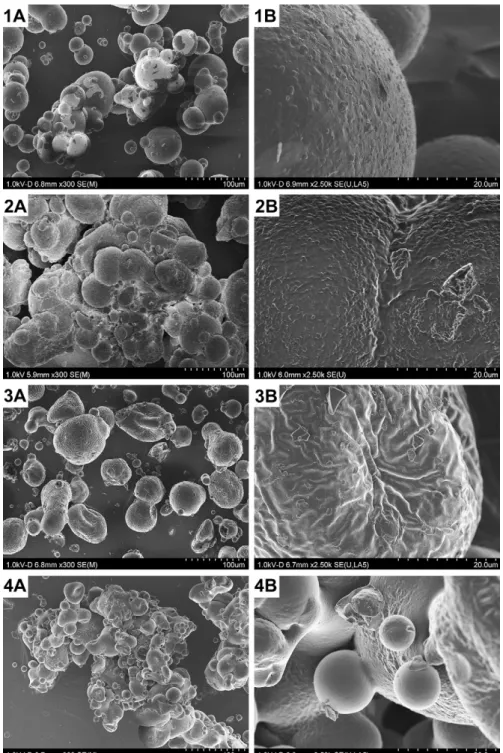
Fig. 3. Scanning Electron Microscopy of the four industrial powders (1: standard whole milk powder; 2: agglomerated whole milk powder; 3: standard skim milk powder; 4: agglomerated skim milk powder). Scale $300 (A) and $2500 (B).
the fat fractions are in a mobile fluid form (Nijdam & Langrish, 2006); the fusion of all the fat elements being obtain around 40"C (Jouppila & Roos, 1994; Kim et al., 2002). These observations
were also confirmed inFigs. 1 and 2; the totalities of the fractions being in a fluid form at temperatures higher than 40"C.
3.2. Powders size and shape characterizations 3.2.1. Microscopy
SEM observations of the four industrial powders were per-formed at two scales (Fig. 3). The differences between agglomer-ated and standard powders were very clear. Standard powders were spherical with individual particles whereas agglomerated powders presented agglomerates of spherical particles pasted ones with others. Surface differences were also observed between whole milk powders and skim milk powders. The first ones had a smooth and homogeneous surface, related to the presence of free fat at the surface (Vignolles et al., 2007). The seconds presented a more wrinkled or “brain surface”, related to a lactose-protein matrix with low fat (Gaiani et al., 2006; Kim et al., 2002; Nijdam & Langrish, 2006; Vega, Kim, Chen, & Roos, 2005). In addition, the drying temperature and the size of the droplet produced by the nozzle were also found responsible of the smooth or wrinkle aspect of the powders. Wrinkled particles were related to low temperatures and important droplet size whereas high temperatures and small droplets allowed a faster evaporation of water inducing a smoother surface (Hassan & Mumford, 1993; Walton, 2000). At the opposite, low temperatures as well as important droplets produced a slow evaporation of water and a slow conformation of skin. These conditions allowed the particle to deflate and shrivel (Hecht & King, 2000; Kim et al., 2009; Nijdam & Langrish, 2006).
3.2.2. Particles size
The sizes of all the powders were determined before and after free fat extraction. Examples of particle size profiles are presented for SWMP (Fig. 4A) and SSMP (Fig. 4B) before and after free fat extraction. Similar profiles were obtained for SSMP whereas a shift in the peak was observed for SWMP when comparing before and after free fat extraction. The shift was observed only for whole milk and may be logically attributed to the fat extraction. The totality of the results is summarized inTable 4under different diameters (d10,
d50and d90). After agglomeration, the ratio of size increased was
around 3 whatever the composition (skim or whole). As conse-quence, the size of the agglomerated powder was proportional to the size of the standard particles size. Comparison between particle size before and after free fat extraction shown that SWMP presents a significant size reduction after free fat extraction (from 125 to 116
m
m). A particle size decrease was also noticed for AWMP (from 360 to 245m
m). Logically, no significant differences were noticedfor SSMP (from 68 to 71
m
m), as there is no significant free fat extracted from this powder. Surprisingly, a difference was measured for ASMP (from 201 to 173m
m), whereas this powder did not contain surface fat. The differences observed for whole milk powders may be plausibly attributed to the free fat extraction. But the diameter decrease observed for ASMP may be explained only by an eventual particle breakage in ethanol. In addition, it can be clearly observed that the size distribution of whole milk powder was completely moved, confirming that the size of the particle has changed due to the free fat extraction (Fig. 4).3.3. Powders surface characterization
3.3.1. Surface atomic composition before free fat extraction
The surface elemental atomic composition (C, O, N and minerals) was determined by XPS and EDX. These determinations
were performed for skim milk powders (Table 5) and whole milk powders (Table 6). From the XPS results, it can be observed that the surface atomic composition of whole milk powders was only focused on C, N and O elements, indicating the absence of minerals. On the opposite, skim milk powders presented traces of minerals (K, Ca, Cl, S and P) in addition to C, O and N atoms. From the EDX results, minerals were detected at the surface of the four powders. Nevertheless, the percentages were still higher for SMP than WMP. The C, O and N percentages were also significantly different for the same powder between XPS and EDX measures. These differences may be explained by the difference of depth of the analyses. XPS
Fig. 4. Examples of particle size distribution obtained before and after free fat extraction for standard whole milk powder (A) and standard skim milk powder (B).
Table 4
Particle size distribution in skim milk and whole milk powder, each standard or agglomerated. For each powder, t-test comparisons between powders size before and after free fat were performed.
Powdera D
(v,0.10)mm D(v,0.50)mm D(v,0.90)mm
Before free fat extraction
SWMP 40.4 125.6 291.6
AWMP 123.6 360.2 674.6
SSMP 17.3 68.6 158.0
ASMP 74.7 201.1 439.4
After free fat extraction SWMP 39.4NS 116.64* 236.2** AWMP 123.9NS 245.42** 403.0** SSMP 20.4NS 71.39NS 149.4NS ASMP 77.3NS 173.98* 316.2* ***P <0.001. **P <0.01. *P <0.05 andNSP >0.05.
aSWMP: Standard Whole Milk Powder; AWMP: Agglomerated Whole Milk
Powder; SSMP: Standard Skim Milk Powder; ASMP: Agglomerated Skim Milk Powder.
measures were focalized at the first 5 nm whereas EDX measures were at the first micrometer. No significant differences were observed between agglomerated and standard powders presenting the same chemical composition.
3.3.2. Surface atomic composition after free fat extraction
Interesting results were also obtained from the surface of WMP after free fat extraction (Table 6). From XPS results, two minerals (K and Ca) appeared at the surface of WMP in addition to C, O and N elements. This observation suggested the presence of minerals just under the free fat layer. In addition, the percentage of carbon decreased whereas the percentages of oxygen and nitrogen significantly increased. These results are logical with a removing of fat (C decrease) and the apparition of proteins (N increase) and lactose (O/C increase). From EDX results, a new mineral appeared (Mg) after free fat extraction and all the others were present in higher quantities. Similar tendencies were observed for EDX and XPS when comparing the powders before and after free fat extraction. Again, no differences in atomic surface composition (from EDX and XPS) were observed between agglomerated and standard powders presenting the same chemical composition. 3.3.3. Surface composition in milk components before free fat extraction
With the theoretical matrix developed by others (Fäldt, 1995; Gaiani et al., 2006; Kim et al., 2005b; Millqvist-Fureby & Smith, 2007; Nijdam & Langrish, 2006), the percentages of surface proteins, lactose, fat and minerals were calculated and presented in Table 7for SMP andTable 8for WMP. The theoretical values used in
the matrix were obtained from the theoretical composition of lactose (C:50, O:50), proteins (C:65, O:19, N:16) and lipids (C:89.1, O:10.9). From XPS results, the surface of WMP was found largely covered by lipids (more than 90%). The surface of SMP presented proteins (around 40%), lactose (around 30%) and lipids. Neverthe-less, the latest were still largely over represented (around 20%). All these observations were already noticed by some authors (Gaiani et al., 2006; Kim et al., 2002; Nijdam & Langrish, 2006; Vega et al., 2005). From EDX results (by using the matrix used for XPS), the surface composition of WMP was found totally different (Table 8). Indeed, at 1
m
m depth, the surface of WMP presents around 14% of lactose instead of 0% at 5 nm depth. Lipids were still present but at a lower percentage and proteins percentage were significantly higher at 5 nm depth. For SMP, the differences between the first 5 nm and the first micrometer were less impor-tant (Table 7). Nevertheless, lactose and proteins were more present at the first 5 nm whereas lipids and minerals were more present just under. Up to now, any comparison with dairy powders was impossible due to lack of EDX data in this field. However, these EDX results were logical and in agreement with the observations done by XPS. Again, no evident differences in surface compositions were measured between agglomerated and standard powders. 3.3.4. Surface composition in milk components after free fat extractionInteresting complementary information was obtained from the analyses of WMP after free fat extraction (Table 8). From XPS results, proteins and lactose were more present at the surface of powder after free fat extraction. Lipids were still largely present but the percentage was lower. These results may be explained by the extraction of the lipid layer present at the surface and allowing the apparition of proteins and lactose. The minerals percentages were significantly higher after free fat extraction. By comparing the results of XPS and EDX before and after free fat extraction variables
Table 6
Atomic surface composition (wt %) obtained by XPS and EDX in standard and agglomerated whole milk powder before and after free fat extraction.
Atomic element Before free fat extraction After free fat extraction
XPS EDX XPS EDX
SWMP AWMP SWMP AWMP SWMP AWMP SWMP AWMP
C 87.4 % 1.8 86.8 % e 75.8 78 77.1 % 1.1 79.4 % 5.2 74.6 73.5 O 11.6 % 1.2 12.0 % e 18.2 17.1 19.9 % 0.6 18.7 % 4.3 17.4 18.2 N 1.0 % 0.6 1.2 % e 4.1 3.4 2.9 % 0.2 1.3 % 0.5 4.8 5 K e e 0.6 0.4 0.2 % e 0.5 % e 0.9 1 Ca e e 0.3 0.2 0.1 % e 0.4 % 0.0 0.6 0.5 Cl e e 0.3 0.3 e e 0.5 0.6 S e e 0.3 0.1 e e 0.2 0.2 P e e 0.3 0.3 e e 0.6 0.5 Na e e 0.1 0.2 e e 0.3 0.4 Mg e e e e e e 0.1 0.1
AWMP: Agglomerated Whole Milk Powder; SWMP: Standard Whole Milk Powder. Table 5
Atomic surface composition (wt %) obtained by XPS and EDX in standard and agglomerated skim milk powder.
Atomic element Before free fat extraction
XPS EDX SSMP ASMP SSMP ASMP C 65.1 % 0.5 65.1 % 0.5 71.7 70.7 O 26.5 % 0.3 26.5 % 0.3 20 21.2 N 7.2 % 0.1 7.2 % 0.1 5.5 4.7 K 0.5 % 0.4 0.5 % 0.4 0.7 0.9 Ca 0.2 % 0.0 0.2 % 0.0 0.5 0.5 Cl 0.2 % 0.2 0.2 % 0.2 0.5 0.6 S 0.1 % 0.0 0.1 % 0.0 0.6 0.5 P 0.1 % 0.0 0.1 % 0.0 0.1 0.2 Na e e 0.3 0.3 Mg e e 0.1 0.1 Al e e e 0.3
ASMP: Agglomerated Skim Milk Powder; SSMP: Standard Skim Milk Powder.
Table 7
Surface composition in components (proteins, lactose, lipids and minerals) obtained from the theoretical matrix first developed by Fäldt (1995)for standard and agglomerated skim milk powders before free fat extraction.
Component (%) Before free fat extraction
XPS EDX SSMP ASMP SSMP ASMP Proteins 45.1 39.3 34.4 29.4 Lactose 30.9 36.3 16.9 21.2 Lipids 22.8 23.2 45.9 46.0 Minerals 1.2 1.2 2.8 3.4
localization of lipids were noticed. Two localizations were also observed in the literature for dairy powders. The first one con-cerned lipids at the surface, easily removed by solvents and also called “free fat” (Kim et al., 2005b; Vignolles et al., 2007, 2009). The second one was located just under this layer and was not easy to remove. This fraction was called “inner fat” (Kim et al., 2005b). The combination of XPS and EDX with free fat extraction allows us to confirm these two localizations.
3.4. Gradients of composition in dairy powders
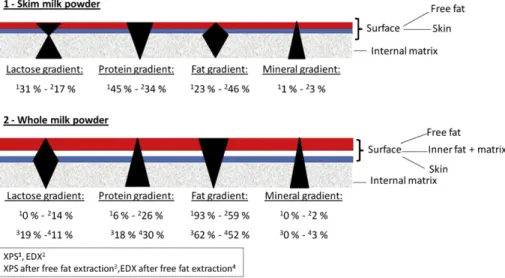
By coupling XPS and EDX, the particle surface was observed at two different levels, respectively the first 5 nm and the first micrometer. In addition, for WMP, surfaces comparisons before and after free fat extraction allowed the characterization of the particles at four different levels. These variable scales of observation permitted a better understanding on how the components were distributed from the surface to the bulk. From these results, two models (for SMP and WMP) were postulated and presented in Fig. 5.
For whole milk powder, the fat gradient decreased significantly from the first nanometers to the first micrometers. Furthermore, the same gradient was observed after free fat removing by solvent extraction. These results suggested a concentration of fat at the surface as already noticed by some authors (Gaiani et al., 2006, 2010; Kim et al., 2002, 2005a, 2005b; Vignolles et al., 2007). An opposite behavior was observed for proteins, a small quantity was found at the extreme surface getting more concentrated throughout the depth of the particle. The powder skin seems to be mainly composed by a matrix of lactose and protein. These
components were in higher quantities after free fat removing. Proteins were found more concentrated at core of the particle than at the level of the powder skin. For lactose, the concentration was almost inexistent at the extreme surface. A significant augmenta-tion after free fat extracaugmenta-tion appeared. Finally, after a deeper anal-ysis (EDX) a diminution of lactose was found. These results may be associated to the presence of the powder skin. From these obser-vations it was suggested that the powder skin was constituted by a higher lactose concentration in comparison with the particle core presenting a lactoseeproteinemineral matrix. Finally, a clear mineral gradient appeared from the surface to the core. A link also was observed between the mineral concentration and the order of apparition in the surface gradient. The milk composition in minerals (mg L!1) was details byFox and McSweeney (1998)as
follow: K (1400), Ca (1200), Cl (1000), P (950), Na (500), Mg (130) and S (100). Calcium and potassium were the first elements to appear at the surface after free fat extraction. As expected, these elements were the more abundant in milk. Then, from EDX results, Cl, P, S and Na were detected. These arrangements were still logical with the milk composition. The sulfur presence may be more related to the presence of proteins (whey proteins presenting sulfur) than the mineral element. Finally, Mg element was observed and was one of the less abundant minerals in milk. Interestingly, the order of apparition was also correlated with the mineral molecular weight (g mol!1) as follow: Ca (40), K (39), Cl (35.5), S
(32), P (31), Mg (24.7), Na (23). From these observations, the distribution of the components in the WMP may be resumed as:
(1) an important free fat layer present at the surface of the particle and removed by short-time treatment with solvent,
Table 8
Surface composition in components (proteins, lactose, lipids and minerals) obtained from the theoretical matrix first developed byFäldt (1995)for standard and agglomerated whole milk powders before and after free fat extraction.
Component (%) Before free fat extraction After free fat extraction
XPS EDX XPS EDX
SWMP AWMP SWMP AWMP SWMP AWMP SWMP AWMP
Protein 6.2 7.5 25.6 21.3 18.1 8.1 30.0 31.3
Lactose 0.5 1.3 13.9 11.9 19.3 18.4 11.3 13.1
Lipids 93.3 91.2 58.6 65.4 62.5 72.8 55.5 52.3
Minerals e e 1.9 1.4 0.1 0.7 3.3 3.3
AWMP: Agglomerated Whole Milk Powder; SWMP: Standard Whole Milk Powder.
(2) an inner fat layer present just under the free fat layer and removable after long-time treatment with solvent,
(3) a skin mainly composed by a matrix of lactose and proteins, (4) and finally a core matrix containing more proteins than lactose
and including minerals as well as deposits of globular fat. For skim milk powder, only two levels of composition were investigated, as free fat extractions were not possible for these powders. There is again evidence of components gradients. The protein content at the first 5 nm was more important than at the first micrometer. The same tendency was observed for the lactose gradient with an important decrease between these two depths of analysis. As observed by others (Kim et al., 2002; Millqvist-Fureby & Smith, 2007; Nijdam & Langrish, 2006; Vignolles et al., 2007), the presence of a skin (located just under the free fat layer) may explain these observations. This skin may present a higher lactose concentration in comparison with the matrix inside the particle. An opposite gradient was observed for fat. Indeed, the fat may be mostly located just under the powder skin. Even if the fat is still over represented at the surface, we postulated that the skin may be formed faster in these particles and that fat could not migrate in totality to the surface. Afterward, the fat may be localized just under the skin. Finally, a gradient in minerals was also remarked. The same distribution as observed for whole milk particles was noticed; supporting the theory that minerals may be distributed according to their composition in milk and/or the mineral molec-ular weight. From these observations, the distribution of the components in the SMP may be resumed as:
(1) a thin free fat layer at the surface (traces),
(2) a skin mainly made of lactose, proteins and minerals, (3) a fat layer just under the skin,
(4) and finally a core matrix containing proteins, lactose and including minerals as well as traces deposits of globular fat. Concerning agglomerated powders, it can be noticed that globally the gradients were similar for standard and agglomerated powders presenting the same chemical composition. Agglomerated powders are well known to shorten the wetting time of powders in comparison with standard (Gaiani, Schuck et al., 2007). From these results, it can be assumed that the reconstitution enhancement observed for agglomerated powder was not linked to a difference of powder surface composition and/or gradients. In agreement with Forny et al. (2011), the improved reconstitution properties of these powders may be more related to the presence of inter-particle pores available for capillary rise.
4. Conclusion
For the first time, a combination of new techniques (XPS, EDX, free fat extractions) was used to better understand the repartition of components from the surface to the bulk. Gradients were investigated by coupling original techniques allowing variable depths of investigation. An in-depth study is actually under development (with pure milk components) to validate the use of EDX in the field of dairy powders. Nevertheless, the EDX technique seems to be a powerful tool that can perfectly complement the XPS analysis, the latest being now well documented in the dairy powder field.
Concurrently, gradients in agglomerated powders in compar-ison with standard powders were investigated. It was found that the agglomeration process did not modify gradients for powders presenting the same chemical composition. Similar surface composition, surface gradients and fat fractions (composition, thermal properties) were observed.
Acknowledgments
ANR funding from program “Reactive Powder” are gratefully thanks. Aurelien Renard is thanks for XPS analyses and Christine Rolland is fully thanks for the EDX measurements. In addition, the first author acknowledges the Mexican National Council of Science and technology (Consejo Nacional de Ciencia y Tecnología, CON-ACYT) and the Complementary Scolarships of SEP in Mexico (Becas complemento SEP) for financial resources.
References
Bhaskar, A. R., Rizvi, S. S. H., Bertoli, C., Fay, L. B., & Hug, B. (1998). A comparison of physical and chemical properties of milk fat fractions obtained by two pro-cessing technologies. Journal of the American Oil Chemists’ Society, 75(10), 1249e1264.
Briggs, D. (1994) (2nd ed.). Practical surface analysis: Auger and x-ray photoelectron spectroscopy, Vol. 1Wiley-Blackwell.
Buma, T. (1971). Free fat in spray-dried whole milk. 10. A final report with a physical model for free-fat in spray-dried milk. Netherlands Milk and Dairy Journal, 25, 159e174.
Deffense, E. (1993). Milk fat fractionation today: a review. Journal of the American Oil Chemists’ Society, 70, 1193e1201.
Fäldt, P. (1995). Surface composition of spray dried emulsions. Lund, Sweden: Department of Food Engineering, Lund University.
Forny, L., Marabi, A., & Palzer, S. (2011). Wetting, disintegration and dissolution of agglomerated water soluble powders. Powder Technology, 206(1e2), 72e78. Fox, P. F., & McSweeney, P. L. H. (1998). Dairy chemistry and biochemistry. Springer. Gaiani, C., Ehrhardt, J., Scher, J., Hardy, J., Desobry, S., & Banon, S. (2006). Surface composition of dairy powders observed by x-ray photoelectron spectroscopy and effects on their rehydration properties. Colloids and Surfaces B: Biointerfaces, 49(1), 71e78.
Gaiani, C., Morand, M., Sanchez, C., Arab Tehrany, E., Jacquot, M., Schuck, P., et al. (2010). How surface composition of high milk proteins powders is influenced by spray-drying temperature. Colloids and Surfaces B: Biointerfaces, 75(1), 377e384.
Gaiani, C., Scher, J., Ehrhardt, J., Linder, M., Schuck, P., Desobry, S., et al. (2007). Relationships between dairy powder surface composition and wetting prop-erties during storage: importance of residual lipids. Journal of Agricultural and Food Chemistry, 55(16), 6561e6567.
Gaiani, C., Schuck, P., Scher, J., Desobry, S., & Banon, S. (2007). Dairy powder rehy-dration: influence of protein state, incorporation mode, and agglomeration. Journal of Dairy Science, 90(2), 570e581.
ten Grotenhuis, E., van Aken, G. A., van Malssen, K. F., & Schenk, H. (1999). Poly-morphism of milk fat studied by differential scanning calorimetry and real-time X-ray powder diffraction. Journal of the American Oil Chemists’ Society, 76(9), 1031e1039.
Hassan, H. M., & Mumford, C. J. (1993). Mechanisms of drying of skin forming materials. III. Droplets of natural products. Drying Technology: An International Journal, 11(7), 1765e1782.
Hecht, J. P., & King, C. J. (2000). Spray drying: influence of developing drop morphology on drying rates and retention of volatile substances. 2. Modeling. Industrial & Engineering Chemistry Research, 39(6), 1766e1774.
Huang, J., Yang, W., & Cao, L. (2010). Preparation of a SiC/Cristobalite-AlPO4 multi-layer protective coating on carbon/carbon composites and resultant oxidation kinetics and mechanism. Journal of Materials Science and Technology, 26(11), 1021e1026.
IDF. (1987). Dried milk, dried whey, dried butter-milk & dried butter-serums deter-mination of fat contents Röse-Gottlieb reference method. Brussels, Belgium, 9C: International Dairy Federation.
Jouppila, K., & Roos, Y. H. (1994). Glass transitions and crystallization in milk powders. Journal of Dairy Science, 77(10), 2907e2915.
Kim, E. H. J., Chen, X. D., & Pearce, D. (2002). Surface characterization of four industrial spray-dried dairy powders in relation to chemical composition, structure and wetting property. Colloids and Surfaces B: Biointerfaces, 26(3), 197e212.
Kim, E. H. J., Chen, X. D., & Pearce, D. (2005a). Melting characteristics of fat present on the surface of industrial spray-dried dairy powders. Colloids and Surfaces. B, Biointerfaces, 42(1), 1e8.
Kim, E. H. J., Chen, X. D., & Pearce, D. (2005b). Effect of surface composition on the flowability of industrial spray-dried dairy powders. Colloids and Surfaces B: Biointerfaces, 46(3), 182e187.
Kim, E. H. J., Chen, X. D., & Pearce, D. (2009). Surface composition of industrial spray-dried milk powders. 1. Development of surface composition during manufacture. Journal of Food Engineering, 94(2), 163e168.
Millqvist-Fureby, A., Elofsson, U., & Bergenståhl, B. (2001). Surface composition of spray-dried milk protein-stabilised emulsions in relation to pre-heat treatment of proteins. Colloids and Surfaces. B, Biointerfaces, 21(1e3), 47e58.
Millqvist-Fureby, A., & Smith, P. (2007). In-situ lecithination of dairy powders in spray-drying for confectionery applications. Food Hydrocolloids, 21(5e6), 920e927.
Mistry, V., Hassan, H. M., & Robinson, D. (1992). Effect of lactose and protein on the microstructure of dried milk. Food Structure, 11(1), 73e82.
Nijdam, J., & Langrish, T. (2006). The effect of surface composition on the functional properties of milk powders. Journal of Food Engineering, 77(4), 919e925. Thibert, R., & Hancock, B. (2001). The effects of milling upon the physicochemical
properties and functional behavior of some disintegrants. S.T.P. Pharma Sciences, 11(2), 123e128.
Vega, C., Kim, E. H. J., Chen, X. D., & Roos, Y. H. (2005). Solid-state characterization of spray-dried ice cream mixes. Colloids and Surfaces. B, Biointerfaces, 45(2), 66e75.
Vignolles, M., Jeantet, R., Lopez, C., & Schuck, P. (2007). Free fat, surface fat and dairy powders: interactions between process and product: a review. Le Lait, 87(3), 187e236.
Vignolles, M., Lopez, C., Ehrhardt, J., Lambert, J., Méjean, S., Jeantet, R., et al. (2009). Methods’ combination to investigate the suprastructure, composition and properties of fat in fat-filled dairy powders. Journal of Food Engineering, 94(2), 154e162.
Walton, D. E. (2000). The morphology of spray dried particles a qualitative view PB-Taylor & Francis. Drying Technology: An International Journal, 18(9), 1943.