HAL Id: hal-00507493
https://hal.archives-ouvertes.fr/hal-00507493
Submitted on 30 Jul 2010
HAL is a multi-disciplinary open access
archive for the deposit and dissemination of sci-entific research documents, whether they are pub-lished or not. The documents may come from teaching and research institutions in France or abroad, or from public or private research centers.
L’archive ouverte pluridisciplinaire HAL, est destinée au dépôt et à la diffusion de documents scientifiques de niveau recherche, publiés ou non, émanant des établissements d’enseignement et de recherche français ou étrangers, des laboratoires publics ou privés.
A new challenge for the energy efficiency evaluation
community: energy savings and emissions reductions
from urban transportation policies
Jean-Sébastien Broc, Bernard Bourges
To cite this version:
Jean-Sébastien Broc, Bernard Bourges. A new challenge for the energy efficiency evaluation commu-nity: energy savings and emissions reductions from urban transportation policies. Counting on Energy Programs - It’s why evaluation matters, Jun 2010, Paris, France. pp. 1-14. �hal-00507493�
A new challenge for the energy efficiency evaluation community: energy savings and
emissions reductions from urban transportation policies
Dr. Jean-Sébastien BROC, Pr. Bernard BOURGES, Ecole des Mines de Nantes, France
Abstract
The energy efficiency evaluation community has a large experience about programs for industries, residential and commercial sectors. But now the largest share of the energy consumption growth is due to the transportation sector. Moreover, as the stakes related to the transport sector are considerable, relying on separate actions for technological energy efficiency improvements will not be sufficient. Therefore transport policies now support the development of more integrated approaches. All together, this raises new evaluation issues.
This paper first looks at what makes or would make the transport sector specific and different from the other “usual” sectors, as far as the evaluation of energy savings and avoided CO2 emissions is concerned. This is illustrated by a comparison between two simple action types, a car replacement for the transport sector and a boiler replacement for the building sector. Then, taking into account the change toward more integrated action plans, the common evaluation methods used for energy efficiency programs and urban transport planning are discussed, to what extent they can be applied to evaluation of urban mobility plans.
Two interesting tracks stand out:
- developing new portfolio approaches starting from available bottom-up methods; - adapting methods used for transport infrastructure design or transport planning.
This emphasizes progress that could be achieved by crossing experiences from both scientific communities, evaluation of energy efficiency programs and transport planning.
Keywords
Transport, urban transportation policies, urban mobility plans, territorial approach.
Introduction
“The transport sector is the fastest growing consumer of energy and producer of greenhouse gases in
the European Union (EU), despite advances in transport technology and fuel formulation that have resulted in marked decreases in emissions of certain pollutants” (Eurostat, 2009). Indeed, the transport sector
represented in 2006 around 31.5% of the total final energy consumption of the EU271. Even more critical,
the transport sector is relying on fossil fuels at 98% (EEA, Rigler, & Kampel, 2007). This explains that it is the second biggest GHG emitters (after energy industries), representing around 25% of the total EU27 emissions. Again it holds the biggest growth, with a 26% increase of GHG emissions due to transports for the EU15 between 1990 and 2004.
1 EU-27 total final energy consumption: 1116 Mtoe in 2006, 1176 Mtoe in 1996
EU-27 transport final energy consumption: 371 Mtoe in 2006, 312 Mtoe in 1996
Share of the transport sector in the final energy consumption: 31.5 % in 2006, around 28 % in 1996 Source: http://epp.eurostat.ec.europa.eu/portal/page/portal/energy/data/main_tables
Still according to Eurostat and the European Environment Agency, within this sector, road transport is the largest energy consumer (83% in 2004) and CO2 emitter (93% in 2004). The energy consumption of road transport grew by 27% between 1990 and 2004. Finally, urban areas gathered 72% of the European population in 2007. And urban traffic causes around 40% of the CO2 emissions and 70% of the emissions of other pollutants due to the whole road transport (EC, 2009c).
Stakes related to energy and environmental impacts of urban traffic are therefore considerable. Policy measures to reduce these impacts were implemented, mainly by aiming at a reduction in vehicle kilometers and encouraging modal shift. Available experience feedback showed that even if successes have been achieved, their results will not be sufficient to limit the growth in car travel (Marshall & Banister, 2000). Indeed the challenges of significantly reducing these impacts will be very difficult to achieve. And the actions taken have been neither ambitious nor efficient enough, while the demand for transport is expected to keep growing (Banister, 2007).
Energy efficiency of cars in the EU-15 has improved by more than 9% between 1990 and 20042. But
this could have been even better, as part of the technical progress was offset by a trend to buy larger and more powerful cars. This trend has been changing recently (i.e. share of smaller cars increased) due to the rise in oil prices and the increasing number of countries applying specific taxes on new cars according to their energy consumption or CO2 emissions (Bosseboeuf et al., 2007). At the same time, “between 1995 and
2006 car ownership in the EU-27 increased by 26 %, and passenger-car use measured in passenger km increased by 18 %” (EEA, 2009). This explains the continuous growth of transport energy consumption, and
also supports the conclusion of the European Environment Agency (EEA, 2009): “fuel efficiency and
technology improvements are unlikely to develop at rates that offset this increase, making demand management an indispensable measure”.
The European Commission recently published an Action Plan on Urban Mobility, whose first theme of action is “promoting integrated policies”, especially “accelerating the take-up of sustainable urban
mobility plans” (EC, 2009a). Numerous cities have already implemented such approaches, on a voluntary or
mandatory basis. For example in France, since 1996, French Urban Mobility Plans (FUMP) are to be defined in urban areas over 100 000 inhabitants. These integrated approaches raise new evaluation issues which have not been addressed so far by the community used to evaluating energy efficiency programs. Indeed, the energy efficiency community is not familiar with the transport sector3. For example at the
European level, European policies on transport have been developed separately from the policies on energy. This is changing, as the National Energy Efficiency Plans (NEEAPs) required by the Energy Services Directive (ESD, 2006) should cover all sectors, transport included. However, the energy efficiency policies remain mostly focused on buildings and industries. “The majority of Member States have put a particular
emphasis on measures in residential buildings (…) A few NEEAPs indicate a leading role for transport sector measures in contributing to the savings target” (EC, 2009b).
In this paper, we first look at what makes or would make the transport sector specific and different from the other “usual” sectors, regarding the evaluation of energy savings and avoided CO2 emissions. This is illustrated by a comparison between two simple actions, a car replacement for the transport sector and a boiler replacement for the building sector. Then, taking into account the change toward more integrated action plans, the common evaluation methods used for energy efficiency programs and urban transport planning are discussed, to what extent they can be applied to evaluation of urban mobility plans. This
2 “Average specific consumption of the car stock decreased from 8.4 l/km to 7.6 l/km between 1990 and 2004”. This
improvement is mainly due to the European voluntary agreement with the three main car manufacturer’s associations (ACEA, JAMA, KAMA). (Bosseboeuf, Lapillonne, Eichhammer, & Boonekamp, 2007)
provides also insights on new evaluation issues to be addressed. Finally, first conclusions and perspectives considered in the French research project EvalPDU4 will be presented.
Comparing the transport sector with other sectors
General comparison of the main parameters influencing energy consumption
At a general level, the main inherent difference between transport and other end-use sectors is related to mobility, which can be expressed through a variety of indicators like the number of daily trips (see e.g., (J. -. Nicolas, Pochet, & Poimboeuf, 2003)). Likewise, in addition to the constraints shared with the other end-use sectors (e.g., costs, environmental impacts), another constraint strongly influences mobility: time (linked to distance and speed).
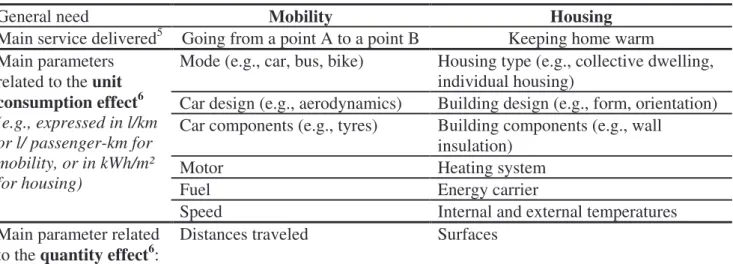
Going more into the details, parallels can be drawn between the main parameters explaining energy consumption, e.g. comparing urban mobility (transport sector) and housing (residential sector), as illustrated in Table 1 below.
Table 1. Comparison of the main parameters influencing energy consumption related to urban mobility and housing.
General need Mobility Housing
Main service delivered5 Going from a point A to a point B Keeping home warm
Mode (e.g., car, bus, bike) Housing type (e.g., collective dwelling, individual housing)
Car design (e.g., aerodynamics) Building design (e.g., form, orientation) Car components (e.g., tyres) Building components (e.g., wall
insulation)
Motor Heating system
Fuel Energy carrier
Main parameters related to the unit
consumption effect6
(e.g., expressed in l/km or l/ passenger-km for mobility, or in kWh/m² for housing)
Speed Internal and external temperatures
Main parameter related
to the quantity effect6: Distances traveled Surfaces
Most of these parameters can be monitored in similar ways for both, mobility and housing. However, while almost all housing parameters can be estimated only once (except for temperatures), at least two key mobility parameters need to be monitored over time (distance traveled and mode). Indeed, while the most influencing parameters for space heating are stock variables (with medium or long term trends), most of the main parameters for passenger transport are behavioral variables (with short term trends). The investment decision of a car or of a dwelling may be comparable. Similarly for the intensity of use, analogies may be found between speed and internal temperature. But at the opposite, modal choices and distances traveled are much more likely to vary than housing types and surfaces.
The trends for average surface per dwelling evolve slowly due to slow renewal rate of building stocks. Likewise, the distances related to home-to-work trips may be considered partly linked to long-term decision (e.g., home location). But distances related to leisure, shopping, etc. are linked to short-term and highly varying choices. And these distances represent an increasing share of the travel growth.
4 This project aims at developing an evaluation methodology to assess the environmental impacts (on air quality, energy
consumption, GHG emissions and noise) and their related socio-economical consequences (Mestayer et al., 2010).
5 Other services could be considered, but we chose to focus only on the main one here, to keep the comparison simple. 6 We use here « unit consumption effect » and « quantity effect » as defined in (Bosseboeuf, Chateau, & Lapillonne, 1997).
This explains also that reliable statistics are easier to find about housing parameters than about mobility parameters. Moreover, the differences between the building and transport sectors are strengthened by the distinct options of policy instruments. Short-term actions on dwelling surfaces or housing types are unlikely, while they are common on distances traveled and modal choices (e.g., congestion charge schemes, mobility management, parking fees).
Finally, evaluating energy savings for the transport sector often requires considering specific assumptions or scenarios. This is illustrated below by comparing simplified bottom-up calculations of gross energy savings for a boiler replacement and a car replacement. To keep the comparison simple, we only consider here energy efficiency improvements, i.e. we assume that the service delivered will remain the same except for changes due to possible rebound effects (but changes due to exogenous factors are not taken into account). Of course, this is very restrictive. The stakes ahead related to energy consumption and GHG emissions due to urban transport will require to go beyond the energy efficiency objectives, i.e. considering absolute (and not only relative) limitations in energy consumption and GHG emissions.
Comparison of gross7 energy savings calculations for boiler and car replacements8
Our analyses are structured as followed:
1. introducing the corresponding calculation formulas;
2. comparing the assessment of the unit consumption effect of both formulas; 3. same analysis for the quantity effect;
4. complementing these analyses by looking at how transport measures are dealt with in a typical evaluation system, a white certificates scheme.
Examples of calculation formulas:
- for boiler replacement, based on (Adnot, Bory, Bourges, & Broc, 2009):
A Rb E ) boiler new of efficiency 1 boiler replaced of efficiency 1 ( E i i i i i boilers= − × × × ∆ i
Equation 1, where Eboilers: energy savings from the boiler replacements for the evaluated program (in
kWh/year); i: index for dwelling i ; Ei: normalized9 heating need (in kWh/m²); Rbi: rebound effect10 (in %);
and Ai: heated area of the dwelling (in m²).
- for car replacement, based on (Böhler & Rudolph, 2009):
(
Fuelconsumption Fuelconsumption ) Rb ADT)
Ecars= replacedcar j− newcar j × j× j
∆
j
Equation 2, where Ecars: energy savings from the car replacements for the evaluated program (in l/year) ;
j: index for car j ; fuel consumption or car efficiency (in l/km) ; Rbj: rebound effect11 (in %); and ADTj:
annual distance traveled (in km/year).
7 In order to keep the comparison simple, we consider here gross energy savings, i.e. not taking account of possible free-rider or
spill-over effects, nor double counting issues.
8 Still to keep the comparison simple, we consider here only boiler (for space heating only) and motor efficiency improvements.
Other complementary improvements (e.g., on the heat distribution systems, efficient tires, etc.) are not considered here. Likewise, energy substitution (e.g., from fuel oil to electricity) is not considered neither.
9 “normalized” means here using the average annual Heating Degree Days, based on a reference period.
10 The rebound effect considered here is related to behavioral changes in the setting of the internal temperature. In order to keep
the comparison simple, the heating period and the possible use of intermittency (e.g., reduced internal temperature at night) are considered as constant.
11 The rebound effect considered here is related to behavioral changes in the annual distance traveled due to lower unit
consumption. In order to keep the comparison simple, the influence of oil prices is not taken into account, and the average number of passenger per car is considered constant.
For both above formulas, the bottom-up summation may be done either by directly adding the specific results for each individual dwelling/car, or (most frequent case) by using average values for consistent groups of dwellings/cars having the same characteristics (defining typologies).
Both formulas are similar. Evaluation of market transformations may be done using comparable approaches, as a boiler and a car are both products, with similar lifetime. Likewise, when required, the rebound effect12 could also be assessed by equivalent methods (i.e. mainly by surveys and/or monitoring) even if they apply to distinct types of parameter: mainly the internal temperature for space heating (i.e. related to unit consumption), and the distance traveled for mobility (i.e. related to activity). Nevertheless, the difficulties in assessing the other parameters create bigger differences between both cases.
Looking at the unit consumption effect. Considering seasonal boiler efficiency (in %) and unit fuel
consumption (in l/km), both require first laboratory tests and then on-site/on-road monitoring. Average normalized values are often defined once for a given boiler or car type. However, while for boilers, load variations due to changes in climatic conditions and behaviors13 can often be neglected, secondary parameters influencing the fuel consumption (speed profiles, “cold engine” share of distance traveled) may vary from one trip to another. Speed profiles change significantly according to the type of road used and to the trip timing (e.g., due to congestion rates). Likewise, the “cold engine” share of distance traveled will change significantly whether this distance is a sum of small trips (high share) or of long trips (small share)14.
If these parameters can be considered constant for daily “home-to-work” trips, this can not be assumed for “leisure” (or other purposes) trips which represent an increasing share of the urban mobility.
Moreover, while the unit fuel consumption directly include factors linked to car design and components, building design and components are taken into account in the heating needs, separately from boiler efficiency. Indeed, cars are mass products. The same car is bought by hundreds thousands of people. And once it is bought, its physical characteristics will not vary a lot from one owner to the other. At the contrary, buildings are much more diverse, even if buildings can be similar in certain neighborhoods. This is often addressed by defining building typologies. Actually, researchers are still working on this tough issue. As a conclusion on the assessment of unit consumption, heating needs can be considered constant over time (once corrected for climatic conditions), and the corresponding calculations can be standardized (see e.g., the Energy Performance Certificates as defined by (EPBD, 2002)). However the diversity of building designs requires research works on building typologies, and actions on existing buildings make that monitoring changes in the building characteristics is part of an energy savings evaluation. On the contrary, individual mobility needs are more difficult to define, and this may affect directly the assessment of the corresponding unit consumption. But as vehicles are mass products, their characteristics are easier to collect.
Looking at the quantity effect. As already mentioned, for a given dwelling, changes in the heated
area are rather unlikely. And this parameter can be more easily estimated than the distances traveled. Indeed, distances traveled may be influenced by changes in numerous factors: oil price (elasticity), road network, professional activities, leisure activities, etc. Therefore, while the “before and after replacement” situations are most often identical for housing, they may be significantly different for mobility. This latter case may then require considering several set of assumptions or scenarios. Indeed, Equation 2 above implicitly assumes that the distance traveled is only affected by an eventual rebound effect. This is relevant when the evaluation objective is to assess the energy efficiency improvement resulting from car replacements while considering the service delivered (here in terms of mobility) remains the same. If the evaluation objective
12 The definition of rebound effect may be controversial, and therefore its evaluation too. We consider here classical ways to
evaluate them (monitoring and surveys on samples). This would deserve more developments, but it is outside the scope of this paper.
13 Here behavioral effects are these related to intermittency. Rebound effect is considered separately. 14 The time between two consecutive trips is also of importance for this parameter.
were to assess the absolute energy savings resulting from transport policies, this would not be relevant anymore.
Case example of transport-related measures in White Certificates schemes. Usual evaluation
methods may be applied to certain types of energy efficiency measures for the transport sector. This is actually illustrated by the French White Certificates scheme, whose official list of standardized actions include the following actions on transport: purchase of a new intermodal transport unit (for rail-road transport), low rolling resistance tires for buses, eco-driving training for drivers of public buses or of other public vehicles, car-sharing for “home-to-work” trips15.
On the one hand, this proves that it was feasible for stakeholders to agree on standardized energy savings calculations for these types of action. On the other hand, this example illustrates also the difficulties to do so. First, this represents only 4 action types, when more than 180 action types were already officially published16. Second, these 4 action types are special cases, either where key parameters (distance, speed
profiles, efficiency gain) can be easily monitored or assessed (e.g., public buses as their trips are planned) or where former studies provided reliable statistics that can be complemented by specific easy-to-collect data (e.g., intermodal transport units as a study on corresponding distances and consumption was available and the number of trips can easily be registered). But in general, the impacts of energy efficiency measures in the transport sector are not well documented and mastered, as highlighted in (Rezessy, Bertoldi, Anable, & Jochem, 2009). Indeed, analyzing the potential of including transport measures in White Certificates scheme, they found that “the major expected barriers include high administrative cost especially for the first
country introducing it and introducing measurement and verification methodologies to capture actual energy saving and not only efficiency improvements”. So assessing energy savings from transport measures with similar approaches than for “usual” energy efficiency measures appears to be feasible, but it would require significant efforts and research works.
These conclusions apply when considering action types separately. As the current policy objectives are to support integrated approaches, it raises new situations to consider.
Evaluating Urban Mobility Plans: do old tools fit to new approaches?
Introducing the French Urban Mobility Plans
The French Urban Mobility Plans (FUMP) were first introduced by law in 1982 on a voluntary basis. They became mandatory in conurbations of over 100,000 inhabitants after the December 1996 law on air and rational energy use. While in the previous period, the main objective was to ensure mobility for all (i.e. making possible for everybody to get to places for work, shopping, leisure, culture, etc.), from 1996 the aim is still to answer to the mobility needs but also to minimize the corresponding impacts on health and the environment. Further laws complemented the FUMP targets, e.g., including objectives on transport safety, improving mobility for low income households and for disabled people.
The FUMP may include several types of actions. Initially the efforts were mainly focused on developing and improving the public transportation networks (e.g., tramway lines), as most FUMP aimed first at reducing the modal share of cars by increasing the use of public transport. More recently, other action types17 have received an increased interest, showing that the FUMP are now relying on more integrated
15 See http://www.developpement-durable.gouv.fr/Les-Fiches-d-operations.html for the current list of published action types. 16 Even if this is not only due to difficulties in agreeing on standardized calculations. The other explanation is that the main
target was to define standardized actions in the building sector.
17 For example, intermodality (e.g., connections between regional trains and urban buses, or parking facilities at tramway
terminals), parking conditions (e.g., pricing policies by sectors and user types) or mobility management (e.g., firm mobility plans to increase car sharing, etc.).
policies. As a matter of fact, evaluations on previous periods proved that developing new public transport lines alone was not sufficient to decrease the modal share of cars (Cour des Comptes, 2005).
FUMP are generally defined for a ten-year period. Most of the “1996-law generation” FUMP have been started in early 2000’s due to delays in policy process (e.g., public concerting, different levels of approval). Therefore, most of them have to be evaluated in the coming years. While their process evaluation can rely on available methods and experiences, their impact evaluation raises unsolved challenges, looking at air quality, energy consumption, GHG emissions, noise, and health. That’s why the French research project EvalPDU was launched in early 2009, involving a multidisciplinary team (Mestayer et al., 2010). Before presenting the preliminary conclusions on new evaluation questions, we review below common impact evaluation methods used for energy efficiency programs, and whether they can be applied to FUMP from a theoretical point of view.
Looking at top-down or statistical evaluation methods
Top-down methods are commonly used to monitor energy efficiency indicators such as unit consumption per car (e.g., in l/km). This has been done in Europe for almost 20 years through the ODYSSEE project (Bosseboeuf et al., 2007). The number of countries covered and the quality of the data collected have improved over time, making these indicators a reference used by Eurostat or more recently the IEA. These indicators provide overviews on energy efficiency trends. But they are more monitoring tools than evaluation tools, as they do not directly give insights on causality, i.e. links between these trends and the energy efficiency policies and programs implemented. Indeed, the ODYSSEE project includes also now the MURE database on policy measures18. Confronting trends and policy analysis make then possible
to evaluate these policies at a national level.
However, this approach can not be used at a more local level, as most of the corresponding data are not available e.g., at the conurbation scale. For example, energy consumption can be monitored reliably for public transportation (once the types of public transportation to include are defined). But energy consumption for cars is difficult to assess by top-down statistics. Gasoline sales could be registered for all filling stations for a given territory. However they would have to be corrected for transit trips, or more precisely for “transit gasoline sales”. This requires making assumptions for which data is hard to collect.
Another common option for statistical methods is to use energy bills. But such bills do not really exist for motor gasoline and would be complicated to reconstitute. Moreover, evaluating FUMP means to consider only trips done within a given territory. So even if gasoline bills could be monitored, they would have to be corrected for trips done outside this territory. And again, this would provide trends on energy consumption, but complementary analysis would be needed to explain possible causality between trends and actions.
As a conclusion, top-down or statistical methods could be used to evaluate FUMP at a national level, provided available statistics make possible to distinguish urban and non-urban trips. However the planning strategies and sets of actions vary significantly from one FUMP to another. So evaluating the FUMP globally at the national level would provide limited insights.
Looking at bottom-up or engineering evaluation methods
As mentioned earlier, the EMEEES project or the French White Certificates scheme provide examples of bottom-up (or engineering) methods to evaluate energy savings from transport measures. Other examples are available, e.g., the evaluation of the Dutch eco-driving program (Wilbers, Wismans, & Jansen, 2004). We already analyzed the possible limitations of these methods, by comparing evaluating energy
efficiency actions for housing and for mobility. These analyses looked at energy savings calculations for a given action type.
The perspective is different here, as the aim is to evaluate integrated approaches, combining various types of actions. Interactions are not only likely to occur, but actually expected. Therefore summing up results from distinct bottom-evaluations of each action type would require assessing these interactions, which are difficult to quantify. Even evaluating separately the specific results of a given action type would be complex, as these results will also most probably be influenced by other action types.
A solution could be to use a portfolio approach19, such as used for energy efficiency portfolios (see
e.g., (Hall & McCarthy, 2009; Kim, Pakenas, Ridge, Albert, & Jordan, 2007). Such evaluations do not look at indicators or results specific to a single program, but study the global impacts expected from the whole set of activities. However no experience of using such approaches for evaluating transportation urban policies is available. Maybe the closest examples would be the evaluations of congestion charge schemes in London and Stockholm (Eliasson, 2009; Evans, 2007).
Looking at surveys on urban mobility behaviors
Another option has been developed by INRETS20 for ADEME21, entitled BEED (Budget Energie
Environnement Déplacements, Environment Energy Budget of Trips). The starting point of this approach is to analyze trips at the individual level, i.e. characterizing each trip thought its mode (e.g., car), purpose (e.g., “home-to-work”), distance (estimated based on origin and destination locations), etc. Such analyses are possible from the household surveys on transportation22 done every ten years in the main French conurbations. The corresponding data are then used for the following treatments:
- analyses of the distinct modes used for a given trip; - calculations of distances traveled for each mode; - calculations of average speed;
- selection of trips done within the official territory of the FUMP (i.e. the territory for which the conurbation authority has the legal competency for public transportation).
Based on the survey, the BEED method then defines types of trips, related to the socio-economical characteristics of the households, homes and main activities’ locations, and trips’ purposes. The number of trips together with the corresponding distances, modal choices and average speeds are then extrapolated from the sample to the whole population of the conurbation, using the defined typology of households and trips.
The first objective of this method was to avoid a detailed traffic modeling (see next section), while taking account of the key factors influencing urban mobility. It does not aim at an exhaustive inventory of the energy consumption or CO2 emissions due to transportation on a given territory, but “its purpose is
rather to simulate the variations of energy and environmental impacts of the population mobility within a given urban area as a result of the global change in individual behavior” (Gallez, Hivert, & Polacchini, 1998). Indeed, the BEED method is primarily a tool for making diagnosis, i.e. analyzing what are the relative influences of the mobility factors. This can then be used ex-ante for policy design, e.g. identifying targets. But also ex-post for evaluation, by comparing two situations (e.g., at the beginning and the end of a
19 “Portfolio-level evaluations are structured to provide reliable results at the portfolio level. These studies sample and assess
savings at the portfolio level. This often reduces the evaluation budget and scope by treating the portfolio as if it were a single program” (Hall & McCarthy, 2009, p.473).
20 National Research Institute on Transports and their Safety, see www.inrets.fr 21 French Environment and Energy Management Agency, see www.ademe.fr
22 called in French Enquête Ménages Déplacements. The survey methodology was standardized at the national level by
CERTU (Centre for the Study of Urban Planning, Transport and Public Facilities). For more details, see
FUMP). This can provide interesting qualitative conclusions. For example, a significant share of the urban mobility is pre-determined by the locations of economic and residential activities, reminding the strong link between transportation and land planning (J. Nicolas & David, 2009).
However, due to the many assumptions required23, the BEED method can not provide accurate quantifications of energy savings or CO2 emissions avoided. An application of the method on the FUMP of the Saint-Etienne conurbation found that it tends to under-estimate the energy consumption and emissions (Broc & Bourges, 2009; Soleil, Gaboriaud, Noppe, & Vinot, 2002).
Looking at traffic modeling methods
The most usual approach, based on four-step modeling. Another more classical and more
sophisticated way of studying transportation programs is traffic modeling. The most common approach is the four-step travel forecasting procedure (see e.g., (Zhao & Kockelman, 2002)). The corresponding four steps are:
1) trip generation: why traveling? / reasons inducing trips (both, sources/origins and attractions/destinations);
2) trip distribution: where to go? / linking origins (dwellings, etc.) and destinations (work, shopping, etc.); 3) mode choice: how to go? / analyzing factors influencing the mode choice;
4) trip assignment: what route? / assigning each trip to the road network, considering different possibilities and constraints.
This general frame can be adapted according to different variants, especially using iterations between several steps (e.g., between step 3 and step 4). The process of these models is to estimate the number of trips for a given study area, using input data describing population, automobile ownership, economical and educational activities, road and public transportation networks, etc. Through the four steps, each trip is characterized by its origin and destination (building a trip matrix, steps 1 and 2), its mode (mode distribution, step 3) and its route (assignment, step 4).
The main output of these models is a representation of traffic flows for each section of the road network. The traffic conditions are assumed to be in permanent state during the time step used (e.g., hourly steps). The study area is divided in zones, taking into account various constraints (e.g., possible levels of desegregation for the required data, computation time, software limitations).
From infrastructure design to policy evaluation: new issues. The four-step travel forecasting
models were first developed for ex-ante evaluations of infrastructure projects (e.g., how many lanes should a new road have?). Therefore, they initially focused on traffic flows at peak times, as this is the main information needed to design the infrastructures. When evaluating energy savings and/or emissions reductions, traffic flows at peak times are not sufficient:
1) the model outputs should cover the whole year, i.e. the 24 hours of the day and not only the rush hours, plus for all day types (week, week-ends, holydays) and not only the typical week day;
2) in addition to traffic flows, the model outputs should also include speed profiles;
3) most often, traffic models only include trips between distinct zones, while all trips (including “internal” ones) are to be taken into account when assessing energy consumption and pollutants emissions.
Indeed, traffic models do not provide directly outputs on energy consumption and/or pollutants emissions. So these models are then coupled with models or add-in software specific to calculations of energy consumption and/or pollutants. As mentioned above, compared to the initial objective of infrastructure design, these “environmental” models require as inputs a more exhaustive description of the
23 For example, the distances traveled are calculated “as the crow flies” between the origin and destination places, not taking
into account the real journey. Likewise, the trips’ durations are based on respondents’ declarations, while these could be approximate. Default assumptions are also used to define the “cold engine” share of distance traveled.
trips, in terms of time and space coverage and in terms of traffic conditions (mainly speed profiles). These data are combined with energy consumption and emissions rates, varying according to speed parameters. Moreover, changing the modeling objectives from infrastructure design to policy evaluation also raises the issue how the policy measures are taken into account by the models. While it is clear that these models can integrate changes in road and public transportation network, it is much less obvious how they could include actions e.g., on intermodality, parking conditions or mobility management. This is of importance as these action types are increasingly used in the FUMP.
The last (but not the least at all!) issue is the definition of the baseline situation, or more generally of the situations whose comparisons will make possible to evaluate the policy measures. For an infrastructure project, this can be done easily: the number of options to be compared remains limited; and the span separating the before and after situations is short (therefore the eventuality of exogenous influences is small). At the opposite, a FUMP lasts ten years and include numerous actions, whose most of them could have be decided after considering several options. Consequently, it is necessary to analyze what scenarios are the most relevant for the evaluation/comparisons.
Looking at available case studies. In the early 2000’s, a first exploratory project used the approach
presented above to evaluate ex-ante the proposed FUMP of the Saint-Etienne conurbation (Soleil et al., 2002). One of the main general conclusions of this study is that the main positive effect on energy consumption and pollutants emissions comes from the improvement of the stock of cars, as new cars are more efficient than older ones and that over 10 years a large share of the stock is renewed. On the negative side, the policy measures considered are assessed not to be sufficient to compensate the increase in the distances traveled, mainly due to urban sprawl.
From a methodological point of view, this first study highlighted the difficulties and key points to be considered when using a four-step travel model to feed another model calculating energy consumption and pollutants emissions: making clear from the beginning how the “connection” between both models will operate (e.g., do the outputs provided by the former correspond to the inputs needed for the latter?), each assumption made or methodological choice has to be documented, involving all the key partners of the FUMP to improve the data collection, etc.
Sensitivity analyses were also performed (e.g., testing different ways of reconstituting the 24 hours from the peak hour). These emphasized how carefully the results should be considered, and also raised research questions to be further investigated (e.g., do the methodological/modeling choices have more influences on the results than the policy measures themselves?).
Finally, two issues were not really addressed in the Saint-Etienne case: the definition of the scenarios and the integration of the policy measures. The evaluation done compared the initial situation (as observed at the time of the study) with four possible future situations. But all these situations were described in very broad terms and no information is given how these situations were chosen/defined. Indeed, this study was limited to an impact evaluation and no theory-based evaluation seemed to be available. Likewise, very few details are given about how the effects of the policy measures considered are evaluated and integrated in the models.
Following this study, a research project developed a similar approach24 for the ex-ante evaluation of the FUMP of the Lille conurbation (Lagache et al., 2006). Its conclusions complement these of the Saint-Etienne study, mostly by going more into the details of the methodological and modeling choices. These highlighted issues like the difficulties to extrapolate the traffic flows of week-ends and holydays from these of week days, or to take into account special traffic conditions (e.g., with high congestion rate). Likewise, measurements of vehicle speed showed significant differences (from 20 to 100%) between observed and
24 Note: both studies (Saint-Etienne and Lille) had other objectives than the impact evaluation of the FUMP in terms of
energy consumption and pollutants emissions. In particular, they looked at the health impacts. But this is out of the scope of this paper.
simulated values. The main methodological results from this project were thus to analyze at a very detailed level the limitations of the modeling approach.
The comparisons were made using three situations (the initial one before the FUMP, and two “after” situations, one with and one without the measures planned for the FUMP). The measures of the FUMP are described in detailed terms, however, as for the Saint-Etienne study, the choice of the measures and situations is not explained. Again this is due to the research objectives.
The integration of the FUMP measures into the models was done by defining general assumptions representing the expected results, mainly through key mobility indicators (e.g., an increased use of the public transports from 0.3 trip/person/day to 0.6 trip/person/day). This implies that the effects of the measures are not evaluated by the models, but by preliminary studies. The Lille study being an ex-ante evaluation, the corresponding assumptions were mainly based on experts words, as very few relevant and reliable experience feedback is available to provide ex-ante values.
Conclusions on the possible use of traffic modeling for FUMP evaluations. The main advantages
of this approach are 1) to simulate the traffic flows, i.e. taking into account the interactions between the different effects of the measures and also with exogenous factors (e.g., demographic, economical); 2) to cover all the trips25 done within a given territory; 3) to provide a spatialized view of the results, e.g., taking into account possible effects on the spatial distributions of the trips, identifying “black” spots (this could be particularly interesting to better combine land and transport planning).
The main drawbacks of this approach are 1) the very large amount of data and complex modeling work required, which makes this kind of studies very costly; 2) the methodological and modeling limitations due to the distinct initial objectives of the models (infrastructure design).
Finally the analyses of the changes in the modeling objectives and of available feedback from previous studies highlighted the need to combine the modeling work with two other evaluation components: - definition of scenarios, making possible to give an account of both, 1) the endogenous differences between the observed or planned situations before and after the FUMP (i.e., adjusting the comparisons for exogenous factors); and 2) the main different options considered when selecting the FUMP strategy and measures (i.e. also comparing distinct “after” situations);
- preliminary evaluation of direct outputs of FUMP measures, in terms of effects on the key mobility indicators, and/or the integration of these measures (or directly of their effects) into the models.
Conclusions and perspectives
Even if sharing some common principles, comparing the evaluation of energy savings from policy measures in the building and transport sectors highlighted key differences, influencing what methods can be used. These main differences can be summarized as followed:
- while the service delivered can be defined in a standardized way for space heating, the case of mobility is much more complex as there are a bigger diversity in the mobility needs;
- while key parameters for space heating are mainly related to the building stock, these for mobility are mainly related to behaviors: therefore the corresponding trends are changing on a medium or even long term perspective for space heating vs. a short term perspective for mobility.
These differences emphasize first limitations in the use of “classical” evaluation methods for the case of policy measures in the transport sector: fewer reliable statistical data available, higher costs of data collection, increased number of assumptions required.
Then the development of integrated approaches (in designing policy strategies) raises additional evaluation issues, mainly linked to two questions:
- how to take account of the possible (and even expected) interactions between the distinct policy measures implemented on a given territory?
- how to assess the causality between the measures implemented and the changes observed?
After confronting to these issues the main available options for evaluating energy savings from French Urban Mobility Plans, two possibilities stand out:
- developing new portfolio approaches starting from available bottom-up methods and from the experience feedback of portfolio approaches in other sectors (mainly the building sector), or looking at experience feedback from the evaluation of congestion charge schemes;
- adapting methods used for transport infrastructure design or transport planning to new objectives of policy evaluations and energy savings assessments.
Indeed, these two approaches could be used in a complementary way:
- the portfolio approach could be used for the process evaluation, then applying predefined ratios for the impact assessments, providing rough but not too costly estimates of the results together with useful insights on the causality between measures and results;
- the traffic modeling approach could be used for detailed studies in order to improve the knowledge about quantitative impacts from typical sets of measures, and possibly to update the predefined ratios used in the portfolio approach.
As a general conclusion, these perspectives show the progress that could be achieved by crossing experiences from both scientific communities, evaluation of energy efficiency programs on the one hand and transport planning on the other hand.
Acknowledgements
This research work was possible thanks to the support of the ANR (French National Agency for Research), within the EvalPDU project. The authors wish to thank all the partners of this project for the rich discussions and exchanges. They also thank the reviewers for their useful comments.
References
Adnot, J., Bory, D., Bourges, B., & Broc, J.-S. (2009). EMEEES bottom-up case application 4:
Residential condensing boilers in space heating. Final report for the task 4.2 of the EMEEES project, with the support of the Intelligent Energy Europe programme, ARMINES.
Banister, D. (2007). Cities, mobility, and climate change. Journal of Industrial Ecology, 11(2), 7-10. Böhler, S., & Rudolph, F. (2009). EMEEES bottom-up case application 14: Vehicle energy efficiency.
Final report for the task 4.2 of the EMEEES project, with the support of the Intelligent Energy Europe programme, Wuppertal Instute for Climate, Environment, Energy.
Bosseboeuf, D., Chateau, B., & Lapillonne, B. (1997). Cross-country comparison on energy efficiency indicators: The on-going european effort towards a common methodology. Energy Policy, 25(7-9), 673-682.
Bosseboeuf, D., Lapillonne, B., Eichhammer, W., & Boonekamp, P. (2007). Evaluation of energy
efficiency in the EU-15 - indicators and measures. Paris, France: ADEME.
Broc, J.-S., & Bourges, B. (2009). Rapport méthodologique sur l'élaboration des scénarios de référence
L1.1 du projet EvalPDU, réalisé dans le cadre du programme ANR Villes Durables, Ecole des Mines de Nantes, GEPEA.
Cour des Comptes. (2005). Les transports publics urbains. Rapport au Président de la République. EC. (2009a). Action plan on urban mobility. Communication COM(2009)490 of the European
Commission
EC. (2009b). Moving forward together on saving energy - synthesis of the complete assessment of all 27
national energy efficiency action plans as required by directive 2006/32/EC on energy end-use efficiency and energy services. European Commission Staff Working Document, SEC(2009)889 EC. (2009c). A sustainable future for transport: Towards an integrated, technology-led and
user-friendly system. Communication (COM(2009)279) of the European Commission
EEA. (2009). Transport at a crossroads - TERM 2008: Indicators tracking transport and environment
in the european union. EEA Report N° 3/2009. Copenhaguen, Danemark: European Environment Agency.
EEA, Rigler, E., & Kampel, E. (2007). Transport emissions of greenhouse gases. European Environment Agency TERM 2006 02 Factsheet
Eliasson, J. (2009). A cost–benefit analysis of the stockholm congestion charging system.
Transportation Research Part A: Policy and Practice, 43(4), 468-480.
EPBD (2002). Directive 2002/91/EC of the European Parliament and of the Council of 16 December 2002 on Energy Performance of Buildings, (2002).
ESD (2006). Directive 2006/32/EC of the European Parliament and of the Council of 5 April 2006 on Energy End-use Efficiency and Energy Services and Repealing Council Directive 93/76/EEC, (2006).
Eurostat. (2009). Transport energy consumption and emissions. Retrieved March 5th, 2010, from
http://epp.eurostat.ec.europa.eu/statistics_explained/index.php/Transport_energy_consumption_and _emissions#Publications
Evans, R. (2007). Central London congestion charging scheme: Ex-post evaluation of the quantified
impacts of the original scheme. Paper prepared for the Congestion Charging Modelling and Evaluation Team, Transport for London website.
Gallez, C., Hivert, L., & Polacchini, A. (1998). Environment energy budget of trips (EEBT): A new approach to assess the environmental impacts of urban mobility. International Journal of Vehicle
Design, 20(1), 326-334.
Hall, N., & McCarthy, P. (2009). Portfolio evaluation versus program evaluation: Is there A balance? Proceedings of the 2009 IEPEC, Counting on Energy Programs: It's Why Evaluation Matters, Portland, OR. 471-481.
Kim, H., Pakenas, L., Ridge, R., Albert, S., & Jordan, G. (2007). An evaluation framework for a portfolio of research, development & demonstration programs. Proceedings of the 2007 IEPEC
Lagache, R., Declercq, C., Sportisse, B., Quélo, D., Quetelard, B., & Haziak, F. (2006). Évaluation de l'impact du plan de déplacements urbains de lille-métropole sur le trafic, les concentrations de polluants atmosphériques et la mortalité. 2ème Conférence Environnement & Transports, Reims. Marshall, S., & Banister, D. (2000). Travel reduction strategies: Intentions and outcomes.
Transportation Research Part A: Policy and Practice, 34(5), 321-338.
Mestayer, P., Abidi, A., André, M., Bocher, E., Bougnol, J., Bourges, B., et al. (2010). Urban mobility plan environmental impacts assessment: A methodology including socio-economic consequences. 10th Urban Environment Symposium, June 2010, Gothenburg, Sweden.
Nicolas, J. -., Pochet, P., & Poimboeuf, H. (2003). Towards sustainable mobility indicators: Application to the lyons conurbation. Transport Policy, 10(3), 197-208.
Nicolas, J., & David, D. (2009). Passenger transport and CO2 emissions: What does the french transport survey tell us? Atmospheric Environment, 43(5), 1015-1020.
Rezessy, S., Bertoldi, P., Anable, J., & Jochem, P. (2009). White certificates for the transport sector: An opportunity not taken? Proceedings of the 2009 ECEEE Summer Study Act! Innovate! Deliver! La Colle sur Loup, France, panel 6, paper 6.233, 1399-1408.
Soleil, L., Gaboriaud, L., Noppe, J., & Vinot, J. (2002). Évaluation de l'impact sur la qualité de l'air de
scénarios de déplacements urbains : Le cas de saint-etienne. Paris: rapport co-édité par le CERTU et l'ADEME.
Wilbers, P., Wismans, L., & Jansen, R. (2004). Monitoring and evaluation of an eco-driving programme. Proceedings of the 2004 European Conference on Transport, Strasbourg, France. Zhao, Y., & Kockelman, K. M. (2002). The propagation of uncertainty through travel demand models: