Science Arts & Métiers (SAM)
is an open access repository that collects the work of Arts et Métiers Institute of
Technology researchers and makes it freely available over the web where possible.
This is an author-deposited version published in: https://sam.ensam.eu
Handle ID: .http://hdl.handle.net/10985/18577
To cite this version :
Chang LIU, Kh LAFDI, Francisco CHINESTA - Durability sensor using low concentration carbon
nano additives - Composites Science and Technology - Vol. 195, p.1-8 - 2020
Any correspondence concerning this service should be sent to the repository
Administrator : [email protected]
Durability sensor using low concentration carbon nano additives
Chang Liu
a,*, Khalid Lafdi
a,b, Francisco Chinesta
caDepartment of Chemical and Materials Engineering, University of Dayton, 300 College Park Drive, Dayton, OH, 45469, USA bDepartment of Mechanical Engineering, Northumbria University, Newcastle upon Tyne, NE1 8ST, UK
cPIMM Laboratory, ENSAM ParisTech, 151 Boulevard de l’H^opital, F-75013, Paris, France
A R T I C L E I N F O
Keywords: Acid penetration CNT
Carbon black
Structural health monitoring Modeling
A B S T R A C T
In this paper, nanocomposite durability sensors were developed in order to detect the diffusion of chemicals in real-time. Polymer nanocomposite based sensors usually consist of conductive nano-additives such as CNT (carbon nanotube), graphene, carbon black, silver nanoparticles, etc. However, these nanocomposite sensors use a high content of nanomaterials to ensure good conductivity. In this study, a special approach for a chemical sensor with a low concentration (0.1 wt%-2 wt%) carbon nano-additive was carried out and tested in the 1[M] H3PO4 solution. Responding time and electrical resistance of each stage were analyzed against the
nano-addi-tives’ concentration. The sensing behavior is represented by the decrease of electrical resistance from 100 MΩ level to 100 Ω level. A numerical multi-stage model was developed to evaluate the formation of the conductive network and its sensing property. The modeling work shows two major parameters affect the sensing behavior: (1) The aspect ratio of conductive nano-additive. (2) Diffusion coefficient ratio of different ions in different phases.
1. Introduction
Structural health monitoring for composite based structures is one of the key elements in the composite design. Some composite parts are exposed to aggressive chemicals such as fuel, acid, alkaline solution, saline, and sewage [1–3]. Although these composite structures are designed to last for decades, it is important to monitor their health in real-time [4–6]. The swelling and hydrolysis of the matrix are two general results of this kind of exposure [7–9]. Swelling leads to defor-mation of structure and hydrolysis leads to direct failure. However, corrosive chemicals lead to bleaching of fiberglass reinforcement [8,10]. In order to avoid these degradations, an in situ embedded sensor is critical to monitor the diffusion of aggressive chemicals into the com-posite [4]. Currently, most sensors are made of metallic components. These sensors may work as a failure sensor or direct sensor that the sensor fails/activates upon the contact of the chemical. However, the compatibility between metal and polymer resin is not always good. In this case, we are looking for a non-metallic or polymer nanocomposite based sensor as an alternative sensing system.
Micro-damage in composites can propagate and develop into macroscopic cracks quickly [11,12] In order to avoid catastrophic fail-ures, the identification of micro-damage should be detected in the early
stage [13,14] The micro-damage is generally caused by stress concen-tration and materials’ degradation [15]. Structural health monitoring (SHM) methods used for crack and deformation detection, are based on electrical, acoustic and optical principles [16,17]. For example, elec-trical impedance tomography [5] and fiber Bragg grating sensors [18,
19]. Currently, studies on the effect of aggressive chemicals on com-posites are based on weight and volume measurement. In conjunction with Fickian diffusion modeling, this approach helps in understanding the diffusion mechanism [10]. However, these methods are not effective in terms of time, convenience and cost. The penetration of aggressive chemicals always changes the dielectric property of the polymer matrix [20,21] In this case, measuring the conductivity of the polymer matrix might be a promising method for monitoring the chemical penetration process.
Chemical attacks of composites by aggressive chemicals result in severe damage to polymer matrix and fibers, especially under hydro-thermal and stressed conditions [10,22]. For decades, stress corrosion cracking (SCC) has been one main focus in order to understand the interaction between chemicals and composites [8,23]. Using acid as an example, the penetration of acid occurs initially during the diffusion process. After the penetration of acid and water, hydrolysis of polymer matrix occurs. Consequently, the mechanical properties of the materials
* Corresponding author.
are altered. It is important to monitor the penetration of acid species in the composite. Current SCC studies are relying on post-testing methods, for example, weight measurement and volume measurement. These studies have shown that the Fickian diffusion theory can be applied in SCC and water diffusion problems [8,24]. However, in the case of the nanocomposite, the Fickian diffusion theory is not fully explored. Together with other issues, such as hydrolysis of matrix and bleaching of fibers, non-Fickian diffusion models were proposed [25]. Minelli et al. have suggested that the geometry and orientation of nano-additives would affect the diffusion process [26]. Usually, the use of nano-materials would increase the diffusion speed of attacking chemicals. However, many studies have shown that two-dimensional materials, such as nano-clay, graphene, and boron nitride, are excellent in slowing downing the diffusion process [27,28].
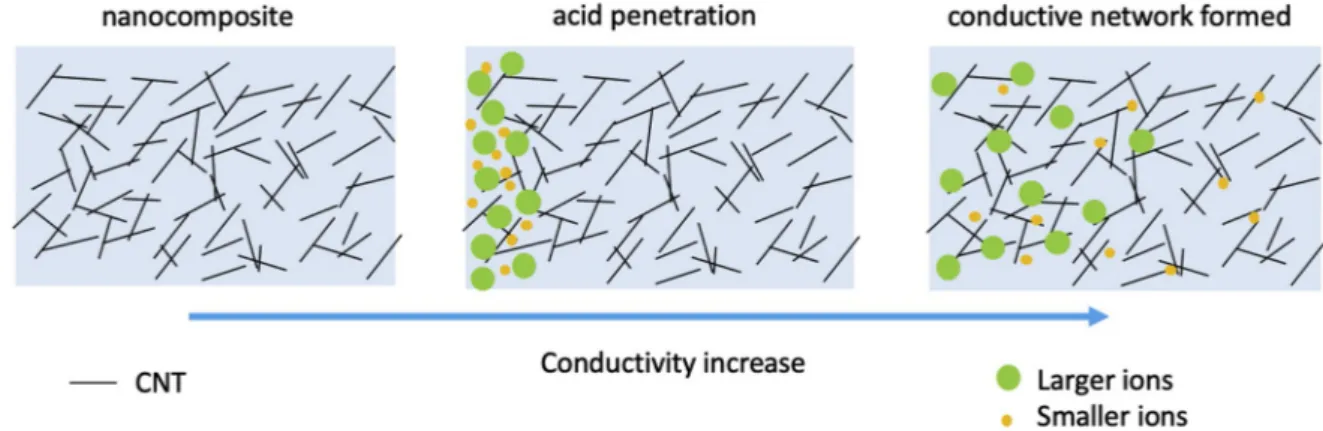
Our previous study shows that the dispersion of conductive nano- additives affects the physical property of Nanocomposite [29,30]. For that reason, a sensor using low concentration nano-additives was designed [20,21]. A standard and traditional conductive sensor rely on the formation of the conductive network [31]. However, the conductive network cannot be established with a few conductive nano-additives and the nanocomposite is basically insulating. However, with the chemical penetration process, the attacking ions become the bridging units for the network as shown in Fig. 1. As a result, the conductivity of nano-composite increases upon the penetration and which could be used as an indicator for monitoring of the penetration.
On the other hand, carbon black is mostly used carbon nanomaterials to construct a conductive nanocomposite. However, the formation of the carbon black based conductive network is not efficient compared to carbon nanotube (CNT). As a high aspect ratio material, CNT could form the conductive network in a very efficient way [30,32]. In this study, we have prepared CNT and carbon black based nanocomposite sensors and investigated the effect of nano-additives’ geometry on sensing behaviors.
2. Materials and methods
2.1. Materials and sample preparation
The CNT material (PR-25) was purchased from Pyrograf Products, Inc. The diameter of this CNT is about 150 nm and the length is up to 50
μm [33]. The diameter of carbon black (Vulcan XC 72R) is about 300
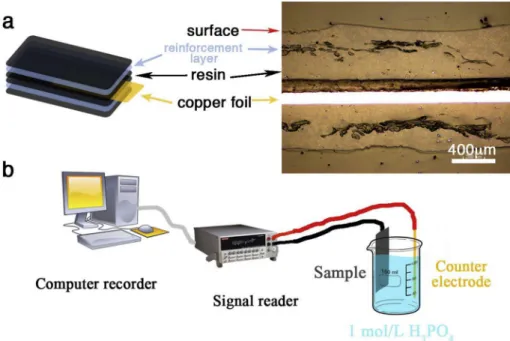
nm. The epoxy resin system consists of 100 parts of Epon 862 (epoxy) and 35 parts of Jeffamine D230 (hardener). The nanocomposite sensors were prepared with the following procedures: (1) mix a calculated amount of CNT with 20 g of epoxy and 2 g of acetone for 12 h; (2) add 7 g Jeffamine D230 into the mixture and mix for an additional 30 min; (3) cast the nanocomposite resin onto prepared non-woven fabric layer by layer as shown in Fig. 2a; (4) seal and cure the samples in a vacuum bag for 2 days. The use of non-woven fabric layer is aiming at keeping a
steady space between the electrode and the surface. In order to ensure the thickness of samples is about the same, all procedures are carefully controlled. Due to the difficulties in processing, the sensor with 5 wt% of CNT is not successfully prepared. The samples are noted by their con-centration and the nano-additive kind. For example, the nanocomposite with 0.5 wt% of carbon black is noted as 0.5CB, the nanocomposite with 1 wt% of CNT is noted as 1CNT.
2.2. Testing and characterization methods
Scanning Electron Microscope (SEM, ProX, Phenom) was used to study the morphology of raw material and prepared sensors. A Zeiss Vert. A1 optical microscope was used to characterize the polished cross- section of the sensor. X-ray diffractometer (XRD, Rigaku, Cu Kα, 40 kV,
44 mA, λ ¼ 1.5418 Å) was used to examine the crystallinity of CNT and carbon black. The sensing behavior testing setup is shown in Fig. 2b. The sensing system consists of an acid tank, a copper counter electrode, a multi-meter based signal recording system and the sensor. The testing acid solution was 1 mol/L H3PO4 for safety concerns. The electrical
resistance between the counter electrode and the sensor was recorded using the multimeter (model 2700, Keithley) (Fig. 2b). The recording intervals are chosen to be 0.1 s, 1 s and 5 s for different purposes. 0.1 s and 1 s intervals were used for determining the response time. The 5 s interval was used for recording the long period sensing behavior.
2.3. Modeling method
The modeling method is directly based on Fick’s second law equation
(1) ∂c
∂d¼De
∂2c
∂t2 1
where the c is the concentration of ion, t is the time, d is the distance between the calculation point to the surface of the nanocomposite sensor, De is the effective diffusion coefficient of ion or water in the nanocomposite. As a result, with a known effective diffusion coefficient, the relationship between the concentration c and time t could be established in a one-dimensional space as equation (2) shows:
c ¼ f ðt; dÞ 2
The Fricke-Hamilton-Crosser (FHC) model is used to integrate diffusion coefficients of different phases into a single value, the effective diffusion coefficient [34]. It assumes the dispersion of nano-additives is homogenous. The effective diffusion coefficient (De) for a
nano-composite system, which consists of part a and part b, can be expressed as:
De¼
xvaðϕ 1Þ þ ϕ þ x
vað1 ϕÞ þ ϕ þ x
Db 3
where v is the volume fraction of each content, Db is the diffusion
co-efficient of b phase, ϕ equals to Da/Db and x is a function of Da/Db. If the
additive is spherical, then the x ¼ 2. Here, the x can be expressed with an empirical relationship [34]: x ¼ 8 > > > > > > > < > > > > > > > : 3 ψ2 1 ðprolate ellipsoidÞ 3 ψ1:5 1 ðoblate ellipsoidÞ 3 ψ1 1 ðsphereÞ 4
The ψ, sphericity of a particle. is defined as the ratio of the surface
area of a volume equivalent sphere to that of the particle [34]. As a result, for CNT, the x can be expressed as:
x ¼ð6lÞ 3 2 2 ⋅ r13 r þ l 5
where the l is the length of CNT and r is the radius of CNT.
The concentration of ions determines the conductivity of nano-composite (σ). Here, we calculate the conductivity of each thin layer
(dx) since we treat the concentration of the ion in this layer (dx) as a constant. As a result, the relationship between the concentration of the ion and the conductivity of the material could be expressed as:
σ¼ Zx 0 f ðcÞdx ¼X x i¼0 ci 6
In this study, we assume the effect of different ions is independent of each other. For instance, Hþ, phosphoric ions and water molecules have
no interferences or synergic effects among each other. As a result, the overall conductivity is the sum of each:
σtotal¼
X
σ 7
The relationship between conductivity and electrical resistance of the material is defined as R ¼ L/σA, where L is the length of material and
A is the cross-section area. By combining the listed equations, the overall
electrical resistance of the nanocomposite could be expressed as:
Rtotal¼ 1 1 R1þ 1 R2þ⋯ þ 1 Rn ¼P11 f ðtÞ 8 The n represents the number of ions/molecules considered in the simulation. In this study, we took three ions/molecules into consideration.
3. Result and discussion
3.1. Materials and morphology
The CNT and carbon black raw materials were examined using SEM and the morphology of these materials are shown in Fig. 3a and b. The raw CNT is entangled due to its high aspect ratio. As a result, the soni-cation process is necessary for CNT to be well dispersed into the polymer matrix. Generally, the carbon black material used in this study has a diameter of 300 nm with spherical geometry. Fig. 3c shows the XRD result of these materials. The sharp (002) peak of CNT can be easily identified at 26.0�. Based on Bragg’s law, the layer inter-spacing d
(002) is
3.43 Å for CNT and 3.58 Å for carbon black. These values are found similar to other studies [35,36]. Considering the electronic conductivity of carbon nanomaterials is highly dependent on intra-layer transport, CNT has a higher conductivity than carbon black material. Both CNT and carbon black have high crystallinity which ensures their high con-ductivity. Fig. 3d shows an enlarged optical image of Fig. 2a. Due to its small size, the CNT cannot be seen clearly using an optical microscope. However, Fig. 3d clearly shows the CNT is well dispersed in the epoxy matrix where the brighter parts are CNTs and darker regions are the non-woven fibers.
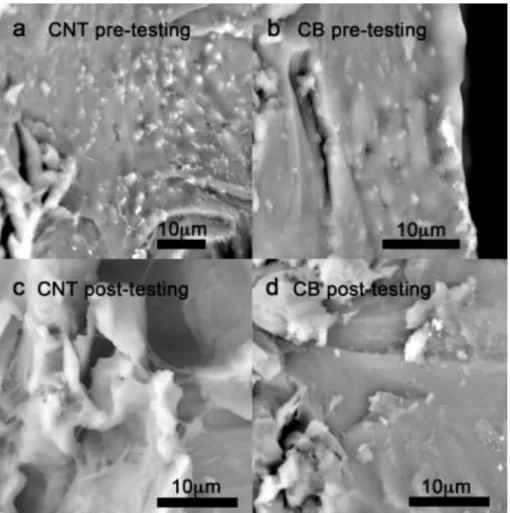
Fig. 4 shows the SEM images of sensor cross-sections. Both pre- testing and post-testing images for CNT and carbon black are pre-sented. CNT threads and carbon black bumps on the cross-section sur-face can be easily identified in the pre-testing images. However, the carbon black cannot be identified in the post-testing image and the CNT threads are pulled out from the cross-section surface. Both post-testing images show the cross-section becomes rougher, which suggests the epoxy becomes more plastic than it used to be. This could be explained by the degradation of epoxy upon the penetration of acid.
3.2. Sensing behavior
The sensing behavior of various carbon black and CNT samples was tested and recorded. Fig. 5 shows the sensing behavior of carbon black and CNT nanocomposite samples with different nano-additive concen-tration. The figures used a logarithmic scale for both time and electrical resistance axis.
Obviously, the sensing behavior of the carbon black base sensor differs depend on the nano-additive concentration. The resistivity of samples drops progressively through the testing period. Especially, the 0.1 wt% carbon black samples (0.1CB) show multiple stages in the electrical resistance-time curve. The first drop represents a typical ion diffusion induce electrical resistance to change. Our previous model matches this sensing behavior perfectly [20]. However, the previous model could not explain the multiple stages’ behavior very well. It was different from 0.5CB sample, with a higher concentration of CB, the sensing response became much faster. In this case, we had to use a logarithm x axial to illustrate the sensing behavior of 1CB, 2CB, and 5CB samples. In Fig. 5a, the sensing curves of 1CB were well distinguished from the 0.5CB curve. 0.5CB samples had a response time ranges from tens to hundreds of seconds. However, the response time is shorter for 1CB. On the other hand, the 2nd and 3rd stages in the sensing behavior of 0.1CB samples are more clear than other samples. This behavior in-dicates the addition of nano-additive affects the appearance of stages. Carbon black could be well dispersed into epoxy resin while CNT may be affected by entanglement and aggregation.
Fig. 5b shows the sensing behavior of CNT based nanocomposite. The addition of CNT changes the resistance-time curve dramatically compared to the 0.5CB sample. Almost all samples show an instant response. The multiple stages still could be found in some samples. Especially, for the 0.1CNT sample (the green curve), a short and smooth dropping curve could be found. This indicates that the conductive network is just formed or nearly formed in the 0.1CNT sample. Addi-tionally, based on our previous model which simulates the formation of
the conductive network in the nanocomposite, the percolation threshold for CNT nanocomposite was around 0.1 wt% to 0.5 wt%. At 0.1 wt%, the probability for the formation of the conductive network was 40%. At 0.5 wt%, the probability for the formation of the conductive network was 90%. In this case, it is reasonable that upon the attacking of ionic chemicals, the electrical resistance drops quickly as shown in Fig. 6. As a comparison, the sensing behavior of 1CNT and 2CNT was given as well. The sensing response was faster than 0.1CNT one.
Fig. 6 shows the statistical data for the sensing behavior of carbon black based nanocomposite. It’s easy to see the response time of carbon black based nanocomposite drops with a correlation of the amount of carbon black. However, the 3rd response time is in a close range. On the other hand, the electrical resistance of each stage is illustrated in Fig. 6b. Obviously, for different weight percentages of carbon black, the elec-trical resistance of each stage is almost the same. This interesting result is confirming our hypothesis that the ions are the main conductive media. Different ions/chemical species function at different stages. For example, the first stage may be induced by Hþ. The amount of Hþis
small and the diffusion speed is slow which results in a high electrical resistance in the stage. Later in stage two, the larger ions/chemical species such as water molecules are functioning. With the high through- volume of water and the quick water based proton path, the electrical resistance decreased a lot. In the third stage, due to the loosening of the crosslinked polymer network, larger ions (such as acid group ions: H2PO4, HPO42 and PO43 ) can pass through the matrix and result in the
final decreasing of the electrical resistance.
Currently, we have less idea on how to interpreter the results for the CNT based nanocomposite. One hypothesis is that once the amount of CNT reaches 0.5 wt%, the effect of diffusion will be overlapped by the high conductivity of CNT. In this case, the amount of CNT affects the final electrical resistance more apparently. However, the final electrical resistance is affected by the thickness and dispersion quality a lot. As a result, the result in Fig. 5b is hard to be interpreted.
Fig. 3. (a) SEM image of the CNT. (b) SEM image of the carbon black. (c) XRD results for CNT and carbon black. (d) Optical image of the CNT based nanocomposite’s
3.3. Modeling result
We obtained an analytical solution from our previous modeling work [20]. However, the analytical approach led to a less flexible model. In this model, we solved the Fick’s second law numerically from the very beginning. Illustrated in Fig. 7, the resistance curve is flatter with a lower diffusion coefficient value. Based on some similar assumptions, we obtained reasonable results. For example, in order to avoid a time-consuming model, we assumed the diffusion coefficient was con-stant. Although the ions may only diffuse through the nano-additive
surface rather than the volume, a simple diffusion value was given for each kind of material. With the diffusion of acid species, the epoxy resin will degrade over time. From a microscopic point of view, the cross-linked polymer chains are broken slowly which leads to a higher free volume of the polymer. The cross-linked polymer chains could also be considered as nano sieves. With broken polymer chains, the sieve holes become larger. As a result, the diffusion speed of larger ions is dependent on polymer degradation. At different penetration depths of the polymer, the diffusion speed is different. However, currently, there is no such a model could take the degradation of polymer into
Fig. 4. A typical SEM cross-section images of (a, b) pre-treated and (c,d) post-treated (a, c) CNT and (b,d) carbon black (CB) sensors.
consideration due to the unknown degradation degree and how does it affect the diffusion. In this case, we consider the diffusion of three different ion species is independent of each other.
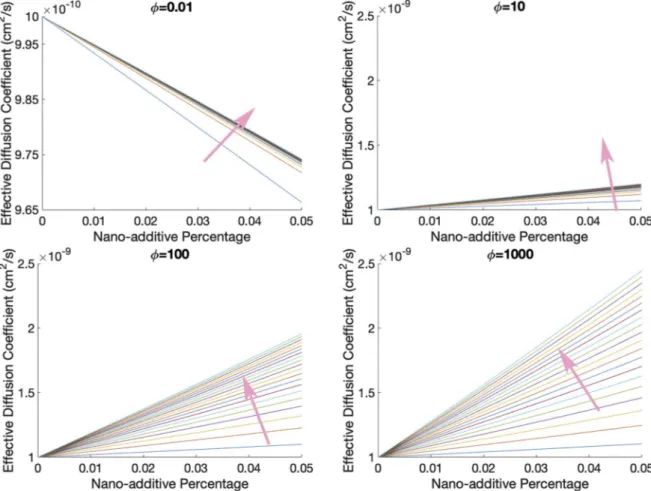
Based on the FHC model, we investigated the effect of nano-additive concentration, nano-additive aspect ratio, diffusion coefficient ratio between different phases (φ) (Fig. 8). Normally, higher nano-additive concentration leads to a higher effective diffusion coefficient. Howev-er, when the diffusion coefficient ratio φ is less than 1, the addition of nano-additive leads to a smaller effective diffusion coefficient. In other words, when the additive becomes an obstacle factor for the diffusion, the more additive results in slower diffusion behavior. In practice, as an example of Fig. 8a, graphene and hexagonal boron nitride nano-sheets are studied as an effective additive for reducing gas and moisture permeability in polymers [37–39].
The aspect ratio of nano-additive is another controlling parameter. In
this model, the aspect ratio ranges from 200 to 40,000 with an increment of 1000. The increment is shown as the arrows pointed in Fig. 8. The effect of increment of aspect ratio is more significant when the aspect ratio has a smaller value. This result indicates the change from carbon black to CNT is more significant than increase the length of CNT for their effect on the effective diffusion coefficient. However, based on the previous study, a longer CNT could increase the probability to form the conductive network [30]. The sensing could be promoted by the longer CNT. As a result, a balance between CNT’s length, sensing property, mechanical property, and processing property has to be compromised.
The effect of different parameters shown in Fig. 8 is only affecting the effective diffusion coefficient. The diffusion model is further controlled by the Fickian diffusion model. As we assumed the three species have independent diffusion effects, based on equation (8), the result of overall sensing behavior is illustrated in Fig. 9b. Fig. 9a shows three typical sensing behavior curves for pristine epoxy resin based sensors, CNT and carbon black based nanocomposite sensors. Obviously, this model could present the multiple stages’ curve. However, the curve shape for the 2nd and 3rd transition region is far more complex than the ideal Fickian diffusion behavior. For instance, the diffusion dependency of different ions/chemicals is unrevealed. A far more sophisticated experiment/ theory should be developed to investigate the ion/molecule diffusion dependency issue.
4. Conclusion
In this study, low concentration additives were used for the fabri-cation of nanocomposite sensors. Carbon black and CNT were used as conductive additives to form the conductive network in the nano-composites. At low concentrations, the nanocomposites were not well conductive. However, with the penetration of ions, the resistance of nanocomposite drops and this change could be easily detected. The detected sensing behavior of nanocomposite was also confirmed by the modeling work. The modeling work shows two major parameters that affect the sensing behavior: (1) The aspect ratio of conductive nano- additive. (2) Diffusion coefficient ratio of different ions in different phases.
Practically, a tiny and thin nanocomposite sensor, which showed in this paper, is not necessarily to be included in the sensing system. The conductive network can be built with an in situ process during the manufacturing of composite structures. Apparently, we want and need to have a sensing system with the highest sensitivity. This definitely will increase manufacturing and instrumentation costs. However, the tracking of penetration seems not necessary for monitoring the health of the composite structure. As a result, manufacturing complexity decrease
Fig. 6. Response time (a) and electrical resistance of value of each stage (b) for the carbon black based nanocomposite.
Fig. 7. The effect of the effective diffusion coefficient (De) of attacking
chem-icals on the electrical response (Adapted with permission [20]. Copyright 2017, Elsevier.).
dramatically. The instrumentation cost may be reduced further by lowering the signaling dimension and resolution.
This work was focused on carbon black and CNT. However, the current model could explain why the graphene and boron nitride nanosheet materials could be a good candidate for moisture barrier nanocomposite. This work had explored a new sensing strategy for the diffusion of chemicals in the composite structure. In order to endow the structure of the self-sensing ability, conductive nanofillers such as car-bon black, CNT are favorable. CNT based nanocomposite showed very high detection sensitivity.
Declaration of competing interest
The authors declare that they have no known competing financial interests or personal relationships that could have appeared to influence the work reported in this paper.
CRediT authorship contribution statement
Chang Liu: Methodology, Investigation, Data curation, Formal
analysis, Writing - original draft, Writing - review & editing. Khalid
Lafdi: Supervision, Methodology, Writing - review & editing. Francisco Fig. 8. The effect of the nano-additive aspect ratio and diffusion coefficient ratio. The arrow shows the increment of the additive’s aspect ratio from 200 to 40,000
with an interval of 2000. The φ is the ratio of the diffusion coefficients of a species in different phases.
Chinesta: Methodology.
Appendix A. Supplementary data
Supplementary data to this article can be found online at https://doi. org/10.1016/j.compscitech.2020.108200.
References
[1] V. Fiore, L. Calabrese, E. Proverbio, R. Passari, A. Valenza, Salt spray fog ageing of hybrid composite/metal rivet joints for automotive applications, Compos. B Eng. 108 (2017) 65–74.
[2] M. Lindgren, M. Wallin, M. Kakkonen, O. Saarela, J. Vuorinen, The influence of high-temperature sulfuric acid solution ageing on the properties of laminated vinyl-ester joints, Int. J. Adhesion Adhes. 68 (2016) 298–304.
[3] P.-C. Ma, Y. Zhang, Perspectives of carbon nanotubes/polymer nanocomposites for wind blade materials, Renew. Sustain. Energy Rev. 30 (2014) 651–660. [4] T. Gotou, M. Noda, T. Tomiyama, H. Sembokuya, M. Kubouchi, K. Tsuda, In situ
health monitoring of corrosion resistant polymers exposed to alkaline solutions using pH indicators, Sensor. Actuator. B Chem. 119 (1) (2006) 27–32. [5] R. Rashetnia, M. Hallaji, D. Smyl, A. Sepp€anen, M. Pour-Ghaz, Detection and
localization of changes in two-dimensional temperature distributions by electrical resistance tomography, Smart Mater. Struct. 26 (11) (2017) 115021.
[6] A. Sepp€anen, M. Hallaji, M. Pour-Ghaz, A functionally layered sensing skin for the detection of corrosive elements and cracking, Struct. Health Monit.: Int. J. 16 (2) (2016) 215–224.
[7] S.G. Prolongo, M.R. Gude, A. Ure~na, Water uptake of epoxy composites reinforced with carbon nanofillers, Compos. Appl. Sci. Manuf. 43 (12) (2012) 2169–2175. [8] E. Solis-Ramos, M. Kumosa, Synergistic effects in stress corrosion cracking of glass
reinforced polymer composites, Polym. Degrad. Stabil. 136 (2017) 146–157. [9] T. Lu, E. Solis-Ramos, Y.B. Yi, M. Kumosa, Particle removal mechanisms in
synergistic aging of polymers and glass reinforced polymer composites under combined UV and water, Compos. Sci. Technol. 153 (2017) 273–281.
[10] J.D. Tanks, Y. Arao, M. Kubouchi, Diffusion kinetics, swelling, and degradation of corrosion-resistant C-glass/epoxy woven composites in harsh environments, Compos. Struct. 202 (2018) 686–694.
[11] H. Zhou, C. Li, L. Zhang, B. Crawford, A.S. Milani, F.K. Ko, Micro-XCT analysis of damage mechanisms in 3D circular braided composite tubes under transverse impact, Compos. Sci. Technol. 155 (2018) 91–99.
[12] J.A. Glud, P.A. Carraro, M. Quaresimin, J.M. Dulieu-Barton, O.T. Thomsen, L.C. T. Overgaard, A damage-based model for mixed-mode crack propagation in composite laminates, Compos. Appl. Sci. Manuf. 107 (2018) 421–431. [13] D. Luder, S. Ariely, M. Yalin, Stress corrosion cracking and brittle failure in a fiber-
reinforced plastic (FRP) insulator from a 400 kV transmission line in humid environment, Eng. Fail. Anal. 95 (2019) 206–213.
[14] M. Kusano, T. Kanai, Y. Arao, M. Kubouchi, Degradation behavior and lifetime estimation of fiber reinforced plastics tanks for hydrochloric acid storage, Eng. Fail. Anal. 79 (2017) 971–979.
[15] M. Naebe, M.M. Abolhasani, H. Khayyam, A. Amini, B. Fox, Crack damage in polymers and composites: a review, Polym. Rev. 56 (1) (2016) 31–69. [16] G. Wang, Y. Wang, P. Zhang, Y. Zhai, Y. Luo, L. Li, et al., Structure dependent
properties of carbon nanomaterials enabled fiber sensors for in situ monitoring of composites, Compos. Struct. 195 (2018) 36–44.
[17] C. Tuloup, W. Harizi, Z. Aboura, Y. Meyer, K. Khellil, R. Lachat, On the use of in- situ piezoelectric sensors for the manufacturing and structural health monitoring of polymer-matrix composites: a literature review, Compos. Struct. 215 (2019) 127–149.
[18] M. Todd, W. Gregory, C. Key, M. Yeager, J. Ye, Composite Laminate Fatigue Damage Detection and Prognosis Using Embedded Fiber Bragg Gratings, 2018, p. V002T05A11.
[19] Z. Tian, L. Yu, X. Sun, B. Lin, Damage localization with fiber Bragg grating Lamb wave sensing through adaptive phased array imaging, Struct. Health Monit. 18 (1) (2018) 334–344.
[20] C. Liu, I. Sergeichev, I. Akhatov, K. Lafdi, CNT and polyaniline based sensors for the detection of acid penetration in polymer composite, Compos. Sci. Technol. 159 (2018) 111–118.
[21] C. Liu, K. Lafdi, Environmental monitoring of composite durability use multiple sensing technologies, in: Proceedings of CAMX 2018 – the Composites and Advanced Materials Expo. Dallas, Conference, Conference, 2018. TP18-0586. [22] M.S. Saharudin, R. Atif, I. Shyha, F. Inam, The degradation of mechanical
properties in polymer nano-composites exposed to liquid media – a review, RSC Adv. 6 (2) (2016) 1076–1089.
[23] M. Megel, L. Kumosa, T. Ely, D. Armentrout, M. Kumosa, Initiation of stress- corrosion cracking in unidirectional glass/polymer composite materials, Compos. Sci. Technol. 61 (2) (2001) 231–246.
[24] O. Starkova, S.T. Buschhorn, E. Mannov, K. Schulte, A. Aniskevich, Water transport in epoxy/MWCNT composites, Eur. Polym. J. 49 (8) (2013) 2138–2148. [25] R. Brethous, X. Colin, B. Fayolle, M. Gervais, Non-Fickian Behavior of Water
Absorption in an Epoxy-Amidoamine Network, vol. 1736, 2016, 020070. [26] M. Minelli, M.G. Baschetti, F. Doghieri, Analysis of modeling results for barrier
properties in ordered nanocomposite systems, J. Membr. Sci. 327 (1–2) (2009) 208–215.
[27] X. Li, P. Bandyopadhyay, T. Kshetri, N.H. Kim, J.H. Lee, Novel hydroxylated boron nitride functionalized p-phenylenediamine-grafted graphene: an excellent filler for enhancing the barrier properties of polyurethane, J. Mater. Chem. 6 (43) (2018) 21501–21515.
[28] S. Peretz Damari, L. Cullari, R. Nadiv, Y. Nir, D. Laredo, J. Grunlan, et al., Graphene-induced enhancement of water vapor barrier in polymer nanocomposites, Compos. B Eng. 134 (2018) 218–224.
[29] S.M.N. Al-Ajrash, K. Lafdi, E.S. Vasquez, F. Chinesta, P. Le Coustumer, Experimental and numerical investigation of the silicon particle distribution in electrospun nanofibers, Langmuir 34 (24) (2018) 7147–7152.
[30] N. Al Habis, C. Liu, J.-B. Dumuids, K. Lafdi, Intelligent design of conducting network in polymers using numerical and experimental approaches, RSC Adv. 6 (97) (2016) 95010–95020.
[31] C. Liu, K. Lafdi, Self-assembly and surface tension induced fractal conductive network in ternary polymer system, ACS Appl. Polymer Mater. 1 (3) (2019) 493–499.
[32] C. Liu, Q. Fang, D. Wang, C. Yan, F. Liu, N. Wang, et al., Carbon and Boron Nitride Nanotubes: Structure, Property and Fabrication, ES Materials & Manufacturing, 2019.
[33] L. Guadagno, M. Raimondo, V. Vittoria, L. Vertuccio, K. Lafdi, B. De Vivo, et al., The role of carbon nanofiber defects on the electrical and mechanical properties of CNF-based resins, Nanotechnology 24 (30) (2013) 305704.
[34] J. Crank, The Mathematics of Diffusion, second ed., Oxford University Press, 1975. London.
[35] O.V. Kharissova, B.I. Kharisov, Variations of interlayer spacing in carbon nanotubes, RSC Adv. 4 (58) (2014) 30807–30815.
[36] P.I. Neel, Development and Exploitation of Carbon Materials from Plant Sources, Indian Institute of TEchnology Madras, Chennai, India, 2009.
[37] A.M. Nacas, L.D. Antonino, A.C. Chinellato, D.J. dos Santos, Nano boron nitride/ polyurethane adhesives in flexible laminated food packaging: peeling resistance and permeability properties, Int. J. Adhesion Adhes. (2019) 102326.
[38] P. Gomasang, K. Kawahara, K. Yasuraoka, M. Maruyama, H. Ago, S. Okada, et al., A novel graphene barrier against moisture by multiple stacking large-grain graphene, Sci. Rep. 9 (1) (2019).
[39] T.Y. Kim, E.H. Song, B.H. Kang, S.J. Kim, Y.-H. Lee, B.-K. Ju, Hydrolyzed hexagonal boron nitride/polymer nanocomposites for transparent gas barrier film, Nanotechnology 28 (12) (2017) 12LT01.

![Fig. 7. The effect of the effective diffusion coefficient (D e ) of attacking chem- chem-icals on the electrical response (Adapted with permission [20]](https://thumb-eu.123doks.com/thumbv2/123doknet/7353563.213231/7.892.66.836.84.354/effective-diffusion-coefficient-attacking-electrical-response-adapted-permission.webp)