Plane
mPlane
an Intelligent Measurement Plane for Future Network and Applica on Management
ICT FP7-318627
Design of Analysis Modules
Author(s): Author names
A-LBELL D. Papadimitriou
ALBLF Z. Ben Houidi, S. Ghamri-Doudane
ENST D. Rossi
Eurecom M. Milanesio
FTW P. Casas, A. D'Alconzo FUB E. Tego, F. Matera
NEC M. Dusi
NETvisor T. Szemethy, D. Máthé POLITO S. Traverso, A. Finamore
TID I. Leon adis, L. Baltrunas, Y. Grunenburger ULg (editor) B. Donnet, G. Leduc, Y. Liao
Document Number: D4.1
Revision: 1.0
Revision Date: 31 Oct 2013
Deliverable Type: RTD
Due Date of Delivery: 31 Oct 2013 Actual Date of Delivery: 31 Oct 2013 Nature of the Deliverable: (R)eport Dissemina on Level: Public
Abstract:
This public deliverable describes the design and specifica on of a first set of basic analysis modules for addressing the use cases iden fied in WP1. The document focuses on the required algorithms, which use as input the measurements and analysis pro-vided by the lower layers (WP2 and WP3) of the mPlane architecture to provide more advanced analysis and answers towards the resolu on of the problem addressed by the use case. These analysis modules include both stream and batch processing algorithms and address issues such as classifica ons, es ma ons, predic ons, detec ons, correla ons and diagnosis.
Contents
1 Introduction. . . 5
2 Analysis algorithms associated with mPlane use cases. . . 6
2.1 Supporting DaaS troubleshooting. . . 6
2.1.1 Use case introduction . . . 6
2.1.2 Description of the associated analysis algorithms. . . 8
2.1.3 Preliminary evaluation . . . 8
2.2 Estimating content and service popularity for network optimization . . . 9
2.2.1 Use case introduction . . . 9
2.2.2 Description of the associated analysis algorithms. . . 10
2.2.3 Preliminary classi ication approach . . . 11
2.2.4 Advanced classi ication approaches and popularity prediction . . . 12
2.3 Passive content curation . . . 13
2.3.1 Use case introduction . . . 13
2.3.2 Description of the associated analysis algorithms. . . 15
2.3.3 Preliminary evaluation . . . 18
2.4 Measurements for multimedia content delivery . . . 20
2.4.1 Use case introduction . . . 20
2.4.2 Description of the associated analysis algorithms. . . 21
2.5 Quality of Experience for Web browsing . . . 22
2.5.1 Use case introduction . . . 22
2.5.2 Description of the associated analysis algorithms. . . 23
2.6 Mobile network performance issue cause analysis. . . 26
2.6.1 Use case introduction . . . 26
2.6.2 Description of the associated analysis algorithms. . . 27
2.7 Anomaly detection and root cause analysis in large-scale networks . . . 32
2.7.1 Use case introduction . . . 32
2.7.2 Description of the associated analysis algorithms. . . 34
2.8 Veri ication and certi ication of service level agreements . . . 43
2.8.1 Use case introduction . . . 43
2.8.2 Description of the associated analysis algorithms. . . 43
3 Generic analysis algorithms. . . 47
3.1.1 Network Inference . . . 47
3.1.2 Network inference algorithm: DMFSGD. . . 49
3.1.3 DMFSGD implementation and results . . . 51
3.1.4 DMFSGD in the mPlane architecture . . . 51
3.2 Topology discovery . . . 54
3.2.1 IGP Weight Inference . . . 54
3.2.2 Tracebox . . . 56
3.3 One way delay variation (∆OWD) measurement . . . 59
3.3.1 QoS to QoE mapping via ∆OWD measurement . . . 60
3.3.2 QoS. Passive ∆OWD measurement (Tstat) . . . 62
3.3.3 QoS. Active ∆OWD measurement (TopHat) . . . 65
3.3.4 QoE. Impact of ∆OWD on BitTorrent completion time. . . 67
3.4 Hypergraph Mining . . . 71
3.4.1 Introduction . . . 72
3.4.2 Hypergraphs . . . 73
3.4.3 Probabilistic Hypergraphs . . . 77
3.4.4 Application . . . 77
3.5 Statistical Relational Learning . . . 79
3.5.1 Introduction . . . 79
3.5.2 Statistical Relational Learning . . . 80
3.5.3 Application . . . 81
1 Introduc on
Deliverable D3.1 has already de ined and described basic algorithms that operate on the data stor-age and large-scale analysis layer (WP3) of the mPlane architecture, generally on very large amounts of data. Their associated repositories expect to receive input data from a multitude of probes, as de-ined in WP2. This amount of data is processed, analyzed and aggregated in the storage layer using parallel and scalable frameworks, and later served to the data analysis layer (WP4), which makes use of it through more advanced and with higher-visibility algorithms and through the Reasoner. Basic algorithms in WP3 thus produce data that is consumed by other algorithms (recursively at WP3, or at WP4) and/or by the Reasoner (WP4). By construction, WP4 algorithms most often ac-cept data of smaller size, relying on other algorithms de ined in WP3 that already aggregate data and extract a set of features conveying a summary of information and which size is more conve-nient and feasible to be treated by the algorithms at WP4. Note that WP4 algorithms might receive as input data directly coming from WP2, but only for speci ic time frames and/or data-size-limited analysis tasks, specially in the case of instantiation of new functionality at the probes, during the iterative process.
The algorithm de inition is use case driven and follows the use cases described in D1.1. For each use case we identify:
• the available measurements produced by the probes at WP2 (available in D2.1 and D5.1), • the basic algorithms necessary to process them at WP3 (available in D3.1),
• the WP4 analysis algorithms (the focus of this document).
The design of the different analysis algorithms in WP4 is related to the different use cases, but whenever possible, re-utilization of the different algorithmic techniques will be envisaged. In this sense, the analysis algorithms should be designed and implemented as analysis modules, which will expose different functionalities to its inal user, i.e., the Reasoner, which will be further investigated in D4.2.
Therefore the structure of this deliverable is as follows. The next chapter will describe the analysis algorithms associated with each and every mPlane use case, while some other more generic analysis algorithms which are applicable to several use cases, possibly beyond those considered in mPlane right now, are postponed to a subsequent chapter.
2 Analysis algorithms associated with mPlane use cases
Each use case is the topic of one section, and it is described according to the following structure: irst, a brief introduction to the use case is provided, with an emphasis on the splitting of its func-tionality in the various mPlane layers: probes used (WP2), stored and pre-processed data (WP3), and need for further analysis (WP4). The goal is to provide a high level description of the steps to solve the problem addressed by the use case, matching the mPlane layered structure. Then, a description of the analysis algorithms themselves is provided. Finally, and only in those cases where available, preliminary results showing the application of the corresponding algorithms are included. Note that at this stage, the preliminary results presented in this deliverable are not strictly considering the complete integration of the mPlane, but rather showing the feasibility and applica-bility of the designed algorithms.
This is the main focus of this document. As described in the Introduction and in the DoW, the algo-rithms in WP4 are used to dig into the data gathered and pre-processed across the lower layers of mPlane (both WP2 and WP3).
The complexity of the WP4 algorithms depends on the particular use case they are intended to ad-dress, but in general terms, WP4 algorithms are more specialized and have a broader picture of the problem they are tackling than in previous analysis stages performed either locally at WP2 probes or globally at WP3. For example, let us consider the interaction between WP3-type data analy-sis and the analyanaly-sis done by WP4 algorithms; while WP3 performs basic statistical data analyanaly-sis on large amounts of historical and highly distributed data coming from the WP2 probes, WP4 al-gorithms access only a reduced part of this pre-processed data for more elaborated analysis (e.g., analyze all those users who have sent more than N packets in the last hour). Similarly, while probes at WP2 perform local analysis at the vantage points where they operate, WP4 algorithms combine and correlate the information coming from multiple of these probes and at different times to get more clear and global view of the analysis.
The algorithms must have a clear spatio-temporal notion of the problem they address, as they are capable of merging the local real-time analysis performed by the probes of WP2 at different physical locations with the historical global data analysis performed at WP3.
Data mining, machine learning, statistical inference, signal processing and information theory ap-proaches are the bases of WP4 algorithms. These algorithms provide different degrees of insight based on the quality and type of the data they use. For example, limited insights if only coarser-grained, fewer dimensional data is available, and more accurate and detailed insights if richer, more relevant and iner-grained data is used. The insights provided by WP4 algorithms serve as input to the Reasoner, which pushes forward the following steps of the iterative process.
For each use case, we provide a clear speci ication of the relevant analysis algorithm, as well as of its input (i.e., the link with the storage layer and possibly the use of speci ic probes) and output.
2.1
Suppor ng DaaS troubleshoo ng
2.1.1
Use case introduc on
Running desktop-as-a-service (DaaS) solutions in remote data centers is an emerging means of delivering virtual PCs in an inexpensive, secure, and easy-to-maintain way. The fact that such
solu-e.g., pkt-size, rate, RTT, inter-time
e.g., RTT
e.g., SVM
probe repository Analysis module
reasoner
Figure 1: Detecting the QoE of users accessing content using Desktop-as-a-Service solutions through thin-client connections: overall schema in the mPlane context.
tions rely on the presence of connectivity between users and their virtual PCs poses a challenging operational question that mPlane can address: what is the quality of experience of the user when
running a particular application over the thin-client protocol?
The goal of this scenario is to exploit mPlane to understand whether the path between the thin client and the remote server has enough resources to sustain the rendering of the speci ic application. The idea is to use mPlane to collect and correlate information about the application being requested and the available network resources, in order to infer the quality of the service as perceived by the end-user and to pinpoint the reasons of any performance degradation.
Here follows the overview of the end-to-end process taking place within the mPlane stack to detect the Quality of Experience of users accessing content using Desktop-as-a-Service solutions through thin-client connections.
An mPlane probe continuously and passively collects features that can be accessed from the thin-client connection while it is running. The idea is that each probe monitors all the thin-thin-client connec-tions that are happening over time and collects the features needed to infer the application running on top of them, and eventually the QoE perceived by the users. As thin-client connections usually make use of encryption to protect the content being exchanged, the mPlane probes collect IP-level features of the packets of the connections, such as packet size, rate, inter-arrival time, and TCP-level features such as payload length and number of observed packets, whether they carry data or acknowledge only, TCP lags, etc. These features are collected on a per-connection basis, i.e., on a per-thin client basis, and within sliding observation time-window.
Periodically, the probe sends the features extracted from a given thin-client connection to the cen-tral repository, which stores them for the Analysis module to use. Based on these features, the Anal-ysis module implemented on the Reasoner is responsible for classifying the connection, that is, in-ferring the application running on top of the thin-client connection during a time-window through statistical traf ic classi ication techniques.
By combining the information from the Analysis module with the network conditions along the path between the thin-client and the remote server, the Reasoner can eventually infer the temporal evolution of users' QoE. Note that those network conditions are collected in the irst place by mPlane probes, which periodically send them to the central repository.
The overall schema of the process is outline in Figure 1: the role of each mPlane component, that is, probe, repository and reasoner, is shown.
2.1.2
Descrip on of the associated analysis algorithms
To detect the application on top of a given thin-client connection, we consider the use of statistical classi ication techniques. The main goal here is the design and tuning of an effective statistical classi ication technique which can effectively take advantage of the available features provided by the mPlane probes.
We plan to evaluate the accuracy of several supervised statistical classi ication techniques widely-used in the traf ic classi ication ield [84], such as Support Vector Machines, Random Forest, Naive Bayes and Decision Tree, in detecting the applications running on top of the thin-client connections. Supervised approaches require a training phase before being exploited for classi ication. During the training phase, a supervised machine-learning algorithm requires as input a collection of samples for each class of interest. Starting from these samples, the algorithm extracts the features needed to build a mapping function between the samples themselves and the class they belong to. In our case, the class of interest is a particular application running inside the thin-client connections, or a class of them thereof, such as Data, Audio, Video; the features will be instead the ones collected by the mPlane probes, and stored in the repository, from which the Analysis module can query them. During the classi ication, the features related to the thin-client connection will be tested against the training models and the connection will be labeled as belonging to one (or none) of the available models.
Given the class of applications run by the thin-client user, the Reasoner has to combine the average Round Trip Time of the connection within an observation window against a set of threshold values, and returns a QoE category. Threshold values are set for each class of applications, i.e., Data, Audio,
Video, and are based on latency values: network latency is the key factor that affects the QoE of
users when they interact with thin-client applications, as shown in [73]. As a result, for each class of applications we are able to identify requirements in terms of RTT values that make the users experience a good, suf icient or bad quality of the RDP connections.
Once the application currently running on top of the thin-client connection is known, the QoS re-quirements are evaluated with respect to passive measurements like RTT, available capacity on the path, packet loss rate, etc. When one of the above observations exceeds a certain threshold, additional measurements are triggered to identify the bottleneck along the path. Furthermore, the mPlane reasoner can react to these conditions, for instance by migrating the virtual machine where the cloud service runs closer to the user.
Information about the bottleneck along the path can be then derived on demand via an active mea-surement tool (like a traceroute) or via the mPlane Repositories (that continuously stores informa-tion about the network status in various segments of the network). Such sequential measurements can be iterated until the root cause of the problem is identi ied.
2.1.3
Preliminary evalua on
As a irst evaluation of these methods, we started collecting an initial dataset of Remote-Desktop-Protocol (RDP) connections and investigating how the techniques perform when the dataset used
for training and the one used for testing include the same class of applications and are collected under the same network conditions. To this purpose, we considered as testing set the data collected with a bandwidth of 1Mbps uplink and 6Mbps downlink and no impairments on the network by running the same class of applications as the one included in the training set, such as web-browsing, media-player video and audio data.
Given an epoch, we observe the traf ic lowing into the RDP connection, extract the features for each epoch and classify it to the class of application it belongs to. By considering time-windows (epochs) of 10 seconds, we achieved maximum accuracy (over 90%) when applying SVM, whereas we achieved around 85% with Decision Tree and Random Forest, and 78% when using Naive bayes.
2.2
Es ma ng content and service popularity for network op
-miza on
2.2.1
Use case introduc on
The capability of estimating the future popularity trends of services and contents (both managed and user-generated) has a wide range of applications. For instance, operators could optimize their resource management to improve QoS, as well as CDN providers could design smart caching mech-anisms or improve the spatial distribution of caches within the ISP network (e.g., in the aggregation network [12] or in the user set-top-box [68]).
Currently, very simple yet unrealistic workload models are used: rather generally indeed, the object catalog is stationary, and additionally the popularity of each object is stationary as well. Given the importance of video on today Internet, we clearly see that this is clearly not in line with the typical catalogs of popular Internet movie-streaming platform (e.g., Net lix) or video-on-demand portals (e.g. YouTube), that signi icantly evolve over time (e.g., see [12] for an analysis of the Ne lix dataset). Hence, as stationary workloads currently in use are unrealistic, there is need for more realistic mod-els. While trace-driven evaluation (e.g., as we use for the assessment of caching performance of the Net lix [12] and YouTube [68] catalogs) constitutes a irst step in this direction, modeling of the system dynamics would offer the community a more powerful tool. A non-stationary workload model, it on real traces, would not only be extremely useful for realistic performance evaluation (being simpler to share than actual datasets for privacy reasons, and due to the sheer size of the dataset) but also possibly enhance system performance (e.g., by allowing to exploit forecast of pop-ularity evolution). Having a general methodology that is not bound on the speci ic application (e.g., video as in the previous example), will allow mPlane solution to be useful even in case of changes in the Internet ecosystem.
The goal of this scenario is to employ mPlane to monitor the arrival process of requests towards the services and the contents and store this information to run predictive algorithms. The architecture of mPlane perfectly its for this process, since we aim to collect large amounts of traf ic information such as the contents/services being requested by the users in several points of the network and produce a list of the most likely to be popular in the future.
Here follows the overview of the end-to-end process taking place within the mPlane stack to esti-mate the popularity trends of contents by a passive observation of the network traf ic.
Several mPlane probes are located in different points of the network to continuously and passively collect information about contents and services being accessed from users. As web contents are
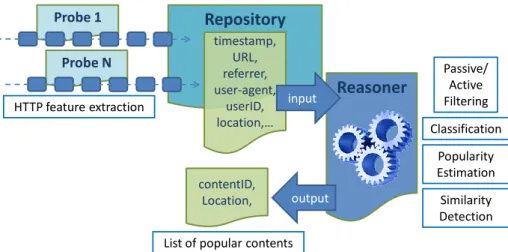
Repository
Reasoner
Probe 1
Classification logic for estimating popularity output timestamp, contentID, userID, location,… contentID, location Probe N input IP-level, TCP-level, HTTP feature extraction
Future popularity trends
Figure 2: Predicting the popularity trends of contents by a passive observation of network traf ic. usually delivered through HTTP, the probes collect traf ic at transport layer (TCP-level), so that we can easily rebuild HTTP conversations between users' devices and the servers hosting the re-quested contents. The probes are programmed to generate a time-series of requests, reporting the content being requested, a timestamp and the network location of the probe.
At regular time intervals, say every few minutes, the probe sends the extracted information to the central repository, which stores them for the Predictor module to use. The Predictor module im-plemented on the Reasoner extracts the arrival process of requests for each observed content and separately for each probe location. Then, employing statistical classi ication techniques, request arrival processes are grouped to retrieve their possible future growth rate.
Finally, the Predictor generates a list of contents that are likely to become popular in the future, sep-arately for different portions of the network. In Figure 2 we report the overall prediction process. The role of each mPlane component, that is, probe, repository and reasoner, is shown.
2.2.2
Descrip on of the associated analysis algorithms
Conceptually, there are three component steps to understanding and estimating the future popu-larity of contents. In order of appearance, we must irst collect a suf icient sample of the data in order to be able to build a feature space that we can characterise. In effect we build a training set. Although the term a 'training set' implies that we are focused on supervised learning techniques alone, this is not in fact the case. Having a suf icient training set means sampling the problem space in order to be able to characterise it. Second, we come to the characterisation, although this may be merged with the next stage of estimation, conceptually here, we are focused on identifying the patterns of popularity evolution displayed by the data. Identifying such patterns enable us to relate new and so far unseen objects to past observations. Finally, estimation, here we are interested in ascribing a value to the future popularity of content, based on the understanding we have built of its growth process.
Within mPlane, we are interested in applying data driven techniques to understand the how users' consume content, in affect the evolution in the demand for individual contents.
0 200 400 600 800 1000 1200 1400 1600 04/28 05/05 05/12 05/19 05/26 06/02
Cumulative number of requests
Time [days]
Figure 3: Cumulative number of requests over time for a subset of videos observed in a traf ic trace spanning one month of 2012; only the requests within the life-span of the content are shown.
Trace 03 0 5 10 15 20 25 30 35 40 l ^ m [days] 10 100 1000 V ^ m 1e-08 1e-07 1e-06 1e-05 0.0001 0.001 0.01
Figure 4: Density map of contents with Vm≥ 10observed in a traf ic trace, based on esti-mated number of requests Vmand effective life-span lm.
2.2.3
Preliminary classifica on approach
With respect to this, we analysed a trace of passive traf ic measurements, and we characterised the popularity pro iles of YouTube videos observed in the operational network of a large Italian ISP.1 From Fig. 3, we see that YouTube videos display extremely heterogeneous request distributions and exhibit strong time-localities. For instance, we observe that the popularity of some videos (red lines in the plot) vanishes after only a few days - these are usually videos belonging to the news or sport categories -, while others (green lines in the plot) continue to attract requests for almost the entire duration of the trace - such as videos belonging to the music category -, re lecting the diversity in user interest. As a result, to capture the evolution of content popularity over time, we focus just on the this cause, and characterise each individual content object m with the following two parameters:
• The total number of requests Vmgenerated by the content.
• The effective life-span lmof the content, which is de ined as the duration of the interval in which we see the bulk of its requests.
The density map in Fig. 4 reveals that, as expected, contents exhibit wide heterogeneity in terms of estimated life-spans lmand estimated volumes Vm. The map also shows that there exists a peculiar correlations between lmand Vm. This suggests that a traf ic model should consider the joint dis-tribution of these metrics. In fact, from the results, we observe that a non-marginal share of videos (7-10%) exhibit a very small life-span (lm ≤ 5 days), while 2% of videos have Vm ≥ 10, but account for a share of requests that is greater than 27% (these results hold for all the traces considered in the data set analysed in [80]). These two observations should be carefully taken into account during the classi ication process.
1Measurements were collected on both incoming and outgoing traf ic carrying YouTube videos for a period of three
months, from mid March 2012 to late May 2012. During this period, we observed the activity of more than 60,000 end-users accessing the Internet normally.
Class Life-span [days] Trace %Reqs %Videos E[lm] E[Vm] Class 1 ˆl≤ 2 Trace 1 9.15 3.17 1.14 86.4 Trace 2 10.05 4.17 1.09 76.2 Trace 3 9.44 3.73 1.04 76.0 Trace 4 7.77 3.34 1.06 74.0 Class 2 2 < ˆl≤ 5 Trace 1 6.80 4.9 3.36 41.9 Trace 2 12.55 7.83 3.34 50.7 Trace 3 6.55 4.54 3.32 43.3 Trace 4 6.12 4.06 3.41 48.0 Class 3 5 < ˆl≤ 8 Trace 1 5.87 2.95 6.40 59.5 Trace 2 6.72 4.74 6.31 44.9 Trace 3 6.05 2.87 6.42 63.3 Trace 4 5.14 2.71 6.45 60.3 Class 4 8 < ˆl≤ 13 Trace 1 5.49 4.45 10.53 36.9 Trace 2 10.79 8.61 10.86 39.6 Trace 3 4.84 3.68 10.62 39.5 Trace 4 5.34 4.48 10.65 37.8 Class 5 ˆl > 13 Trace 1 72.69 84.58 24.61 25.7 Trace 2 59.89 74.65 19.29 25.3 Trace 3 73.11 85.17 28.19 25.8 Trace 4 75.63 85.41 24.59 28.1
Table 1: Observed features for different classes of contents.
It is also worth emphasising that the two parameters Vm and lmalone do not completely charac-terise the temporal evolution of content popularity, which as shown in Fig.3, can exhibit complex growth patterns. In fact, recent studies [86, 56, 5] conducted on much larger data sets reveal that the popularity of different contents, including videos, follow a limited number of “archetypal” tem-poral pro iles, which essentially depend on the nature of the content and on the way it becomes popular. However, as shown in [80] speci ically for the case of CDNs, the single cache performance is essentially driven by the parameters Vmand lm, while the shape of the popularity pro ile has only a second-order effect.
In Table 1 we report the result of a time-based approach to classify YouTube videos: considering all the traces available in our data set, for each observed content we measured its life-span lmand the number of requests Vmit attracted, i.e. features fairly easy to extract from a passive traf ic trace. We thus divided contents by looking at their life-spans. Observe that this classi ication has been performed for all contents showing Vm≥ 10. For each content class, Table 1 reports the percentage of total requests attracted by the class, the percentage of contents belonging to it, and their average estimated values Vmand lm. Notice from Table 1 that contents in Class 1, whose life-span is smaller than 2 days, represent less than 4% of the total number of contents but attract approximately 10% of all requests. Therefore, referring to the context of CDNs, since these contents exhibit a large degree of temporal locality, they can be expected to have signi icant impact on cache performance. Observe also from Table 1 that the values related to each class are quite similar across the four traces (within a factor of 2). This is signi icant, because it suggests that this broad classi ication captures some invariant properties of the considered traf ic. Further details about the classi ication approach and employed traf ic traces can be found in [80].
2.2.4
Advanced classifica on approaches and popularity predic on
Above results about the classi ication of contents are preliminary for our objective of exploring a range of more sophisticated statistical classi ication and inference techniques (i.e. mixture model-ing, and decision trees) in order to identify underlying patterns of growth, and use this information to build pro iles that can be utilized by the Reasoner to classify and estimate the future popularity
of contents.
Given the popularity pro iles of each request arrival process, the Reasoner has to combine the future expected number of requests against a set of threshold values, and returns a popularity category. As a result, the Reasoner will pinpoint those contents and service which are expected to become hot in the near future. Once the Reasoner has retrieved the required popularity information for each observed network portion, it can, for instance, directly contact the CDN provider to suggest contents to be pro-actively pushed to the caches, thus improving the QoE perceived by the users. Furthermore, given the wide range of services and web contents available in the current Internet, the Reasoner must be able to automatically detect upcoming trends in order to evolve with traf-ic pro iles observed. For this purpose, the repository should support storing long term statisttraf-ics regarding the popular of contents and services observed in the network.
2.3
Passive content cura on
2.3.1
Use case introduc on
Content and media curation is the act of using both automatic and human resources for the purpose of aggregating, sorting, organizing and presenting only ``interesting'' content to end-users. The ra-tionale behind its advent is that the Internet today contains much more content than what humans can individually consume and sort by themselves. We, as users of the Internet, need therefore tools that ``cure'' the content for us so that we see preferably the content that is more likely to interest us. Examples of such tools include Reddit [67], Digg [30] and Pinterest [64]; even social networks like Twitter can be themselves seen as media curation tools [48].
A family of curation tools uses mainly the so-called ``wisdom of the crowd'' to present and select interesting contents. The rationale behind this approach is that the collective answer of a large group of individuals to a given question is often better than the individuals' responses. With this respect, we argue that ISPs are better positioned to provide such service thanks to the Internet-wide view that they have on the traf ic.
By ``simply'' monitoring content requests that low within their networks, ISPs can infer the content that is capturing the largest interest. By tracking trends and with appropriate models, it would be even possible to predict early enough which content will become popular, and therefore present it early enough to users. Such a service can be done passively without user engagement, and in an aggregate manner, thus not offending users' privacy. In fact, we assume that if a content (e.g., a URL) is visited, it is because it captured some user's interest. The more a content is clicked, the higher the chances that it deserves to be watched. Finally, unlike current curation systems whose results can be manipulated by a small community of users [61], passive media curation is by design more immune to such biases.
Fig. 5 gives an overview of the media curator achitecture, our ISP-provided content curation sys-tem. At the bottom we have ``probes'' installed at network level that extract requested objects. The requests from different probes are aggregated and sent to a content iltering and popularity anal-ysis module which elects the most popular contents, and sends the rankings to the presentation module which will make these content items (pointers to them) available online.
The raw data extraction module exposes the following information about content requests: probe location, timestamp, URL, an anonymized user id, as well as the referrer and user agent ields
ex-Figure 5: An overview of the content curation system.
posed in the HTTP requests.
The content iltering and popularity analysis module, de facto the core of this system, processes the data generated by the content requests extractors. As an output, it provides a list of ``hot''
contents, e.g., URLs pointing to pages that are likely to interest Internet users. Basically, it builds
``popularity'' measurement to rank objects. This module can work in both push and pop mode. It irst can push alarms about content items which are likely to become hot. It can also respond on demand to provide statistics about the history of popularity. As such, it should be able to return the list of the most popular contents in a given period of time.
This module consists of ive sub-blocks as depicted in Fig. 5. The irst block applies iltering to discern relevant URLs. In order to check their relevance, this block might need to actively query some speci ic URLs. This can be done thanks to an active probe sub-block (i.e., a web scraper). The iltered URLs are then analyzed to predict their future popularity trend: irst, contents are divided in categories by the classi ication sub-block. The role of this block is to cluster the iltered contents so that different predictors blocks can run on them. Finally, a last sub-block will take care of providing statistics about the history of popularity of observed content.
The output of the content iltering and popularity analysis module is then provided to the presenta-tion module whose aim is to present the popular contents, gouping them by topic. The presentapresenta-tion module also runs similarity detection algorithms to group together different URLs pointing to the same news or object. Finally, it uses a web scraper to query URLs to offer a preview of the content to be shown on the frontpage.
In the following we describe the algorithms which compose the content iltering and popularity analysis module.
Repository
Reasoner
Probe 1 Passive/ Active Filtering output timestamp, URL, referrer, user-agent, userID, location,… contentID, Location, Probe N input HTTP feature extractionList of popular contents
Classification Popularity Estimation Similarity Detection
Figure 6: Extraction and curation of contents lowing on the network.
2.3.2
Descrip on of the associated analysis algorithms
Here we present the algorithms that constitute the content iltering and popularity analysis module, i.e., the core of the media curatordesign. The ultimate goal of this module is to provide a ranked list of the most popular content observed in the network. We consider as content the URL of a web page that was visited by a user.
2.3.2.1 Iden fica on of user-URLs
First of all, most of the HTTP requests lowing in a network are not relevant for our system. For instance, many URLs point to different objects such as CSS and javascript iles. These are not the type of contents media curatorshould promote. Therefore a crucial step in the content popularity analysis module is the iltering of irrelevant URL requests. We distinguish between two types of URLs: browser-URLs, i.e., HTTP requested objects that are part of a web page and thus transparently downloaded by the browser; and user-URLs, i.e., URLs of pages intentionally visited by users. media curator seeks only user-URLs.
The irst step in the iltering is to distinguish browser-URLs from user-URLs, i.e. contents that have been automatically required by the browsers from those that have actually been clicked by the user. Several methods have been proposed in the literature [23, 11, 43]. The most accurate for nowadays web traf ic is the one presented in [43]. However, its methodology needs to monitor HTTP requests and corresponding responses, which dramatically increases the complexity of the content extractor module. Besides, this method does not work for all web content, but only on pages that contain the google analytics beacon. According to the authors [43], this beacon is present in only 40% of the pages.
Therefore, we believe that new and simpler methods must be devised to identify user-URLs. As a design choice, we rely only on the parsing of only HTTP requests (and not responses) to reduce the algorithm complexity.
enu-merate them as follows.
1) Referer-based ilter: This method exploits the complex structure of web pages and the referer2
ield. When the URL of a web page is clicked, a sequence of HTTP requests is generated by the browser to retrieve all the objects that are necessary to render this web page. As such, all these ob-ject URLs have, as a referer the irst clicked URL. Therefore, by focusing on the referer ield instead of requested URL, we are sure of capturing the original user-URL. In reality, this method captures all complex web objects whose loading requires the browser to load other objects (e.g. ``complex'' css iles calling other css iles).
2) Type-based ilter: This method is similar to [23]. It ilters out URLs based on their type. However,
instead of relying on the content type, we inspect the extensions of the objets queried by the HTTP requests: in particular, we discard URLs pointing to .js, .css and .swf iles.
3) Ad-based ilter: This approach relies on the observation that a large amount of advertisement
is nowadays embedded in web pages. Unfortunately, since advertisements can be complex html objects, they can be detected as user URLs using the refer-based ilter above. To counter this phe-nomenon, we blacklist such URLs (using the AdBlock ilter [4]). This method has however, the counter effect of removing advertisement that were actually intentionally visited by the users.
4) Children-based ilter: By counting the number of URLs seen with a given referer URL, it is possible
to know the number of objects (children) composing the corresponding parent URL (in the referer ield). Given the tendency of today's complex web pages to include a large number of objects, we can safely ilter out URLs that have a very low number of children, e.g., simple objects that include only few other objects.
Finally, in our work, we also test the Time-based ilter [11, 43]. This method relies on the intuition that a cascade of browser-URLs always follow the initial user-URL: browser-URLs would be tightly grouped in time after the user-URL request has been observed. As such, the irst request after a given inactivity period is considered to be the user-URL, while all the following HTTP requests that come after a given threshold are assumed to be browser-URLs. Both the inactivity period or the threshold are clearly dependent on user habits (e.g. opening multiple tabs at the same time), the network conditions and DNS response times etc. They are as such dif icult to estimate.
2.3.2.1.1 Preliminary evaluation To evaluate these methods, we manually collected, similarly to [43], a ground truth trace by visiting URLs hosted by the top 100 most popular web sites accord-ing to Alexa rankaccord-ing. In each of these sites, we randomly visit up to 10 links contained in them. We store all the clicked URLs as they are shown in the browser bar. In parallel, we capture all HTTP requests generated by the browser. This resulted in a total list of 905 user-URLs, corresponding to 39025 browser-URLs.
We start our analysis by applying the referer method irst. Fig. 7 depicts the resulting Venn diagram, which shows that the referer method alone has a high `` iltering capacity''. In fact, it reduces the set of browser-URLs from 39025 URLs to only 2616 URLs. Besides, it has a high recall3(98,34%).
How-2A ield in the HTTP request that speci ies from which previous page the URL has been referred
3The number of URLs correctly labeled as user-URLs (true positives, here 890) over the real number of user-URLs
Figure 7: Venn diagram reporting the effects of different iltering methods on our ground truth data set.
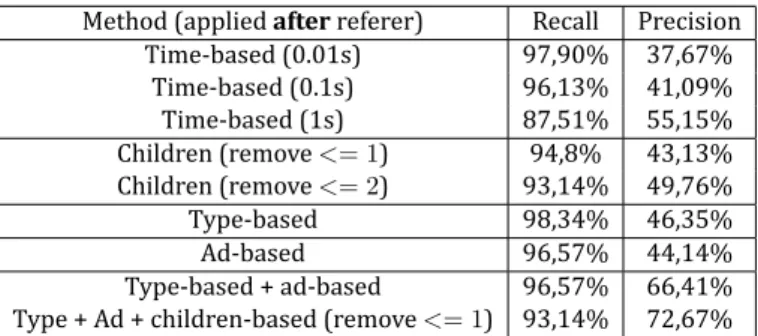
Method (applied after referer) Recall Precision Time-based (0.01s) 97,90% 37,67% Time-based (0.1s) 96,13% 41,09% Time-based (1s) 87,51% 55,15% Children (remove <= 1) 94,8% 43,13% Children (remove <= 2) 93,14% 49,76% Type-based 98,34% 46,35% Ad-based 96,57% 44,14% Type-based + ad-based 96,57% 66,41% Type + Ad + children-based (remove <= 1) 93,14% 72,67%
Table 2: Performance of iltering methods
ever, its precision4is low (34%). Therefore, to reduce the set of false positives, we apply our other
methods on top of the URLs detected by the referer method. We also consider different thresholds. The results are summarized in Tab. 2.
Both the time-based and the children-based methods enhance the precision when we increase re-spectively the time threshold and the minimum number of children. However, they come at the cost of a decreasing the recall (invalidating valid visited URLs). On the other hand, the type-based and the based let us enhance the precision, with almost no impact on the recall. In reality, the ad-based ilter removes 16 valid user URLs, but these were unintentionally visited when we collected the trace5.
As a start, we opt for the most conservative approach that favors recall over precision: we retain the type-based coupled with ad-based ilters applied after the referer method. We leave their en-hancement for future work.
2.3.2.1.2 Additional problems/ iltering When trying to apply the above-mentioned iltering mechanisms on real data, we noticed some additional sources of error that called for more ingenu-ity. In particular, we encountred two main problems; we propose two simple mechanisms to factor them out:
i) URLs generated by non-browser applications: Most applications use HTTP to automatically
down-load content, e.g., Dropbox or games on smartphones. The queried URLs are clearly not interesting
4The number of true positives over the number of items labeled as positive by the method (here 2616). 5Although we acknowledge that some advertisements might interest people, we decide to skip them for now.
for media curator, and must be ignored. We can easily identify those URLs by inspecting the
user-agent ield6in the HTTP request header.
ii) In lated popularity induced by some users: Sometimes browsers generate multiple HTTP requests
for the same content, e.g., automatically reloading a page, or downloading videos in chunks. This phenomenon in lates the popularity of some URLs. We counter this effect by counting a URL only once for each user-id.
2.3.2.2 Pinpoin ng Interes ng URLs
Applying the retained iltering method on our data set, and looking manually at the most popular URLs, we found that they still do not correspond to what we expect the media curator portal to promote. In fact, among the popular user URLs, we ind popular web pages that might not interest users (e.g the web portal of an online bank). Therefore, the next step in the iltering is how to go from user-URLs to interesting URLs, i.e., URLs that are likely to attract users' attention.
Finding a measure of interest is challenging since it involves human subjects and tastes. We develop a preliminary simple heuristic that leverages online social network meta-information. We assume that interesting URLs should be rich with ``social'' features (e.g., share buttons). The idea is that if a web page is meant to be shared, then it might interest other people. Based on this rationale, we propose two methods to understand which user-URLs are ``social-networks enabled'':
1) Active method: In order to know if a user URL is as well an interesting URL, this method actively
queries the URL and parses the returned HTML header looking for the presence of the OpenGraph protocol7[63]. If the protocol is present, the user URL is classi ied as an interesting URL. This
method is meant to use the web scraping capability of the content popularity analysis module.
2) Passive method: This approach aims at passively detecting if a web page contains any of the well
known social networks buttons. We inspect a user-URL children (URLs seen with the user-URL as a referer) and match them against a list of URLs necessary to load such buttons. We study the different social networks web development guidelines to construct such a list.
2.3.3
Preliminary evalua on
As a irst evaluation of these methods, we test if they already work on platforms that are known to be interesting. In particular, we test them against Google News. For this purpose, we visit 1000 URLs promoted by Google News. Applying the active and the passive methods on this trace, we ind that they classify as interesting respectively 79% and 70,72% of Google News URLs. By inspecting manually the misses, we ind that (1) not all the web pages implement the OpenGraph protocol and (2) there are ad-hoc ways of implementing the social networks buttons that our list fails to identify. In particular, YouTube uses an ad-hoc solution, but it is OpengGraph compliant, so our active method correctly detects it.
6The user-agent informs about which application generated the HTTP request
7The OpenGraph protocol was developed by Facebook to help web pages getting integrated in ``the social graph''. The
OpenGraph metadata in web pages helps the social web scrapers (e.g. Facebook scraper) forming a preview of a page when it is shared in a social network.
1 10 100 1000 1e+4 1e+5 1e+6
1 10 100 1000 1e+4 1e+5 1e+6 1e+7 1e+8
Number of views
URLs
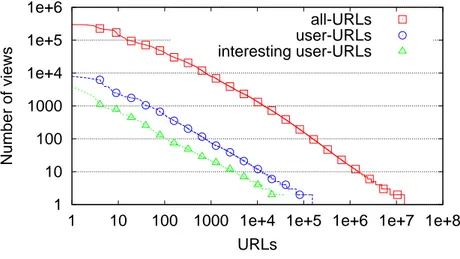
all-URLs user-URLs interesting user-URLs
Figure 8: Content items popularity before and after iltering the considered traf ic trace.
Given the early stage of development of our heuristics, these results look promising, and we leave their enhancement for future work. Finally, in order to have a preliminary estimate of their `` ilter-ing capacity'', we apply them on the more neutral (not necessarily entertainment) Alexa rankilter-ing arti icial trace. Both methods gave similar results: 33% of URLs were labeled interesting using the active method, and 35% using the passive one.
2.3.3.1 Ranking and Classifying URLs
Once contents have been properly iltered, the next step is to run popularity prediction algorithms to retrieve, early enough, content items that are most likely to attract users' attention. With this respect, the algorithms presented in Sec. 2.2 will be of a great help.
As shown in Fig. 6 the output of this inal process will be a list of the hottest contents observed in the network. This list can be further personnalized and provided on a per-region basis, by ``zooming'' on particular probes in the network.
To get an idea about how such a ranking would look like and how our retained iltering algorithms would behave on real data, we apply them on a three-days long http trace. The trace contained around 190 millions of HTTP requests.
Fig. 8 shows the popularity of all-URLs, user-URLs and interesting user-URLs. As expected, the user-URLs represent a tiny fraction of all the URLs lowing in the network: our method detects that only 1% of all-URLs are actual user-URLs. Among these user URLs, around 25% were detected as interesting.
We analyze the interesting user-URLs. We irst manually classify the top 1000 URLs to build a set of rules to help us having a preliminary classi ication of the rest of the URLs. Among the top 1000 URLs, we ind that 482 are news (or blogs), 336 are services (e.g., online shops, travel engines, etc.) and only 91 were videos. Extending a similar classi ication on the rest of the interesting user-URLs, we ind that (at least) 18% correspond to Video coming from 9 different platforms (YouTube alone 15%) and 22% correspond to news coming from around 80 different news web sites. This observation con irms that the ISP is probably the only entity that has such a rich cross-OTT view on Internet content.
2.4
Measurements for mul media content delivery
2.4.1
Use case introduc on
Evaluating the quality for multimedia stream delivery is important for
1. ISPs who are interested in assessing the true quality of their networks for popular applica-tions (such as multimedia streaming)
2. Streaming service (infrastructure) providers who are interested in knowing the quality of their services as delivered by ISPs to different locations over different access technologies
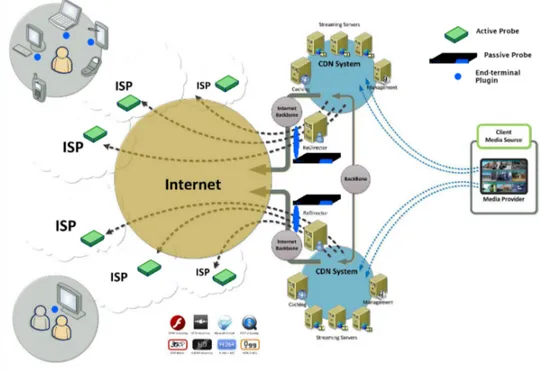
Figure 9: Architecture for monitoring the multimedia service infrastructure
In both cases, active testing substitutes or augments monitoring performed at ``real'' end-user ter-minals. Performing end user measurements in many cases is problematic - among the reasons are users' unwillingness to participate, lacking support for various end user devices by the mea-surement platform, or the unability to install additional meamea-surement plugins for administrative reasons etc.
Active probes on the other hand are deployed at known (key) locations, are able to perform mea-surements any time, and can be con igured to receive and measure any of the streams carried by the network. Active probes are capable to evaluate adaptive streaming protocols, such as Apple HLS or Microsoft Smooth Streaming: these protocols provide multiple, different quality (i.e. band-width) alternatives for each stream. These protocols also provide means for smooth (i.e. licker-free) switching between these alternatives, thus a player can dynamically set the stream quality to the momentary bandwidth conditions. Support for smooth switching is usually achieved by en-coding the stream into time-synchronized equal-duration segment sequences of different bitrates
- reaching the end of a segment the receiver can continue by playing out the next segment from a different-bitrate alternative. The active probes discussed implement buffered player emulation, that is able to perform this adaptation and measure the achieved quality (bitrate).
Also in both cases introduced above, active measurements should be supplemented by passive mea-surements performed by high-performance passive (TSTAT) probes deployed at stream service en-try points. For an ISP, it is the peering point with the content provider, and for the infrastructure provider it is the point(s) where the streams leave the server segments, typically implemented by HTTP load balancers. TSTAT probes log each TCP/HTTP/Stream delivery session with metrics such as total duration and bitrate, number of TCP retransmits, stream metadata (e.g. video format, de-pending on depth of inspection implemented). TSTAT probes can also measure generic, yet insight-ful, quality of service metrics (QoS) such as queueing delay, that can provide important hints on users' perceived quality of experience (QoE) through perceptual mapping8. In many cases, passive probing also indicates client system type (iOS, Android etc.). As TSTAT probes have the capability to measure and log each media access session, they provide input for comprehensive performance evaluation.
It must also be noted (as explained in D1.1), that measuring the quality of stream delivery is not suf-icient for assessing the overall quality of a multimedia streaming service: there are also a number of auxiliary services, such as index pages listing content, search functionality, and - optionally - user feedback channels (e.g. forums, comments for content etc). While scienti ically not as challenging, measuring the availability and functionality of these services make the monitoring task complete. Such auxiliary service are usually monitored by automating simple HTTP download operations. In the case of interactive functions (search, feedback channels), measurements are implemented via scripted HTTP transactions.
Figure 9 shows the schematic architecture of the monitoring system.
Streaming service providers usually purchase test subscriptions from ISPs within their service area, via different access technologies, and deploy active probes to continuously monitor service delivery at each end point.
2.4.2
Descrip on of the associated analysis algorithms
2.4.2.1 Metrics collected
The analysis algorithm works on the following metrics collected by the active probes:
If the monitoring architecture also contains passive (TSTAT) probes, their logs are available as well, and can be correlated to probe measurements.
In addition, for each active probe the following information is available:
• connections's nominal bandwidth and other deployment characteristics of concern (i.e. ac-cess technology)
• topology and further classi ication information for the probe (e.g. responsible ISP)
8Mapping between QoS metrics and QoE metrics can be done through standard perceptual framework: as QoS to QoE
mapping is not necessarily bound to a single application, such as the multimedia streaming of this use case, we defer a more thorough description in Sec. 3.3
Metric Unit Description
nominalBitrate bps media segment’s advertised bitrate
actualBitrate bps actual bitrate achieved
bandwidthUtilization % actual vs. nominal bitrate
qualityIndex % bandwidth of selected stream alternative vs. best one chunkInterArrivalJitter msec jitter of L7 data chunks received
replyDelay msec delay of 1st chunk of the segment
bufferLevel % buffer level of (emulated) player
httpCode int HTTP status code of the last reply
protocolError enum protocol violaton (e.g. malformed data) serverAddress ipaddr IP address of the server providing the stream queuingDelay msec queuing delay, per-chunk or windowed
Table 3: Metrics collected by active probes The task of the analysis is
• identify subsets of probes with less than adequate performance
• match these subsets against probe topology and other deployment attributes available (e.g. ISP)
• and try to conclude if the degradations observed can be attributed probe deployment infor-mation
This way, the following problems can be identi ied: • network bottlenecks on behalf of ISPs
• network bottlenecks tied to congestion in the user access paths • regional problems caused by CDN mis-con iguration or lack of servers
• less than adequate service coverage (group of endpoints with too little bandwidth to get streams)
2.5
Quality of Experience for Web browsing
2.5.1
Use case introduc on
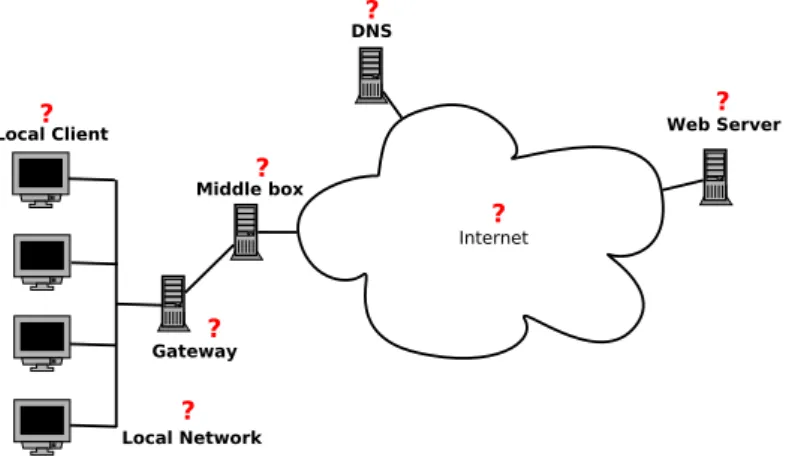
Sur ing the Internet via a Web browser is the most common way of accessing information. When clicking on a Web page, the user expects that the page gets rendered quickly, otherwise he will loose interest and may abort the page load. However, in reality, multiple causes can affect the loading speed of a Web page, causing it to be slowly or not completely loaded. This is due to the number of different actors involved in a browsing session (i.e., a time interval in which the user accesses information on the Internet via a Web browser).
Internet Local Client Gateway Middle box DNS Local Network Web Server ? ? ? ? ? ? ?
Figure 10: Segments involved in a browsing session. 1. Local Client: e.g., the local machine is overloaded, miscon igured, and so on;
2. Local Network: e.g., the local home network can be experiencing heavy traf ic load due to other local clients;
3. Gateway: e.g., the gateway can be miscon igured; 4. Middle Box: e.g., irewall, NAT, …;
5. DNS: e.g., failure to resolve properly one or more of the names referenced in the Web page; 6. Internet: e.g., something is wrong ``in the wild'', such as high loss rate between certain
inter-mediate routers;
7. Web Server: e.g., the Web server serving the Web page is overloaded and will return its con-tent slowly.
From the end user point of view, the result of a problem in any of the aforementioned segments will result in a poor quality of experience (QoE), being the Web page slowly loaded.
2.5.2
Descrip on of the associated analysis algorithms
2.5.2.1 Measurement Metrics
Symbol Metric Tool Passive or Active
Tnhop RTT to the nthhop Ping Active
∆n T(n+1)hop− Tnhop Simple Computation
-Tidle Client idle time Firelog Passive
Ttot Total Web page downloading time Firelog Passive
TDN S DNS response time Firelog Passive
Ttcp TCP response time Firelog Passive
Thttp HTTP response time Firelog Passive
Table 4: Measurement Metrics
• Client idle time: a passive measurement representing the idle time periods while download-ing a Web page;
• Total Web page downloading time: passively collected during the browsing session;
• DNS response time: the difference between the time at which the DNS request is sent and the time at which the response is received (passively collected);
• TCP response time: the time needed for receiving the TCP ACK packet corresponding the irst TCP SYN packet sent (passively collected);
• HTTP response time: the time needed for receiving the irst data packet corresponding the irst http GET packet sent (passively collected);
• RTT towards a given node, collected by actively running a ping towards the node of interest, when a problem signal is raised by the user;
• ∆i: the difference between RTTs towards consecutive routing hops i− 1 and i (computed). All the described metrics can be simply obtained by using the following tools:
• Tracebox: proposed in [3], it is used to detect the presence of middle boxes in the network • Traceroute: used to ind out the sequence of the irst hops made by a packet when leaving the
local network
• Firelog: this tool, that was irst proposed in [26], is used to perform all the passive measure-ments
All the metrics are summarised in table 4, where we also report the tools that can be used to collect them.
As explained in the next section, the metrics in table 4 are used to update cumulative statistics that are compared, in case a problem signal is raised, to an appropriate threshold to verify if the metric has some ``anomalous'' behaviour. For instance, measures such as queueing delay experienced by Web traf ic (e.g., due to competing traf ic in the user LAN) can be inferred from simple RTT mea-surement: though generic, such a metric can provide insigthful hints about the users' perceived quality of experience (QoE) through perceptual mapping9.
9Mapping between QoS metrics and QoE metrics can be done through standard perceptual framework: as QoS to QoE
mapping is not necessarily bound to a single application, such as the Web browsing of this use case, we defer a more thorough description in Sec. 3.3.
2.5.2.2 Algorithm descrip on
The proposed algorithm aims at identifying the segment that is responsible for the high Web page loading time.
The main idea is to try to perform as much of the troubleshooting process as possible exploiting the passive measurement [26], without requiring active measurements and by exploiting the ad-vantages of having more than one device in the local client network.
First of all, when a user raises a problem signal, by clicking on the button provided in the Web browser, indicating that the Web page is taking a too long to load, the algorithm starts the process to locate the problem.
The irst check is made on the local client, by simply checking the CPU usage of the local machine and the ratio Tidle
Ttot. If the ratio exceeds a given threshold then the algorithm concludes that the
problem is in the local host.
Otherwise, if the local host does not present any problem, the algorithm performs a check on Thttp (average value over all the values corresponding to the different objects of the loaded Web page), by verifying if the cumulative statistics applied to this metric has exceeded a given threshold. Note that this metric can be considered as a rough approximation of the time required for getting the irst data packet from the remote Web server, thus in case it is normal it can be concluded that the problem is not in the network (neither local nor backbone) and neither is in the remote host. Hence, the algorithm performs a check, at irst, on the size of the Web page (verifying if the num-ber of objects/bytes of the page exceeds a threshold) and then, in case the Web page dimension is not responsible for the problem, it checks Ttcp and TDN Spossibly concluding that the problem is generated by the long distance towards the remote Web server or in the DNS server, respectively. Instead, in case Thttpis normal, the algorithm automatically excludes the DNS and the page dimen-sion cases and proceeds by requiring some cooperation from the other devices of the local network. In more details it ``asks'' the other devices to report any experienced problem.
At this point, there can be three distinct cases: all the other devices are experiencing some prob-lems, none of the other devices is experiencing any problem, and just some of the other devices are experiencing some problems, that is:
In case all the different devices are experiencing some problems the algorithm can directly exclude that the problem is due to the remote server (assuming that not all the devices are contacting the same remote server). Among the remaining cases (i.e., gateway, local network, middle boxes, and backbone network), the algorithm can assume that the problem is located, with high probability, close to the devices (otherwise probably not all the devices would experience problems) and thus it begins the diagnosis phase by checking the gateway and the local network. If the problem is neither in the gateway nor in the local network, it check the middle boxes. If the problem is not in the middle boxes, it concludes that the problem is in the backbone network (probably in the portion of the backbone that is close to the local network, given that all the local devices are traversing it).
2.6
Mobile network performance issue cause analysis
2.6.1
Use case introduc on
This scenario addresses the issue of identifying the root cause of problems related to connectivity and poor quality of experience on mobile devices. More speci ically, we explore how measurements that are collected at various points of the infrastructure can be used to automatically identify the reason for poor mobile network performance (e.g., video buffering, disconnections, poor browsing experience).
Identifying the root cause of poor connectivity on a device is not a trivial task. For instance, when a mobile device is trying to load a webpage or a video then any of the involved parties along the path of the information could be the bottleneck:
• Device issues: The user's phone might not be able to correctly load and display the content for various reasons: inadequate CPU or memory, missing codecs, lack of caching mechanisms, poorly con igured drivers, lack of hardware acceleration or even the wrong video quality was selected by the application.
• Mobile ISP issues: The user might be in an area with poor cellular reception (low SNR, with only limited physical modulations usable) or where no high-speed data connectivity is available (lack of HSPA support, limited physical bitrate available on the radio channel). In some cases (e.g., football games, concerts) there might be a very high demand at a given ge-ographic area that may affect a number of local users. Furthermore, incorrect settings at the RNC can result in long delays to connect to the network or alter the latency signi icantly. Fi-nally, the mobile operator might be running low in backbone capacity (e.g., when microwave links or old wired technologies are used) resulting in lack of capacity to carry data until the base station.
• Fixed ISP: If a device is connected via a ixed network (e.g., home via WiFi or ethernet) then traf ic from other devices in the same local network (e.g., connected to the same router) might be creating the problems. Furthermore, the ADSL router or the DSLAM might be miscon ig-ured or congested. Finally, the backbone of the ISP or the peering points with the service providers or the core network might be congested.
• Core network issues: The issue might be generated by a congested or badly con igured core network (routing issues), lack of peering points between the provider and the video hosting service.
• Service and CDN provider: : This includes issues with the content distribution network or the servers that support the service (e.g., congested video servers).
Due to the fact that these measurement probes rely on different legal and physical entities (e.g., user devices, ISPs, service providers) cannot freely exchange the collected information. Apart from de ining the measurement points and the algorithms that are required to identify mobile connec-tivity issues, a key challenge is the fact that it addresses issues related to data ownership, sharing and federation of the monitored information.
2.6.2
Descrip on of the associated analysis algorithms
As described, the mPlane platform involves a number of measurement agents that reside within different entities (e.g., user devices, the ISP where the device is connected, service providers) in order to discover quality of experience problems and identify the root cause along the path. 2.6.2.1 Overview of Measurements at each en ty
User’s Devices:
Instrumented applications provide measurements from the device and application point of view. For instance, a video application monitors “buffering” events that affect the perceived quality of service. A mobile device OS (e.g., laptop/phone) monitors the signal strength with the associated cell or WiFi station. Furthermore, the users can manually report problems that include subjective opinion about the network connections. This enables the platform to connect ground truth about the actual quality of experience. Finally, the device probe contains a troubleshooting engine that is responsible to combine the measured or reported information to detect and handle any network-related quality of experience issues. Furthermore, the troubleshooting engine is responsible to collaborate with the probes within other legal entities (e.g., ISP, service provider).
More speci ically, this probe:
• Allows the users to report “quality of service” issues related to their connectivity (by press-ing, for instance, a “my internet is not working properly” button). The information is used to identify local issues within the users’ device and to further forward this information to the involved ISPs and service providers. This also enables the providers to collect subjective ground-truth information about each application (e.g., what are accepted latencies for web content, what are acceptable speeds/qualities for video browsing. Finally, this information is then associated with the data that are gathered by the sensors and the network (e.g., are the users moving, are they at home connected to WiFi, are they in a speci ic geographic region?). • Contains various measurement probes that passively and actively collect
Measurements related to the application’s performance. For example, if a video player is loaded information such as number of events related to “buffering”, average bitrate, dropped frames etc. For web browsing, statistics about transferring, loading and rendering each com-ponent are collected. Finally, for a gaming application information such as latency and jitter are collected.
Measurements related to wireless connectivity: type of connectivity (e.g., edge, 3G, LTE, 802.11gm, Ethernet, ZigBee, Bluetooth), signal strength, disconnection history, association history, etc.
Network measurements: MAC layer and TCP/UDP statistics, bandwidth usage, etc. Device related statistics: CPU usage, memory usage, running apps, etc.
• Finally, a troubleshooting engine combines the measured data with the manual reports to cre-ate a mapping between the conditions that can lead to perceived quality degradation. Semi-supervised learning algorithms are used to automatically identify application issues with lim-ited user interaction. More speci ically, prior user-initiated reports are associated to speci ic
network conditions. When similar conditions are met (by the same or any other user), an au-tomatic report is generated without the user interaction. Notice that, in some cases the user might be probed for further feedback. Finally, a combination of static thresholds is used to also trigger an automated report (e.g., if number of buffering events exceeds a threshold). Mobile ISP :
If the device is connected to a cellular network, the provider uses an probe to troubleshoot issues from their point of view of the network. For example, to identify congestion in certain parts of the network (e.g., a tower) or to pinpoint underperforming middle-boxes within the network. As with the mobile device, a troubleshooting engine is responsible to collect and handle the measured infor-mation and the troubleshooting requests. Similarly with the device probe, the mobile ISP contains a module that:
• Passively collect information related to each base station: number of users, utilization, QoS policies.
• Passively collect information related to the backbone connectivity: utilization, TCP/UDP per-formance (RTT, loss rates, etc.).
• Passively collect information related to the performance any middle-boxes: web proxies, deep packet inspectors, routers, etc.
• Maintain the topology of the object exchanged so the path that was taken through the network can be traced if required by an inquiry.
• As with the previous probes, the troubleshooting engine is also used to automatically identify errors or investigate issues reported by the users’ mobile devices.
Wired ISP :
Similarly to a mobile ISP probe, the Wired ISP probes are responsible to identify issues within the ISPs network. For residential connections the home router is instrumented with a measurement probe to identify issues related to the quality of the local wireless and wired connectivity. Further-more, probes deeper in the ISP (e.g., DSLAM, routers, peering points) also provide measurements. As with the mobile device, a troubleshooting engine is responsible to collect and handle the mea-sured information and the troubleshooting requests.
• Instrumented gateway (router): Passively collect information related to:
The connectivity of each associated wireless and wired client of the home/business/public network (e.g., signal strength, utilization, bitrate, packet loss).
Information about the network status and load of the wireless and the wired interfaces (e.g., bandwidth utilization, loss rates, retransmissions, round trip times).
Information related to the con iguration of the router (QoS policies, allowed ports, access lists etc.).
• Similarly to the mobile ISP, the wired ISP installs probes across its own backbone to collect information related to the performance any middle-boxes, routers, peering etc.