JEAN-MICHEL DUSSAULT
EVALUATION DES PERFORMANCES
ÉCOÉNERGÉTIQUES DES TECHNOLOGIES DE
FENESTRATION INTELLIGENTE À OPACITÉ
VARIABLE
Mémoire présenté
à la Faculté des études supérieures et postdoctorales de l'Université Laval dans le cadre du programme de maîtrise en génie mécanique
pour l'obtention du grade de Maître es sciences (M.Sc.)
DEPARTEMENT DE GENIE MECANIQUE FACULTÉ DES SCIENCES ET DE GÉNIE
UNIVERSITÉ LAVAL QUÉBEC
2012
11
Résumé
Les travaux de recherche présentés dans ce mémoire font état des avancées réalisées concernant l'évaluation du potentiel des technologies de fenestration intelligente à opacité variable face à la réduction de la consommation énergétique dans les bâtiments. Pour ce faire un modèle numérique de bâtiment a été développé, puis les propriétés optiques des fenêtres intelligentes ont été optimisées afin d'atteindre un coût minimal de chauffage et de climatisation du bâtiment. Les recherches ont tout d'abord commencé par une estimation des performances des fenêtres intelligentes en analysant les résultats d'optimisation énergétique pour une semaine typique à chaque saison de l'année, et ce, pour un bâtiment situé au Québec considérant un mur avec fenêtre intelligente orientée au sud. Les résultats obtenus et présentés en 2011 dans le cadre d'une conférence sur les matériaux intelligents ont démontré la pertinence d'approfondir les recherches dans ce domaine. Par la suite, une étude plus détaillée des bénéfices des fenêtres intelligentes a été menée en précisant les résultats à chaque heure du jour pour une année complète, en utilisant un modèle de lumière naturelle plus réaliste et en évaluant l'impact de quatre orientations du mur avec fenêtre intelligente, i.e. nord, sud, est et ouest. Ces résultats ont fait le sujet d'un article de journal scientifique et permettent d'évaluer précisément les économies potentielles qu'une technologie de fenêtre intelligente peut entraîner. Enfin, une méthode expérimentale a été développée afin de caractériser l'ensemble des propriétés optiques d'une fenêtre intelligente nécessaires à la modélisation numérique. Cette méthode sera utilisée afin de caractériser les prototypes de fenêtres intelligentes développés au sein de l'Université Laval.
Ill
Avant-Propos
Le travail qui a été fait en amont et qui fut nécessaire à la concrétisation de cet ouvrage a essentiellement été réalisé par l'auteur de ce mémoire, Jean-Michel Dussault. Il s'agit essentiellement du développement des modèles, de la réalisation et la validation des algorithmes de programmation, des prises de mesures expérimentales, du traitement des résultats ainsi que l'écriture des textes. Ces travaux ont été supervisés par Louis Gosselin, directeur de maîtrise, ainsi que par Tigran Galstian, codirecteur, en ce qui concerne le développement expérimental et les concepts optiques.
Par ailleurs, les articles se retrouvant aux chapitres 2 et 3 de cet ouvrage ont été coécrits par l'auteur Jean-Michel Dussault ainsi que les co-auteurs Louis Gosselin et Tigran Galstian. Ces derniers ont agi dans le processus d'écriture des articles en tant que relecteurs et correcteurs afin d'assurer la qualité des documents finaux.
IV
Remerciements
Bien que seul mon nom se retrouve sur la page couverture de cet ouvrage, je tiens à souligner le fait que plusieurs personnes m'ont soutenu dans l'accomplissement de mes travaux de maîtrise, et ce, sans peut-être même l'avoir réalisé. C'est entre autres pour cette raison que je tiens à les remercier dans ces lignes.
Je tiens premièrement à remercier mon directeur de maîtrise, Louis Gosselin, qui m'a tout d'abord offert l'opportunité de réaliser une maîtrise au sein de son groupe de recherche et qui a aussi su m'écouter et m'orienter tout au long de mon cheminement. Les deux dernières années ont été pour moi synonymes de dépassements, d'accomplissements et de réussites, et c'est en grande partie grâce à ce dernier que j'ai eu la chance de vivre ces expériences. Sa passion envers la recherche en transfert thermique ainsi que l'intérêt qu'il a démontré envers mon projet de recherche ont définitivement été sources de motivation.
En second lieu, je tiens à remercier chaleureusement mon co-directeur de maîtrise, Tigran Galstian, qui a su apporter une dimension concrète au projet par la possibilité d'élargir ce dernier sur le plan expérimental. Chaque rencontre à son bureau s'est terminée par des discussions sur les différentes possibilités concrètes que pouvait prendre le projet, ce qui me m'a fortement motivé tout au long de la maîtrise.
Aussi, je tiens à remercier les différents intervenants de Multiver ltée qui se sont impliqués, soit Joel Gagné, Denis Cormier et Edgar Cormier, qui ont tous contribué à leur manière à mon développement professionnel en milieu industriel appliqué à mon domaine de recherche.
De plus, je remercie les organismes subventionnaires, i.e. CRSNG en 2010-2011 et FQRNT en 2011-2012 qui ont appuyé mon projet de recherche par l'entremise de bourses d'études, m'offrant par la même occasion une tranquillité d'esprit financière pour la réalisation de mes travaux.
Par ailleurs, je tiens à remercier tout particulièrement mes proches. Jean, Sylvie et Audrey, qui se sont montrés intéressés par mes projets, m'ont supporté tout au long mon cheminement et m'ont aussi fait décrocher lorsque nécessaire.
Finalement, la dernière personne que je tiens à remercier, mais non la moindre, c'est ma conjointe Stéphanie qui a, ces deux dernières années et ce bien malgré elle, vécu la somme des hauts et des bas de la recherche, de mes pratiques de présentation de conférence et de mes horaires étudiants déphasés, tous étant liés à mes travaux à la maîtrise. Sa bonne humeur contagieuse et sa confiance en mes aptitudes de recherche ont toujours été au rendez-vous.
VI
Table des matières
Résumé ii Avant-Propos iii Remerciements iv Table des matières vi Liste des figures viii
Liste des tableaux ix Nomenclature x Chapitre I Introduction I 1.1 Problématique I 1.2 Objectifs 2 1.2.1 Objectif principal 2 1.2.2 Objectifs secondaires 3 1.3 Développement du projet de recherche 3
1.3.1 Chapitre 2 - Article de conférence 4 1.3.2 Chapitre 3 - Article de simulations énergétiques 4
1.3.3 Chapitre 4 - Approche de caractérisation expérimentale 5
Chapitre 2 Article de Conférence 7
Abstract 8 2.1 Introduction 9 2.2 Smart window glazing in solar radiation control 10
2.3 Modeling 11 2.3.1 Heat transfer balance modeling 12
2.3.2 Daylight modeling 16 2.4 Models validations 17 2.5 Results analysis 19 2.6 Conclusion 21 Chapitre 3 Article de simulation énergétique 22
Abstract 23 3.1 Introduction 24 3.2 Heat transfer modeling 26
3.2.1 Building description 27 3.2.2 Integration of variable opacity filter 28
3.2.3 Internal heat gains 30 3.2.4 Mathematical modeling 31
3.3 Lighting modeling 32 3.3.1 Daylight modeling 33 3.3.2 Artificial lighting system modeling 35
Vil
3.4 Model verification 36 3.4.1 Energy balance verification 36
3.4.2 Daylight verification 37 3.5 Optimization approach 38 3.6 Comparison of optimized smart window performance with standard IGUs 40
3.7 Economical and design considerations 47
3.9 Conclusions 49 Chapitre 4 Approche de caractérisation expérimentale 5 1
4.1 Théorie 52 4.1.1 Radiation Solaire 53
4.1.2 Pondération spectrale 54 4.2 Méthodologie et résultats 55
4.2.1 Matériel nécessaire lors des différentes manipulations 55 4.2.2 Caractérisation de l'échantillon - spectre visible 56 4.2.3 Caractérisation de l'échantillon - propriétés spectrales à incidence normale 62
4.2.4 Caractérisation de l'échantillon - spectre solaire 66
4.2.5 Mesures de consommation électrique 72 4.3 Application numérique des mesures expérimentales 75
4.3.1 Bilan énergétique 75 4.3.2 Bilan lumineux 77 4.3.3 Consommation électrique de la technologie de fenestration 77
4.4 Discussions 79 Chapitre 5 Conclusion 80
Bibliographie 84 Annexes 87
Algorithme Matlab 1 : Modélisation 87 Algorithme Matlab 2: Optimisation 98 Algorithme Matlab 3: Expérimental 101 Extrapolation solaire-visible 103
Liste des figures
V l l l
Fig. 2.1 : Double glazed smart window
Fig. 2.2: Thermal circuit representation of the building with a smart window Fig. 2.3: Daily building mean total sensible load for each month of the year. Fig. 2.4: Total mean daily sensible heat loads for the first week of: a) January.
b) April, c) July, d) October. Fig. 3.1 : Double glazed smart window
Fig. 3.2: Thermal circuit representation of the building with a smart window
Fig. 3.3: (a) Daily building mean total sensible loads for each month of the year for a south oriented glazed wall, (b) Daily mean total daylight illuminance on workplane for each month of the
year for an east oriented glazed wall
Fig. 3.4: Daily building mean total sensible loads for each month of the year for a façade oriented, (a) north, (b) east, (c) south, (d) west
Fig. 3.5: Daily mean smart window filter opacity for each month of the year for an east oriented glazed wall
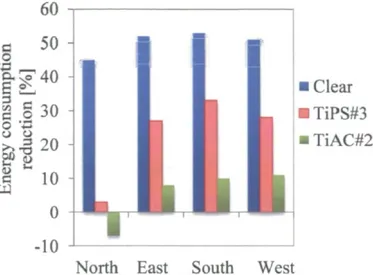
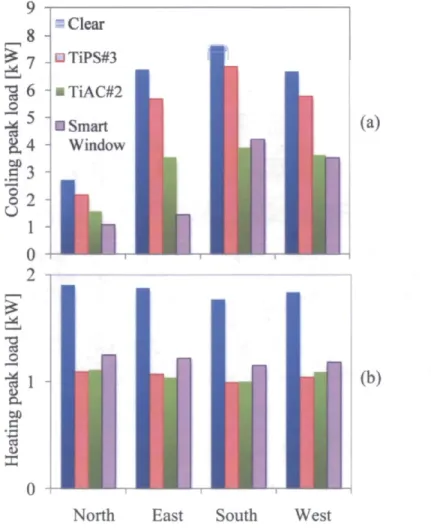
Fig. 3.6: Yearly total building energy consumption reduction with smart window Fig. 3.7: Building peak load, (a) cooling peak load, (b) heating peak load
Fig. 4.1 : Puissance d'émission spectrale d'un corps noir à 5777K, normalisé à 1367 W/m" Fig. 4.2: Montage expérimental pour la prise de mesures angulaires, (a) en transmission,
(b) en réflexion
Fig. 4.3: Représentation du montage pour l'obtention d'un faisceau de lumière blanche collimé Fig. 4.4: Mesures expérimentales et de référence angulaires à l'état El pour le spectre visible.
(a) en transmission, (b) en réflexion
Fig. 4.5: Mesures expérimentales et de référence angulaires à l'état E2 pour le spectre visible, (a) en transmission, (b) en réflexion
Fig. 4.6: Mesures expérimentales et de référence angulaires à l'état E3 pour le spectre visible, (a) en transmission, (b) en réflexion
Fig. 4.7: Mesures expérimentales et de référence angulaires à l'état E4 pour le spectre visible, (a) en transmission, (b) en réflexion
Fig. 4.8: Mesures expérimentales et de référence spectrales à incidence normale à l'état El, (a) en transmission, (b) en réflexion
Fig. 4.9: Mesures expérimentales et de référence spectrales à incidence normale à l'état E2, (a) en transmission, (b) en réflexion
Fig. 4.10: Mesures expérimentales et de référence spectrales à incidence normale à l'état E3, (a) en transmission, (b) en réflexion
Fig. 4.11 : Mesures expérimentales et de référence spectrales à incidence normale à l'état E4, (a) en transmission, (b) en réflexion
Fig. 4.12: Mesures expérimentales et de référence angulaires à l'état El pour le spectre solaire, (a) en transmission, (b) en réflexion
Fig. 4.13: Mesures expérimentales et de référence angulaires à l'état E2 pour le spectre solaire, (a) en transmission, (b) en réflexion
Fig. 4.14: Mesures expérimentales et de référence angulaires à l'état E3 pour le spectre solaire, (a) en transmission, (b) en réflexion
Fig. 4.15: Mesures expérimentales et de référence angulaires à l'état E4 pour le spectre solaire, (a) en transmission, (b) en réflexion
Fig. 4.16: Mesures expérimentales de consommation électrique de l'échantillon, (a) Tension (U), (b) Courant (I), (c) Puissance (Pe)
Fig. A. 1 : Ratio de transmission angulaire sur la transmission à incidence normale en fonction de l'angle pour 10 longueurs d'ondes évaluées pour des coefficients d'extinction réels Fig. A.2: Ratio de transmission angulaire sur la transmission à incidence normale en fonction de
l'angle pour 10 longueurs d'ondes évaluées pour des coefficients d'extinction approximés Fig. A.3: Ratio de transmission angulaire sur la transmission à incidence normale en fonction de
l'angle pour le spectre solaire et visible avec, (a) l'échantillon Sage Electrochromics à l'état El, (b) l'échantillon Sage Electrochromics à l'état E2. et (c) un verre teinté gris
10 15 IS 20 29 32 37 43 44 45 46 53 56 57 5 S 59 60 61 63 64 65 66 69 70 71 72 74 105 106 107
LX
Fig. A.4: Ratio de transmission angulaire sur la transmission à incidence normale en fonction de
l'angle pour le spectre solaire et visible avec un verre tinté bleu 108
Liste des tableaux
Table 2.1 : Energy saving and peak reduction results. 21 Table 3.1 Thermophysical properties of the materials 26
Table 3.2 IGUs general properties 41 Table 3.3 Total yearly building consumption per square meter of floor for different IGUs 45
Table 3.4 Smart window acceptable overrun costs for a return on investment period of 5 and 10 years, in $
per m" of glazing 48 Table A. 1 Longueurs d'ondes utilisées pour les calculs et leur coefficient d'extinction associés 104
Nomenclature
Lettres latines A C c d F G h i I k k' n P Pe O q" r R R" Ra Re T Tr l V y coefficient d'absorption propriété optique chaleur spécifique, J/kg K épaisseur de la couche de verre facteur de vue radiation solaire, W/m" coefficient de convection, W/m2 K taux d'intérêt, % courant électrique, mA conductivité thermique, W/m K coefficient d'extinction indice de réfraction poids spectral puissance électrique, W charge, W/m2 flux de chaleur, W/m" réflectivité résistance thermique, K/W facteur R, m2 K/Wratio solaire sur visible coefficient de réflexion température, K coefficient de transmission tension appliquée, V surcoût acceptable, $/m2 années
\ 1 Lettres grecques rt A. P 0 absorptivité émisivité longueur d'onde, m ou um densité, kg/m3 charge d'éclairage, W/m2 angle, ° Indices I 2 abs air clear cond conv cooling Air change diffuse direct E El E2 E3 E4 in floor gas glass heating
surface intérieure du verre extérieur surface extérieur du verre intérieur absorption
air ambiant
couche de verre clair 6 mm conduction
convection
système mécanique en mode de refroidissement changement d'air de l'échangeur de chaleur composante diffuse de la radiation solaire composante directe de la radiation solaire états de transmission
état à 62% de transmission visible état à 20% de transmission visible état à 6% de transmission visible état à 1.6% de transmission visible intérieur
masse thermique du bâtiment centre de la couche de verre
mélange air/argon de la cavité du vitrage verre du vitrage
xu HVAC out p r rad reg s sol surf SW t TiAC TiPS walls
système mécanique de chauffage, ventilation et climatisation extérieur pression constante réflexion radiation régression surface solaire
murs intérieurs et plafond filtre de fenêtre intelligente transmission
couche à faible émissivité Comfort TiAC sur verre clair 6mm couche à faible émissivité Comfort TiPS sur verre clair 6mm surfaces intérieures de la pièce
Chapitre 1 Introduction
1.1 Problématique
À l'ère où la protection de l'environnement est un sujet incontournable, il est devenu primordial de réduire notre consommation d'énergie. Puisque les bâtiments requièrent le tiers de toute l'énergie consommée dans les pays industrialisés, ils constituent un élément important à cet égard et offrent un potentiel important de réduction de consommation d'énergie. Abdeen mentionne qu'il est possible de réduire la consommation énergétique de 43% à l'aide de technologies déjà bien établies concernant le vitrage, l'isolation et la ventilation [1]. Ces réductions majeures ne se feront cependant pas sans recherche et développement pour diminuer les coûts qui s'y rattachent.
En étudiant les tendances d'urbanisation actuelles, on réalise que les métropoles se développent majoritairement par la construction d'édifices de grande envergure proposant une architecture orientée vers une enveloppe extrêmement vitrée composée de murs-rideaux. Or, puisque les fenêtres présentent des conductances thermiques très élevées, elles constituent le maillon faible de l'enveloppe du bâtiment au point de vue énergétique. Ces dernières font donc partie des éléments clés à améliorer pour réduire
considérablement la consommation d'énergie [2]. Il existe déjà quelques technologies émergentes [3] de vitrage permettant l'amélioration des performances des fenêtres. Parmi ces technologies, on compte les fenêtres à aérogel [4], qui offrent des résistances thermiques élevées, les fenêtres ventilées photovoltaïques [5], qui limitent les pertes de chaleur par convection contrôlée et fournissent une source d'énergie renouvelable, ainsi que les fenêtres intelligentes à opacité variable [6-15], qui contrôlent la quantité d'énergie solaire transmise par les fenêtres. Parmi ces technologies, les fenêtres intelligentes à opacité variable offrent le plus grand potentiel d'adaptation face au rayonnement solaire [16]. Elles s'adaptent aux conditions extérieures et intérieures, afin de réduire considérablement la consommation énergétique annuelle des bâtiments. Toutefois, les recherches sur différents types de technologies de fenêtres à opacité variable sont encore nécessaires, afin d'optimiser leur efficacité, d'évaluer leur durée de vie et de réduire leur coût.
C'est dans ce contexte que ce mémoire présente les avancées de recherche réalisées afin d'évaluer les performances énergétiques des technologies de fenestration à opacité variable. La méthodologie de recherche est présentée à la section 1.2 sous la forme d'objectifs secondaires, de même qu'à la section 1.3 au fur et à mesure que les différentes sections de ce mémoire sont présentées.
1.2 Objectifs
1.2.1 Objectif principal
L'objectif principal de ce mémoire est d'évaluer le potentiel des technologies de fenestration intelligente quant à l'amélioration du rendement énergétique des bâtiments en ce qui concerne leurs charges de chauffage et de climatisation. Pour ce faire, les recherches ont été orientées vers une optimisation de la propriété contrôlable de ces technologies, i.e. le taux de transmission de rayonnement électromagnétique, dans le but de minimiser les coûts de consommation énergétique annuels.
1.2.2 Objectifs secondaires
De manière à atteindre l'objectif principal de recherche, les objectifs secondaires poursuivis dans le cadre des recherches qui sous-tendent ce mémoire sont de :
♦ Concevoir un modèle de bâtiment intégrant l'ensemble des paramètres se retrouvant généralement dans les bâtiments en situation réelle.
♦ Implémenter le modèle développé dans un algorithme numérique puis en faire la validation à l'aide de logiciels de simulation énergétique de bâtiments.
♦ Utiliser le modèle afin de procéder à une minimisation de la consommation énergétique annuelle en fonction de l'opacité du vitrage en tenant compte des conditions extérieures, du système HVAC et de l'éclairage.
♦ Développer une stratégie de réduction des temps de calculs associés aux optimisations des performances énergétiques sur une base annuelle.
♦ Développer une méthode de caractérisation expérimentale d'échantillons de fenêtre à opacité variable, de manière à pouvoir éventuellement utiliser des données expérimentales dans les modèles développés
1.3 Développement du projet de recherche
Les résultats de recherche présentés dans les chapitres 2 et 3 de ce mémoire sont présentés sous forme d'articles ayant fait, respectivement, l'objet d'une conférence scientifique et d'une soumission à une revue scientifique avec comité de lecture. Le chapitre 4 décrit ensuite la méthodologie et les résultats obtenus dans le cadre des travaux de recherche expérimentale amorcés pendant mon projet de maîtrise.
Les sous-sections 1.3.1 à 1.3.3 introduisent les travaux contenus dans chacun de ces chapitres ainsi que les liens entre ces derniers afin d'illustrer clairement l'évolution
du projet de recherche et l'atteinte de l'objectif principal ainsi que des objectifs secondaires.
1.3.1 Chapitre 2 - Article de conférence
Cet article, ayant fait l'objet de l'édition 2011 de la conférence intitulée « International Workshop on Smart Materials & Structures and NDT in Aerospace », présente les résultats de consommation énergétique entre un bâtiment intégrant un vitrage composé de verre clair, i.e. vitrage de référence, et un bâtiment intégrant une technologie de fenêtre intelligente. Dans les deux cas, l'orientation du mur vitré est plein sud. Dans cet article, une description du fonctionnement des fenêtres intelligentes est faite et un modèle de bâtiment intégrant ces technologies est présenté. Les résultats obtenus sont établis sur la base d'une optimisation des propriétés du vitrage intelligent considérant le modèle développé. En raison des temps de calcul considérables pour l'optimisation des résultats, l'analyse a été effectuée à partir d'une semaine typique pour chaque saison de l'année pour en arriver à une projection approximative des performances annuelles potentielles.
La réalisation de cet article a permis d'atteindre les deux premiers objectifs secondaires présentés à la Section 1.2.2 et d'évaluer l'intérêt d'approfondir les recherches afin d'atteindre le troisième objectif de cette même section. Le modèle de bâtiment développé dans le cadre de cet article représente une version préliminaire de l'Algorithme Matlab 1 présenté en annexe.
1.3.2 Chapitre 3 - Article de simulations énergétiques
Cet article de journal scientifique présente l'amélioration des performances énergétiques annuelles liées à l'intégration de fenêtres intelligentes dans les bâtiments pour des murs vitrés orientés au nord, à l'est, au sud et à l'ouest. Cet ouvrage présente dans un premier temps une revue exhaustive de la littérature à l'égard des technologies de fenestration antérieures, présentes et à venir. Le modèle de bâtiment présenté intégrant les fenêtres intelligentes se base sur le modèle développé et utilisé dans l'article du chapitre 2
avec différentes améliorations, telles que l'intégration d'un modèle d'éclairage naturel et artificiel plus sophistiqué et validé avec le logiciel de simulation commercial eQUEST 3-63. De plus, afin de réduire les temps de calcul pour l'optimisation annuelle de la consommation énergétique, une stratégie d'optimisation est développée afin de minimiser le nombre de variables de design pour chaque optimisation tout en considérant l'effet transitoire de la masse thermique du bâtiment qui oblige un nombre minimum de ces variables. Suite aux résultats d'optimisation, une analyse de performance énergétique rigoureuse est présentée comparant les fenêtres intelligentes aux technologies de fenestration actuelles les plus performantes. En parallèle, une analyse économique est menée afin d'évaluer la viabilité des fenêtres intelligentes. Enfin, suite aux analyses effectuées, les meilleures stratégies en conception de bâtiment intégrant des fenêtres intelligentes sont proposées.
Les travaux de recherche en lien avec la réalisation de cet article ont permis de couvrir plus en profondeur les deux premiers objectifs secondaires de la Section 1.2.2 à l'aide de l'Algorithme Matlab 1 présenté en annexe. Par ailleurs, ces travaux ont couvert les troisièmes et quatrièmes objectifs secondaires à l'aide de la stratégie d'optimisation annuelle basée sur l'Algorithme Matlab 2 présenté en annexe à la suite du premier algorithme.
Il est à noter que cet article présente dans ses premières sections certains éléments de modélisation déjà couverts au chapitre 2. Toutefois, de manière à assurer au lecteur un suivi adéquat des bonifications apportées à la modélisation, l'article de journal scientifique faisant l'objet du chapitre 3 est présenté intégralement dans ce mémoire.
1.3.3 Chapitre 4 - Approche de caractérisation expérimentale
Le Chapitre 4 présente les résultats de mesures expérimentales réalisées sur un échantillon commercial, afin de valider la précision de ces mesures avec des résultats de référence de l'industrie et disponibles dans les banques de données spécialisées telles qu'IGDB (International Glazing DataBase).
En raison des équipements disponibles pour effectuer les mesures, certains résultats ont été extrapolés à l'aide des mesures prises. Ces mesures consistent en des mesures au spectromètre de transmission et de réflexion à incidence normale pour les longueurs d'ondes du spectre solaire, de même qu'en des mesures globales de transmission et de réflexion angulaires pour les longueurs d'ondes du spectre de la lumière visible. N'ayant aucune source lumineuse de rayonnement solaire au moment de la prise de mesures, les résultats globaux de transmission et de réflexion angulaires pour des longueurs d'ondes du spectre solaire ont été évalués grâce à la tendance angulaire du spectre visible et aux ratios de transmission et de réflexion (solaire/visible) obtenus par l'intégration pondérée des résultats spectraux à incidente normale.
Ce chapitre a permis d'atteindre le cinquième et dernier objectif secondaire de la section 1.2.2. L'extrapolation des résultats solaires globaux a nécessité le développement de l'Algorithme Matlab 3, présenté en annexe, pour le calcul du poids spectral de chaque longueur d'onde du spectre solaire et du visible. Les résultats mesurés et extrapolés présentés dans ce chapitre ont pour but d'être intégrés dans le modèle numérique de bâtiment développé et présenté dans les chapitres précédents. Ainsi, la performance énergétique de nouveaux prototypes de fenêtre intelligente développés au sein de l'Université Laval pourra être évaluée en combinant les recherches faites dans les chapitres 2 et 3 avec les recherches présentées au chapitre 4. La validation des hypothèses émises dans ce chapitre est présentée en annexe à la suite des trois algorithmes Matlab.
Chapitre 2 Article de Conférence
Titre
ASSESSMENT OF BUILDING ENERGY EFFICIENCY WITH SMART WINDOW GLAZING CURTAIN WALLS
Co-auteurs
Jean-Michel Dussault, Louis Gosselin, Tigran Galstian
Conférence
Abstract
The purpose of this paper is to investigate the potential of diminishing the energy consumed for heating, cooling and lighting buildings using smart windows. The windows considered consisted of a double pane glazing unit in which an absorbing layer is added on the interior surface of the exterior glass pane. This absorbing layer allows to change the optical properties of the window, resulting in a direct potential of control of the incident solar heat flux entering the building through the windows. In this paper, a numerical model is developed and it is shown that optimizing the solar heat flux absorption rate of the absorbing layer in regard of the necessary heating, cooling and lighting contributes to reduce significantly the total yearly energy consumption, and cooling peak loads.
2.1 Introduction
Since environment protection is now an unavoidable subject, it has become a priority to reduce our energy consumption. Buildings, consuming more than one third of the overall energy worldwide, present a huge potential of energy consumption reduction [3]. Over the last years, building design has been oriented toward the optimization of energy usage, the protection of the environment and the occupants' comfort. On the other hand, current urban development involves the construction of large office buildings with huge percentage of glazed areas. This architectural trend involves important challenges with respect to the reduction of building energy consumption since glazing constitutes one of the less efficient components of the building envelope energywise.
The poor energy efficiency of glazing compared to the other components of the envelope offers great opportunities to develop new glazing technologies that are more energy efficient. There already exist emerging technologies aiming to improve glazing performances in regard to environment, energy consumption and comfort. Among these technologies are smart windows that manage solar heat flux entering buildings by controlling the glazing opacity, "aerogel" glazing [4] that provides a very high heat transfer conduction resistance and ventilated photovoltaic glazing [5] that limits heat transfer with the help of controlled convection and supplies an additional amount of renewable energy. Smart windows are defined as glass technologies whose optical properties change when a voltage is applied. Electrochromic [6] and liquid crystals [7] glazings are two main examples of smart window technologies.
The technologies offering the highest potential of adaptation in regards to solar radiation are the smart windows [16]. Since solar radiation represents a huge contribution to the building overall energy balance, further studies on smart windows might result in important breakthroughs in building energy efficiency improvement. This article presents the modeling of a simplified building with integrated smart window glazing and the results of opacity optimization to achieve minimal energy consumption.
10 2.2 Smart window glazing in solar radiation control
As mentioned above, different types of smart window technologies exist. These technologies have their own optical properties that can vary significantly from one another. Among these optical properties, the way of controlling how much solar radiation penetrates the building has probably the most impact on the resulting building energy consumption. For instance, some smart window technologies control solar radiation by absorption while others control it by reflection or, less efficiently, by scattering. For example, polymer dispersed liquid crystals (PDLC) smart windows scatter light passing through because of the difference of refraction index between polymers and liquid crystal droplets. The PDLC layer is held in place by two transparent conductive layers, generally made of ITO (indium tin oxide). When a voltage is applied between the ITO layers, liquid crystals tend to align with the electric field. This creates a media of uniform index of refraction that allows light to pass without scattering.
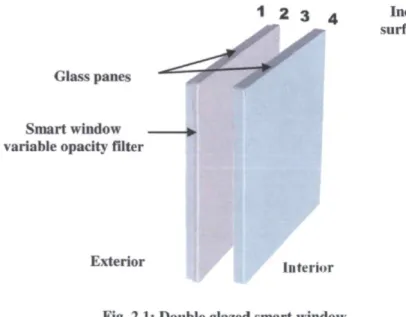
1 2 3 A Indication of surface number Glass panes
Smart window ». variable opacity filter
Exterior Interior Fig. 2.1: Double glazed smart window
Since the purpose of this paper is to present the potential of smart window glazing in general, we will focus our attention on a generic smart window controlling solar radiation by absorption rather than working with a specific smart window technology. This control is achieved with a variable opacity filter inserted in-between the glass panes. In the present case, the term "opacity" refers to the solar absorption rate of the filter. In the glazing industry, each glass pane surface is given a number in relation to its order,
11 starting from the exterior surface. Fig. 2.1 illustrates the surface indices of a double glazed window and the surface on which the opacity filter is fixed on (surface 2).
As shown in Fig. 2.1, the variable opacity filter is fixed to the inner surface of the outer glass pane (surface 2). This decision is taken mainly for two reasons. First, the filter needs to be installed on an inner surface (2 or 3) for protection (e.g., against direct UV, scratching, etc.). Second, during solar radiation peak hours in summer, the filter will absorb a huge amount of energy resulting in an important increase of the filter temperature. Due to higher exterior convection coefficient, it will be easier to dissipate the heat outside of the building with a hot surface 2 than it would have been with a hot surface 3. This way, we assure a more reasonable range of temperature operation for the variable opacity filter. A variable opacity filter fixed on surface 3 and having a high temperature may also cause discomfort for occupants close to windows.
Finally, for opacity changes, smart windows require an electric potential. In other words, we need to provide electrical energy to smart windows in order to reduce the overall energy consumption. Fortunately, the amount of electrical energy required to operate the variable opacity filter can be negligible compared to the building load savings. Also, different renewable energy sources could be used for energy supply such as window frame integrated photovoltaic panels. For these reasons, smart window energy consumption will be omitted in the present case study.
2.3 Modeling
The advantage of smart windows is their ability to adapt to the exterior and interior conditions in order to reduce the resulting building energy consumption and/or peak loads. The control of a smart window to reduce overall energy consumption involves a tradeoff between the energy required for heating and that required for lighting, since preventing solar radiation from penetrating within the building reduces the heating requirement (beneficial) but might also call for more lighting (detrimental). Therefore, the following sub-sections describe the model developed to determine the heat transfer
12 rate between the building and the environment through a smart window, and the model developed to establish the daylight level on workplanes depending on window features.
2.3.1 Heat transfer balance modeling
The goal of the thermal model is to calculate the total heat load (QHVAC) that the
heating, ventilating and air conditioning (HVAC) system must supply to keep the inside air temperature at a set-point value for a typical office building zone. Modeling and analysis have been performed with Matlab.
The building zone considered consists of a single room with one totally glazed external wall (eWindow=0.84), and 5 internal surfaces (i.e., 3 internal walls, a floor and a ceiling) which are assumed to only exchange heat with the considered building zone (£surf=0.9). The model also considers a thermal mass included in the 50.8 mm thick floor slab (pfioor=2400 [kg/m], cp.flOor=1085 J/kgK). The room dimensions are 5 m width by 5 m deep by 3 m high. For simplicity, the interior walls and the ceiling are assumed to be at the same temperature as the interior air, Twans =Tin=20 °C. The exterior wall is a double glazed window (kgiass=1.38 W/mK) with a 6.3 mm thin air gap (kair=0.024069 W/mK, aair=17.64xl0"6 m2/s, yair=21xl0"6 m2/s).
Solar radiation had been modeled considering that the exterior wall faces south and that the building is located in Quebec City, Canada, i.e.: latitude = 47° North, longitude = 71° West. Furthermore, the glass slabs constituting the external glazed wall are clear glass (no added tint or low emission layers) for a matter of clearly isolating the effect of the variable opacity filter. The model assumes that the direct solar radiation passing through the window is distributed uniformly over the floor area and the diffuse solar radiation is distributed over the floor, ceiling and internal walls weighted by the appropriate view factors. Moreover, solar radiation is assumed to be totally absorbed by internal surfaces and then reemitted in the infrared wavelengths which are considered to be absorbed by the window, meaning that the window is considered as an opaque surface for internal radiation. Also, since internal walls and ceiling are at the same temperature, they are considered as a single surface in the radiation balance calculations. Solar
13 radiation entering the building is then accounted in the overall energy balance in the form of additional heat sources applied to the glazing (QSoiargia/.ing), to the walls/ceiling surface
(Qsolarwalb) and to the floor (Qsolar
floor)-The external glazed wall is subject to exterior convection, hou,= 14 W/m2K [17], and external temperature variations depending on the hour of the day and the day of the year. The exterior temperatures used for the calculations are the ones for the year 1995 found in the eQUEST 3-63 weather database. The interior walls and ceiling are subject to interior convection, hin=8 W/irrK, and the air-to-floor convection coefficient is hfioor=l W/m2K.
For simplicity, the main modeling assumptions are: 1- ID heat transfer through the glazed wall 2- No window frame has been considered
3- There are no thermal bridges in the building envelope 4- No spectral consideration for material properties
5- Angular optical properties for window glass panes are considered
6- The variable opacity filter is assumed to have no angular optical properties dependence (Since angular optical properties can be corrected by the state of the opacity filter during optimization)
7- All interior surfaces are adiabatic, i.e. no exchange with other zones of the building
8- Interior surfaces reflect radiation diffusely 9- The room occupancy is 3 persons
10- Interior air temperature is constant throughout the year 11- Latent load is not considered
12- The only thermal mass considered is that of the floor (There is no thermal mass considered in the ceiling since suspended ceiling is assumed for modeling)
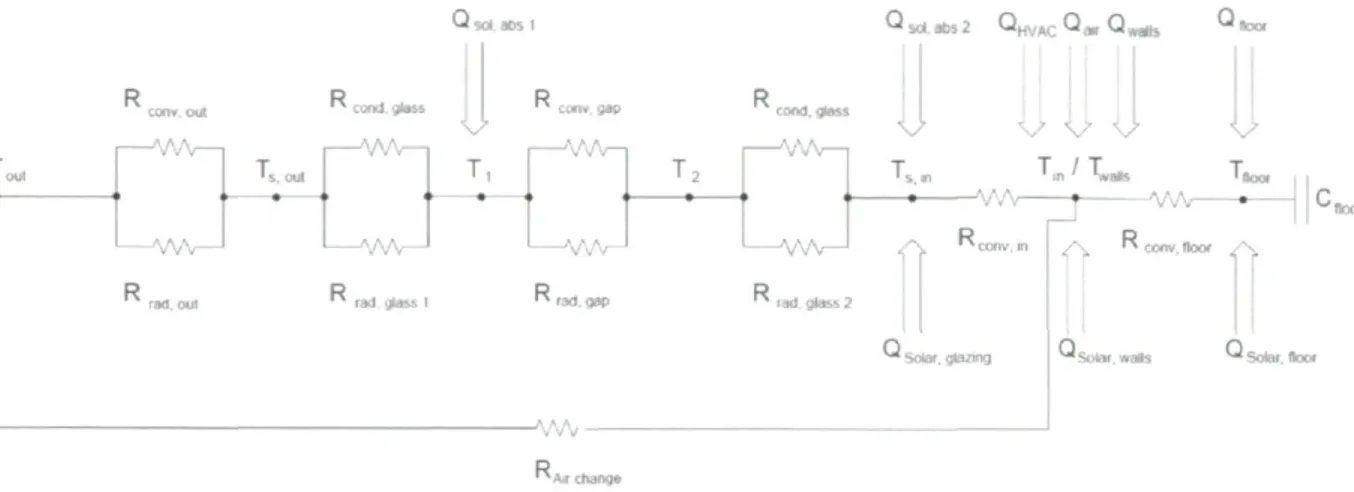
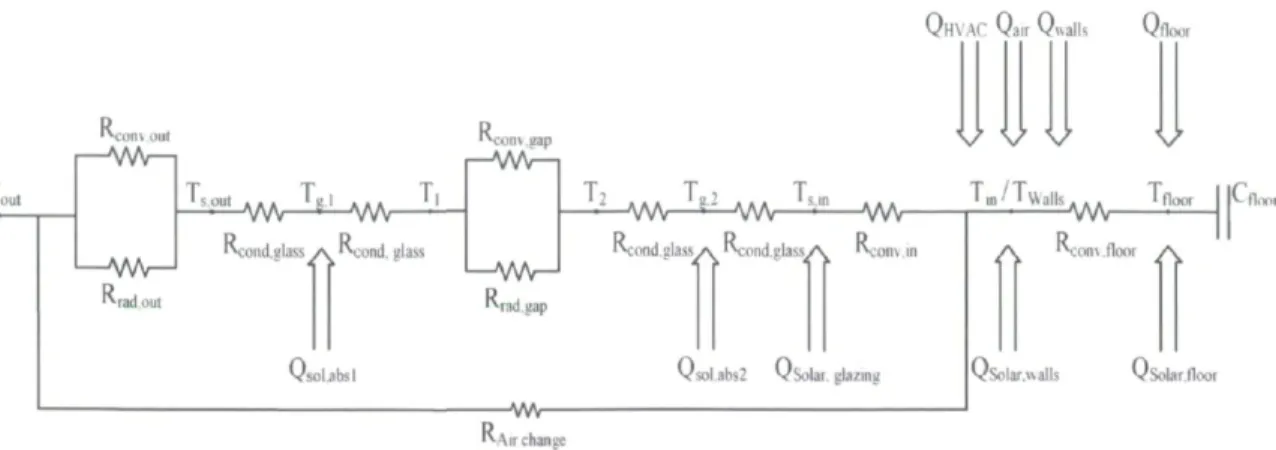
Fig. 2.2 shows a thermal circuit of the system considering thermal nodes (T .), thermal resistances (R...), thermal mass (Qioor) and internal heat sources (Q.J
14
The methodology used to obtain QHVAC consists in performing an energy balance
at each node of the circuit, grouping the resulting equations into a matrix equation, and solving for the unknowns (i.e., Ts>out, Ti, T2, Ts,jn, QHVAC and Tfl0Or).
The thermal effect of lighting separates in two distinct phenomena, i.e.: a portion of energy required for lighting is directly transformed into heat transferred to the room (Qiight. conv) while the other portion corresponds to the radiation emitted by the lighting devices (Qnght, rad walls and Qnght, rad noor)- Depending of the lighting device, convective and radiative portions will be different. In this study, we will consider standard fluorescent tubes with 59% of radiative lighting and 41% of convective lighting with fixtures having a 20% heat-to-return [18]. In order to determine radiative heat flux reaching each internal surface, we assume a total lighting power spread uniformly over the ceiling surface and emitted diffusely. The total artificial lighting power considered for calculation is 586.3 W. This value guarantees that the minimum illuminance value is respected during occupancy hours. Please note that more efficient lighting systems are available nowadays, meaning that results of this study could overestimate lighting loads.
The other internal heat gains are from occupants and miscellaneous equipments. For both these gains, we considered 30% of convective heat gain (Qoccupants, conv and
Qmiscellaneous. conv) a n d 7 0 % OI r a d i a t i v e h e a t g a i n (Qoccupants, rad walls* Qoccupants. rad floor* Qmisceiianeous. rad walls, a n d Qmiscdianeous, rad floor)- E a c h o c c u p a n t is a s s u m e d to g e n e r a t e a t o t a l
of 73 W and we supposed a miscellaneous equipment power surface density of 8W/m2 [18].
conv out -VA—■ -VS.—i A A -1 15 Q s _ _ » 2 QHVAC Q» Q , T
> o
".--' » ".--' T»__ Tfc -• V A ?— —-VA •-.A—1 ^ ' conv, floor y VR
■^Air change
Fig. 2.2: Thermal circuit representation of the building with a smart window
Internal heat gains are represented in Fig. 2.2 by Qair, Qwaik and Qnoor- These quantities are related by:
^ a i r f l i g h t . c o n v ^occupants.conv ^miscellaneous,conv
^ t w a l b ^ c light.rad_ walls ^occupants.rad_walls ^miscellaneous.rad_walls
^ f l o o r ^ t light.rad_floor ^occupants.rad _floor ^miscellaneous,rad_floor
(2.1) (2.2) (2.3)
The schedule for internal heat gains follow the occupancy hours that are from 8 AM to 5 PM. Occupation rate is assumed to be 100% during occupancy hours. The presented schedule has been selected as a start point to obtain results, but more sophisticated schedules could easily be used for precise building applications.
The makeup air, i.e. the fresh air entering the building zone, is represented in Fig. 2.2 by the air change resistance (RAir change) and considers a rate of 20 cfm/person necessary during occupancy hours. Furthermore, a heat exchanger had been considered with an efficiency of heat recovery of 60%.
Solar absorption by the glazing panes and variable opacity filter is represented in Fig. 2.2 by Qsoi, absi and QSOi,abs2- Their relations are the following:
Qsol.absl = 'ap a n e l + ttfilter )Qsolar ( 2 - 4 )
Qsol,abs2 — ^pane2 ' Vsolar _ ^sol.absl ) (^--O
where apanei and apane2 correspond to absorption rates of the exterior and interior window glass panes, respectively, ar,iter to the absorption rate of the variable opacity filter and QSoiar to the total incident solar radiation power.
2.3.2 Daylight modeling
The daylight model allows to evaluate the amount of visible solar irradiation incident on the plane of interest. In the present case, the global solar illuminance in the room, Ls, is calculated on the floor with the following relation:
r V _. /-• 13 T ^D~D^D-™Directly_lighted T T , I /I n\
Ld =KdXdGdFwi„ d o w / ,1o o r ' LD = " L-S = S L> L S =LD +Ld (2- 6 ) Afloor
where L_ and LD are the diffuse illuminance and direct illuminance, respectively. The value used for the diffuse luminous efficacy (K<0 is 123 lumen/W and for the direct luminous efficacy (KD) is 102 lumen/W [19]. T_ and TD are the overall transmission coefficients for diffuse and direct irradiations, Gd and Go, the diffuse and direct solar irradiations, Fwindow/fioor, the view factor from the glazed wall to the floor and Aoirectiy lighted and Afioor» the surfaces of the floor area lighted by direct sunlight and the total floor area, respectively. The overall transmission coefficients mentioned above are obtained by:
^d ~ ^glazing.dC _ afilter) ^D = ^glazing.D ( ' _ ^filter ) ( 2 . / )
where xgiazing.d and xgiazing.D are the transmission coefficient for diffuse and direct solar irradiations, not considering the variable opacity filter.
17 The main assumptions for the daylight model are:
1 - Direct illuminance is spread uniformly over the entire floor area 2- Diffuse illuminance falls on each interior surface uniformly 3- There is no spectral consideration for material properties 4- Daylight reflections into the room are not considered
The fact that diffuse illuminance is assumed to fall on interior surfaces uniformly is a coarse approximation. Further studies on the subject will consider a more sophisticated sky illuminance.
2.4 Models validations
This paper presents results of smart window opacity optimization to reduce the global building energy consumption. In order to obtain valid results, one must evaluate the performance of the given models to represent realistic situations. To do so, the energy balance model developed was compared with the extensively used building energy simulation software eQUEST 3-63.
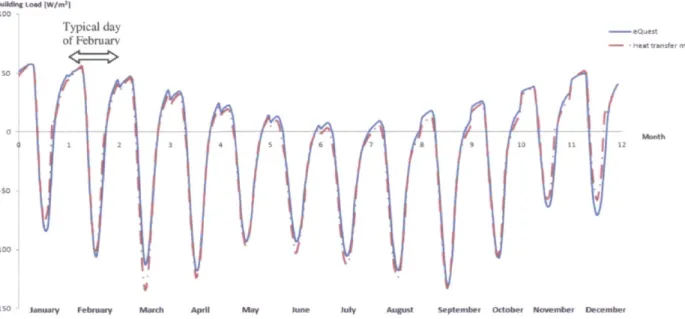
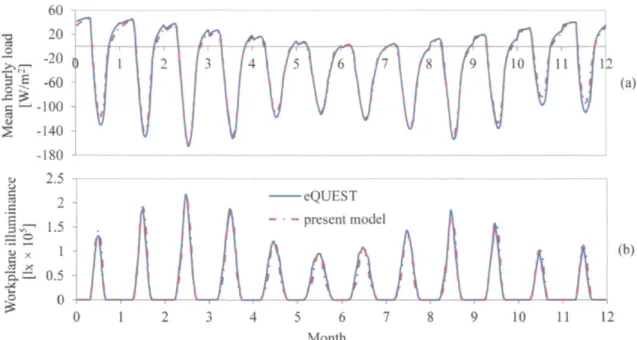
Results have been obtained in eQUEST 3-63 modeling a building with properties that were as close as possible to the ones used in the heat transfer model with otniter=0. Hour-by-hour heating and cooling load results have been achieved for an entire year. To present these results in a convenient way, averages for each hour of the day for each month of the year have been calculated and are presented in Fig. 2.3. For example, the horizontal arrow in Fig. 2.3 illustrates the time range for an average day of February.
Figure 2.3 shows that results obtained with the heat transfer model are in good agreement with results obtained with eQUEST 3-63. Maximal differences between the two curves are of the order of 10% in heating conditions and 2% in cooling conditions. These differences can be explained by the different model assumptions. For example, eQUEST 3-63 considers thermal mass in every material even if the value is small versus the present heat transfer model that takes into account only the thermal mass of the floor
18 slab. Also, the heat transfer model assumes that the solar energy absorbed by glass panes 1 and 2 is concentrated on surfaces 2 and 4, respectively, resulting in a more important heat transfer toward the interior. This effect can be seen in Fig. 2.3 by the results of the heat transfer model that are slightly lower than the ones obtained by eQUEST 3-63 which is more easily observed between March and September when solar radiation is of greater importance. Nevertheless, since the goal of this paper is to assess the performance of a new building envelope technology and because of the simplicity of the model, perfect agreement with eQUEST 3-63 is not required at this point.
Buiidinc L_KI [w/m*]
IOC
eQuest Heet transfer model
1 5 0 January February August September October November December
Fig. 2.3: Daily building mean total sensible load for each month of the year.
The daylight model presented in this paper has been kept very simple since, in the present research, the emphasis is on the energy consumption reduction rather than on the detailed distribution of visible light on workplane. Nevertheless, the model gives a realistic representation of interior solar illuminance and the order of magnitude of the daylight results have been verified, which is required to obtain valuable results. Further works will focus on the integration of a more sophisticated daylight model into the energy efficiency building optimization.
2.5 Results analysis
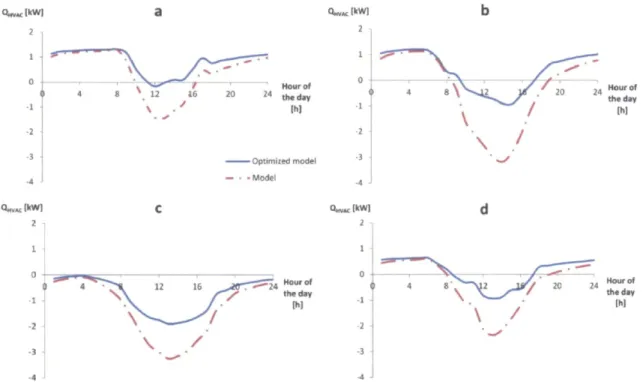
The potential for energy reduction varies with weather conditions. To assess the performance of the smart window glazing technology, optimization runs have been performed for a complete week of each season, i.e.: winter (lsl to 7th of January), spring (1st to 7th of April), summer (Ul to 7th of July) and fall (1st to 7th of October). The design variables were the percentage of opacity of the variable opacity filter (i.e., afii,er), and the utility factor of the artificial lighting system (i.e., Fu) at each hour of sunlight and occupancy, respectively, of the weeks considered. The bounds of the design variables are: 0< otfjiter^l and 0< Fu<l. The constraint was to have a minimum of 400 lux of light on workplane during working hours with combined artificial and natural lighting and the objective function to minimize was the energy consumption cost. The optimization procedure relies on Matlab "fmincon" tool.
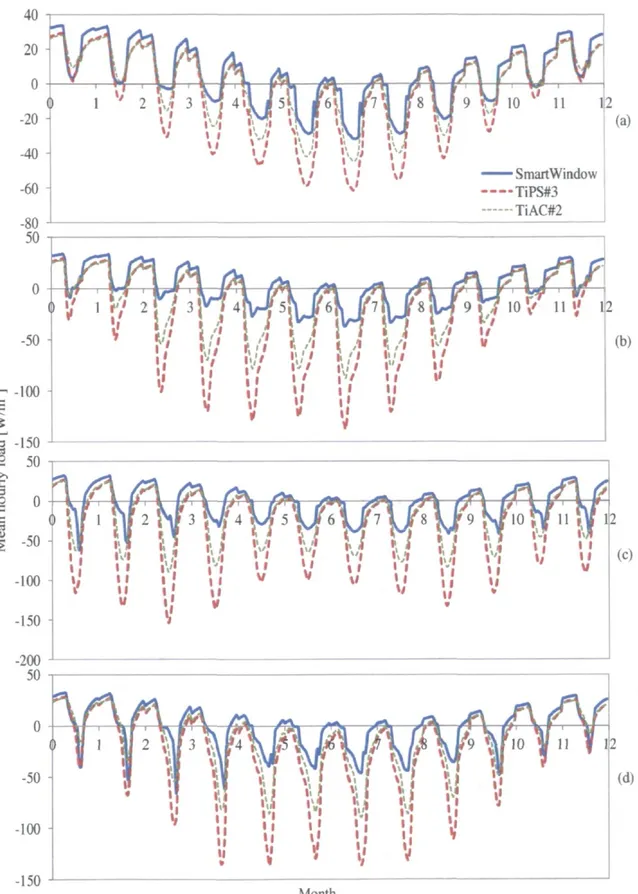
Results of optimization have been compared with reference values for design variables, i.e.: a complete transparent state of the variable opacity filter and lights fully on during occupancy schedule. Fig. 2.4 compares the daily heat load of the optimized and unoptimized models for each season. Negative values of QHVAC represent cooling loads
and positive values of QHVAC represent heating loads.
Figure 2.4 clearly illustrates that optimizing the design variables (i.e., opacity) helps reducing the overall energy consumption as well as the cooling peak loads for each season of the year. We assumed a cost expressed by:
Cost[$] = EnergyCost[$/kWh] • (ArtificialLighting[kWh]+|QHVAC|[kWh]) (2.8) where
QHVACcooBnIkWh]
QHVAC = — when the system is in cooling mode
C O P (2 91
^-wl cooling .system K*--?)
20
With an energy cost of 0.08$/kWh (energy cost for Quebec, Canada) and a COPCOOiing=3, we can evaluate the potential of energy consumption reduction and cooling peak loads for each season. Results are shown in Table 2.1.
Fig. 2.4: Total mean daily sensible heat loads for the first week of: a) January, b) April, c) July, d)
October.
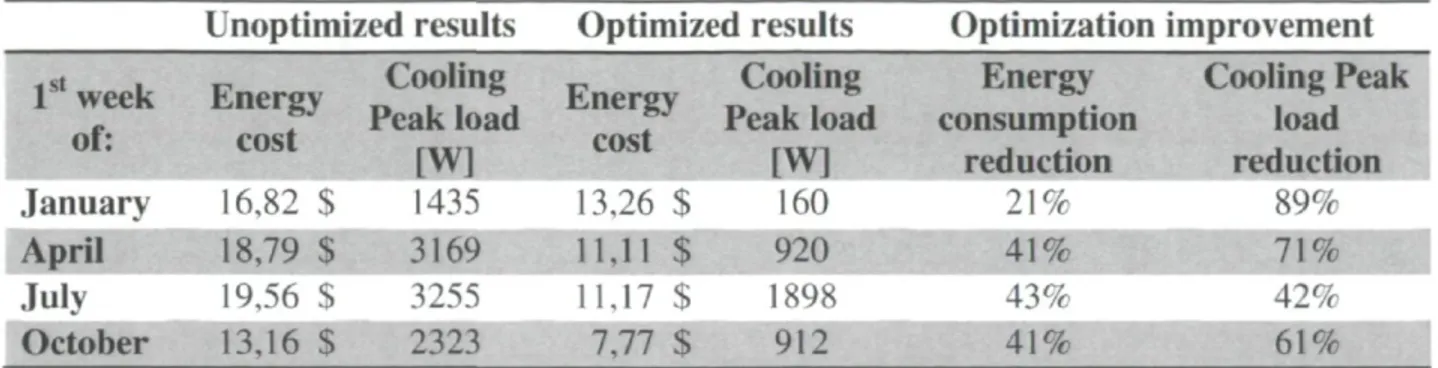
With the help of Table 2.1, we see that results of energy savings are promising with at least 20% of savings during winter and a little more than 40% during other seasons. Since results have been obtained with data for only one particular week of each season, we cannot estimate precisely the yearly energy consumption. Still we can predict that the overall energy consumption reduction will be of the order of 35% by mean calculation for the type of building considered. Also, optimization results show an important reduction of cooling peak loads with a minimum reduction of 42%. This could be of great importance for energy consumers the electricity bill of which is based on peak consumption. Also, peak reduction allows to install smaller HVAC equipments which results in additional savings. Further works will evaluate more precisely these savings with a more sophisticated daylight model and an optimization of the design variables throughout the entire year.
21
Table 2.1: Energy saving and peak reduction results.
Unoptimized results Optimized results Optimization improvement 1st week of: Energy cost Cooling Peak load [W] _, Cooling E n e rf Peak load cost [ W ]
Energy Cooling Peak consumption load reduction reduction January 16.82 S 1435 13.26 S 160 21 % 89% April 18,79 $ 3169 11,11 $ 920 41% 71% July 19.56 $ 3255 11.17 S 1SMK 43% 42% October 13,16 $ 2323 7,77 $ 912 41% 61% 2.6 Conclusion
In this paper, two models have been developed to evaluate the performance of smart windows (whose technologies are based on an absorbing layer) in order to reduce the overall yearly energy consumption of buildings. Results of the optimization of the design variables have shown that the integration of this glazing technology enhances considerably the buildings energy efficiency. It is shown that energy required for lighting, heating and cooling can be reduce up to around 20% during winter and more than 40% during warmer seasons.
This initial investigation is part of a larger research project aiming to predict the energy performance of new smart window technologies and to develop strategies of control to improve building yearly energy consumption. As mentioned previously, a sophisticated daylight model is being developed to improve natural light contribution. Furthermore, liquid crystal variable opacity filter prototypes will be characterized in order to give more precise optical properties to implement into the models.
Chapitre 3 Article de simulation énergétique
Titre
INTEGRATION OF SMART WINDOWS INTO BUILDING DESIGN FOR REDUCTION OF YEARLY OVERALL ENERGY CONSUMPTION AND PEAK
LOADS
Co-auteurs
Jean-Michel Dussault, Louis Gosselin, Tigran Galstian
Journal
23 Abstract
The purpose of this work is to investigate the potential of diminishing the energy consumed by typical low thermal mass office buildings for heating, cooling and lighting by using smart windows. The windows considered consisted of a double pane glazing unit in which a controllable absorbing layer is added on the interior surface of the exterior glass pane. This absorbing layer allows to change the optical properties of the window, resulting in a direct potential of control of the incident solar heat flux entering the building through the windows. A corresponding numerical model is developed showing that optimizing the solar heat flux absorption rate of the absorbing layer in regard of the necessary heating, cooling and lighting needs helps reducing significantly the total yearly energy consumption, and cooling peak loads. The simulations were done considering a building located in Quebec City, Canada.
24 3.1 Introduction
Window glazing has evolved dramatically since its first appearance on buildings. Just a few decades ago, typical glazing was formed of a single glass pane (R" around 0.17 m2K/W) in order to let natural light enter the building while separating conditioned space (i.e., building interior zones) from exterior conditions. However, simple glazing typically performs very badly energywise. To improve the thermal resistance of windows, sealed glazing units [20] have then been integrated to building designs. Insulated glazings are composed of multiple glass panes separated by air-filled cavities (or cavities filled with heavier noble gas) [21] (R" around 0.40 nTK/W) enabling a drastic reduction of heat transfer by conduction and convection through windows. Nowadays, insulated glazing units (IGUs) of 2 or 3 glass panes with argon gas filling are still the reference in the glazing field. However, they have been improved by introducing thin metallic coatings [22] (R" around 0,97 nrK/W), also known as low emissivity coatings (low-E) [23][24], in the late 1970s and early 1980s on well-targeted surfaces of the glass panes in order to enhance the control of radiative heat transfer.
Despite of these improvements, realized in terms of glazing energy performance over the years, windows still constitute the weakest components of the building envelope, and yet, actual urban development involves the construction of large office buildings with huge percentage of glazed areas [3][25]. Also, sustainable development is increasingly integrated in building designs [26]. Its goal is to improve performances in regard to environment, energy consumption and comfort. What that means in terms of glazing is that designers try to propose the best combination of high visible solar transmittance and low heat transfer conductance. There is thus a call for new advances or technological leapfrogs aiming at improving the overall performance of windows by considering simultaneously energy performance and visible transmittance that are both weighty criteria in today's building sustainable designs.
Among emerging glazing technologies are "aerogel" glazing [4] that provides a very high heat transfer conduction resistance, ventilated glazing [27] that limits heat
25 transfer with the help of controlled convection and "smart windows" (SWs) [28] that manage solar heat flux entering buildings by controlling the glazing opacity. Furthermore, photovoltaic technologies present a high potential for supplying an additional amount of renewable energy [29] if integrated with the latest window technologies like ventilated windows [5] or SWs [30]. SWs are defined as glass technologies whose optical properties can be controlled (e.g., by applying a voltage). Electrochromic (EC) [6][31][32] and liquid crystal (LC) [7][33] glazings are two of the main types of SW technologies. EC technologies need a small voltage in order to allow a chemical reaction to take place in the EC layer, resulting in a variation of the optical properties of the latter (mostly variations of absorption rates). On the other hand, among the LC technologies, PDLC (polymer dispersed liquid crystal) is the most commercially available technology (the applied voltage makes the PDLC layer to scatter light).
Some simulations have already been performed to evaluate the potential of specific SW technologies in warm climates [34]. These results, obtained from DOE-2.1D building energy simulation program, show among other parameters, the comparison of energy consumption and peak load reduction for different idealized or real EC windows with a maximum performance of an idealized narrow-band EC window offering reduction of about 39-41% electricity consumption and 36-39% for peak demand. These results were obtained by considering an EC glazing controlled to continuously meet a design illuminance level. However, the authors have mentioned that developments on predictive control algorithms shall improve furthermore the building energy efficiency. Thus, further studies on SWs considering different types of climates, SW technologies and sustainable development criteria, such as more efficient SW control strategies, can lead to important breakthroughs in building conception strategies and energy efficiency improvement.
This work presents heat transfer and lighting models of a building in a temperate climate with an integrated broadband absorbing SW glazing for four different façade orientations and the results of opacity optimization to achieve minimal energy consumption and peak loads. The optimization approach is based on a predictive control
26 algorithm and design strategies for the best performance/investment tradeoff are presented to integrate efficiently SWs into buildings.
3.2 Heat transfer modeling
The present thermal model was developed in order to calculate the transient heat
load (QHVAC) that the heating, ventilating and air conditioning (HVAC) system must
supply to keep the inside air temperature at a specified set-point value in a typical office building. Modeling and analysis have been performed with Matlab©. The following sub-sections describe how the hourly values of QHVAC were calculated. Property values used
for calculation are presented in Table 3.1.
Table 3.1 Thermophysical properties of the materials
Parameters Values Units
Floor slab properties
Cp.floor Pfloor
Glass conductivity
Kglass W/mK
Glazing cavity gas properties
" g a s
Surface visible emissivities
^window, visible ^workplane, visible Ewalls, visible 17.64x10" 0.016 21x10"'
Surface solar and IR emissivities
Eçlear £sw ETiAC ETiPS Esurf m /s W/mK
27
3.2.1 Building description
The zone considered consists of a single room with one totally glazed external wall, and five internal surfaces (i.e., three internal walls, a floor and a ceiling) which are assumed not to exchange heat with other zones of the building nor with the exterior and are assumed to reflect radiation diffusely. The model also considers a thermal mass included in a 2 in (50.8 mm) thick concrete floor slab in which ID heat transfer have been considered. Such a floor slab means that the building has a low thermal mass. Further works should analyse the effect of higher thermal masses. The room dimensions are a width of 5 m, a depth of 5 m, and a height of 3 m. The exterior wall is a double glazed window with 12.7 mm 90% argon/10% air filled gap. Also, the interior set point temperature is supposed to be constant throughout the year, Tjn = 20°C. This interior temperature has been selected considering a mean acceptable temperature for winter and summer climates. Further works will consider temperature fluctuations as detailed in ASHRAE 55 standard. Furthermore, since the only thermal mass considered is that of the floor slab, interior walls and ceiling are assumed to be at the same temperature, Twaus =
Tin.
Solar radiation incident on the façade and exterior temperature have been determined from CTMY2 (Canadian Typical Meteorological Year) database for Quebec City, Canada (latitude = 47° north, longitude = 71° west). In addition to the SWs, different types of window glazing have been simulated for the sake of comparison: (i) clear glass IGU (neither added tint nor low-E coating); (ii) IGU with a TiPS low-E and (iii) IGU with a TiAC low-E coating. These represent the products among the most currently sold on the current market. Since no framing or thermal bridge have been considered for the glazing, heat transfer through the window is ID. The heat transfer model also assumes that the direct solar radiation passing through the window is distributed uniformly over the floor area and the diffuse solar radiation is distributed over the floor, ceiling and internal walls weighted by the appropriate view factors [35]. Moreover, solar radiation is assumed to be totally absorbed by internal surfaces and then reemitted as longwave infrared. The window is considered as an opaque surface for
28 internal radiation. Also, since internal walls and ceiling are at the same temperature, they are considered as a single surface in the radiation balance calculations. Solar radiation entering the building is then accounted for in the overall energy balance in the form of additional heat sources applied at the glazing ((.soiar.giazing), at the walls/ceiling surface
(Gsoiar.waiis) and at the floor upper surface (Qsoiar.noor). As will be shown later in Section
4.1, this approach was able to predict the heat load with a satisfactory precision.
The external glazed wall is subject to a constant exterior convection coefficient, hout = 20 W/m2 K [17], and to external hour-by-hour temperature variations. The interior walls and ceiling are subject to interior convection, hin = 4 W/m" K, and the air-to-floor convection coefficient is htloor= 1 W/m2 K [18].
The makeup air is represented by a thermal air change resistance (RAir change) and considers a rate of 9.44 l/(s-person) necessary during occupancy hours. Furthermore, a heat exchanger has been considered with an efficiency of heat recovery of 60%.
Finally, since SW technologies only affect sensible loads, latent load is not considered in this article.
3.2.2 Integration of variable opacity filter
Since the technology of EC SW seems to be the most viable for SW at this time, the SW technology, modeled in this work, is an idealized broadband filter controlling the solar radiation by absorption. This control is achieved with an opacity filter on surface two of the IGU. In the present case, the term "opacity" refers to the solar absorption rate of the filter.
In the glazing industry, to each glass pane surface is given a number in relation to its order, starting from the exterior surface. Fig. 3.1 illustrates the surface indices of a double glazed window. As shown in Fig. 3.1, the variable opacity filter is fixed to the inner surface of the outer glass pane (surface 2). This decision is taken mainly for two
29
reasons. First, the filter needs to be installed on an inner surface (2 or 3) for protection (e.g., against direct UV, scratching, etc.). Second, during solar radiation peak hours in summer, the filter will absorb a huge amount of energy resulting in an important increase of the filter temperature. In order to limit the solar heat gain, it is thus more convenient to dissipate the heat outside of the building with a hot surface 2 than it would have been with a hot surface 3. This way, we assure a more reasonable range of temperature operation for the variable opacity filter, and minimize the solar heat gain when the filter is active. A variable opacity filter fixed on surface 3 and having a high temperature may also cause discomfort for occupants close to windows.
Fig. 3.1: Double glazed smart window
In the present model, the variable opacity filter is controlled by determining its total absorption coefficient (Asw)- For SW control, this parameter is related to the voltage applied on the filter that drives the absorption rate of the latter, as well as the incidence angle that influences the optical path length in the filter. The optical properties of the glazing have been calculated using Fresnel theory [35] for parallel multisheets of glass considering a double clear IGU with an absorptive film on surface 2. This approach means that properties of a clear IGU are used when the film is at the bleach state, allowing to evaluate the full potential of SW technologies. Although high clarity in the off mode is desirable from an architectural point of view, current EC technology tends to yield glazing with lower transmittance than standard glazing [28]. However, it is believed
30
that future SW developments could increase the range of opacity for solar energy management [36]. With these calculated optical properties, solar heat absorbed by the exterior and interior glass panes, represented respectively by Qsoi,absi and QSOi.abs2 and including the variable opacity filter for the exterior pane, could be found with the following relations:
Vsol,absl = V^gla.«out.direct+^SW,direct / ^ d i r e c t + \ ™ glass out.diffuse +™SW,diffuse / ^ d i f f u s e ^ - U
^<sol. abs2 — V glass in.direct / ^direct """ \ ^glass in.diffuse / ^diffuse \?'*-)
with the absorption rates (A) being calculated by Fresnel theory and dependant of the of the variable opacity filter a, i.e. parameter that one could control in the present concept of SW.
3.2.3 Internal heat gains
The internal heat gains modeled are those related to lighting, occupants and equipments. The thermal effect of lighting separates in two distinct phenomena, i.e. a portion of energy required for lighting is directly transformed into heat transferred to the room (Qiight. conv) while the other portion corresponds to the radiation emitted by the lighting devices (Qught, rad watts and Qlight, rad tioor)- Depending on the lighting device, convective and radiative portions will be different. In this study, we considered standard fluorescent tubes with 59% of radiative lighting and 41% of convective lighting with fixtures having a 20% heat-to-return [18]. In order to determine radiative heat flux reaching each internal surface, we assume for simplicity a total lighting power spread uniformly over the ceiling surface and emitted diffusely. Other configurations have been tested and similar results have been obtained. The total artificial lighting power considered for calculation is 586.3 W for all the different possible orientations of the glazing façade. This value guarantees that a minimum illuminance value of 400 lx is respected during occupancy hours throughout the year (see Section 3.3.2).
31
The other internal heat gains are from occupants and miscellaneous equipments [18]. For both these gains, we considered 30% of convective heat gain (Qoccapams,conv and Qmiscellaneous.conv) and 7 0 % of radiative heat gain (Qoc.upants.rad_ walls, Qoccupants.radjloor* Qmisceiianeous.rad_waiis, and Qmisceiianeous,rad_tioor). T h r e e o c c u p a n t s are considered in the m o d e l ,
each occupant is assumed to generate a total of 73 W and we supposed a miscellaneous equipment power surface density of 8 W per m" of floor area. Occypancy hours are from 8 AM to 5 PM all year long. Occupation rate is assumed to be 100% during occupancy hours.
Internal heat gains are represented in Fig. 3.2 by Qair, Qwaiis and Qnoor- These quantities are defined as follows:
^tair ^light.conv ^occupants.conv ^tmiscellaneous.coiiv s ■ / a w a i t s ^ light,rad_ walls ^occupants,rad _walls ^miscellaneous,rad_walls ^ * ^
^ f l o o r ^ light,rad_tloor ^occupants,rad_ floor ^miscellaneous,rad_floor
The schedule for internal heat gains follows the occupancy hours.
3.2.4 Mathematical modeling
This section integrates the different building considerations presented from Section 3.2.1 to 3.2.3. Figure 3.2 shows a thermal circuit of the system considering thermal nodes (7*...), thermal resistances (/?...), thermal mass ( C J and internal heat sources (Q...)• To facilitate the reading of Fig. 3.2, only one capacitance is shown for the floor thermal mass, but in our calculations, the floor was represented by 30 capacitances and resistances in series in order to represent accurately the behavior of the thermal storage in the floor. Fewer capacitances were tested and did not change the results. However, thermal storage is modeled with 30 capacitances in case simulations are run considering a thicker floor slab.
32
Qait OwalU Qflo.
■nonv oui r—Wv—i r-AA/V—i ' s.dlt . . . ' _ I . . . ' t Wv • Wv—— M / V H I*rad nut
R ■oml.uliiw/v "Vond. jzlass
<_ol.»bsl i M A v i ^ W V i ^ ^ V v -V -V -V T,„/Trails V L jW VJ •Vad gap
<Vond,glass/v •Vond.glass/V "Vol
Vsol.abs2 VSolar. glazma
in ' ' W a l l s . . . 1 floot w* / \ "Vonx. floor y \ Qsolar.walls O s o l a r f -fltxtr wv ■*■ \ n change
Fig. 3.2: Thermal circuit representation of the building with a smart window
The methodology used to obtain QHVAC consists in performing an energy balance
at each node of the circuit, grouping the resulting set of equations into a matrix equation, and solving for the unknowns (i.e., Tsout, Tg.,, Ti, T2, Tg)2, Ts.in, QHVAC and Tnoi)r). Because of non-linearity, an iterative procedure is required at each time step. This procedure starts with guessed values for the unknowns and re-evaluates them as long as the error between the resulting values at step / and the values obtained at step i-\ is higher than 10"5. The error is evaluated by:
Errjtl =max
T - T
'/ /
(3.6)
More stringent convergence criteria were tested and did not change the results. When the convergence criterion is achieved, we advance to the next time step.
3.3 Lighting modeling
The following subsections describe the model developed to determine the daylight and artificial lighting levels on a workplane depending on window features. The lighting modeling has been developed by dividing the interior room surfaces into a grid of small control surfaces and then by calculating the net luminous interactions between each of these elements. Namely, the room surfaces have been divided into a grid of 9 x 9
33
elements on the floor and ceiling, with eight elements in the vertical direction, resulting in a total grid of 450 small control surfaces.
3.3.1 Daylight modeling
Natural daylight has a direct impact on building energy consumption since it affects the necessary amount of artificial light required to provide a convenient luminosity on workspaces. It is then crucial to evaluate properly the intensity and distribution of daylight on workspaces in order to size and control efficiently the artificial lighting systems and also the variable opacity filter.
The daylight model developed in this work can be subdivided in two different sections, i.e. the sky contributions and the interior space daylight distribution. For the purpose of this study, a uniform sky model has been considered. Since values of direct and diffuse irradiance are easily available from CTMY2 database, the sky contributions in the present model refer to the normal direct solar irradiation in addition to the integrated diffuse solar irradiation. Luminous values are found by multiplying these solar irradiation values by their respective luminous efficiency, available into eQUEST 3-63 weather database. Furthermore, to evaluate the contribution of natural lighting on a workplane of interest into a building, the model follows a method for interior daylight distribution very similar to that of Lehar and Glicksman [37]. This model calculates all the luminous interactions between each elements of the grid to finally obtain the resulting total illuminance distribution field on the workplane. The main computational steps of the model are the following:
1. Daylight initialization
2. Daylight reflection iterations for interior surfaces 3. Workplane initialization